⚡ Key Numbers — URA Q2 2026 Private Residential PPI Flash Estimate
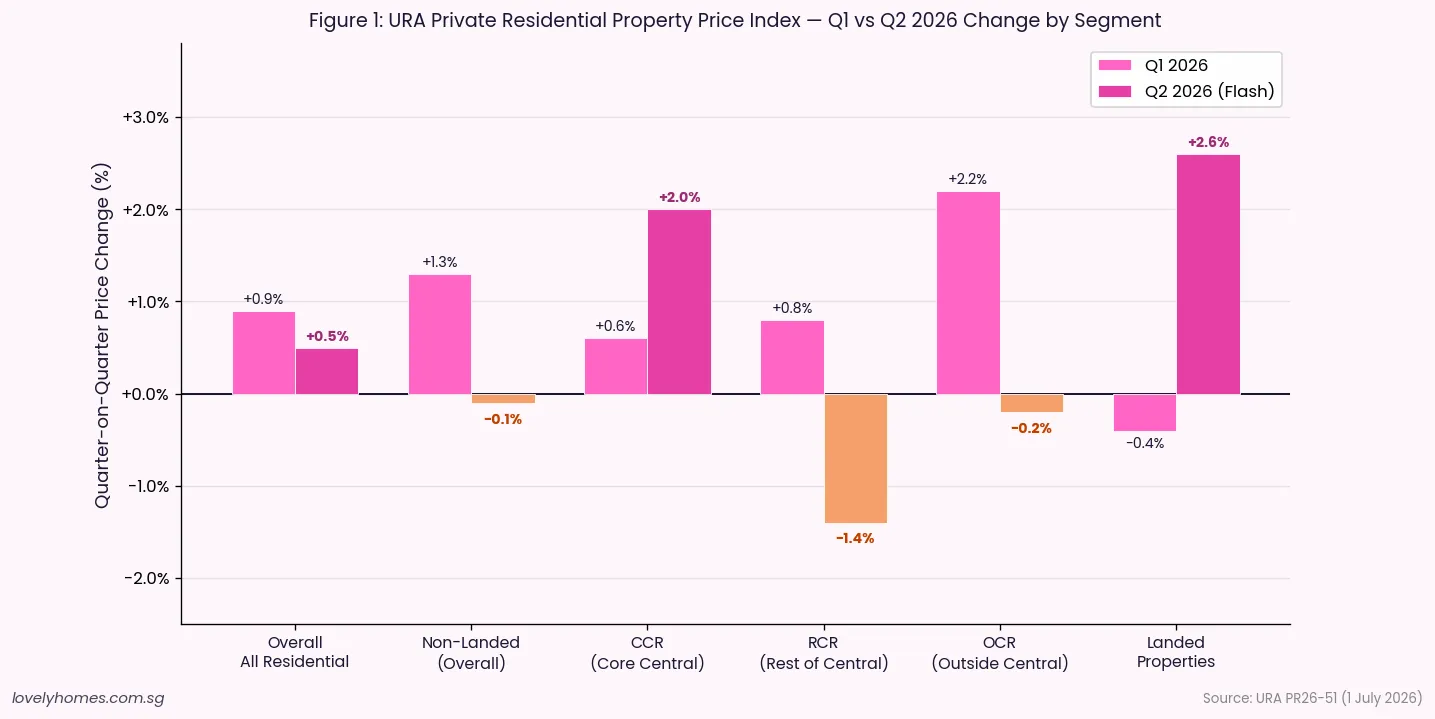
- Overall PPI: +0.5% quarter-on-quarter in Q2 2026, decelerating from +0.9% in Q1 2026.
- Non-landed properties (overall): –0.1% in Q2 (vs +1.3% in Q1) — a broad softening across the mass and mid-tier segments.
- Core Central Region (CCR): +2.0% in Q2 (vs +0.6% in Q1) — the only non-landed segment to accelerate, driven by luxury demand.
- Rest of Central Region (RCR): –1.4% in Q2 (vs +0.8% in Q1) — the weakest segment this quarter.
- Outside Central Region (OCR): –0.2% in Q2 (vs +2.2% in Q1) — sharply slower after the strong new-launch-driven Q1 performance.
- Landed properties: +2.6% in Q2 (vs –0.4% in Q1) — a notable reversal and the strongest segment in Q2.
- Transaction volume: 5,420 units (up to mid-June 2026), broadly flat versus 5,413 in Q1.
- Full Q2 statistics to be released by URA on 24 July 2026.
What the URA Flash Estimate Tells Us About Q2 2026
On 1 July 2026, the Urban Redevelopment Authority (URA) released the flash estimate of Singapore’s private residential property price index (PPI) for the second quarter of 2026. The headline figure — a 0.5% quarter-on-quarter increase — confirms a continuing but moderating upward trend in private home prices. The deceleration from Q1’s 0.9% gain reflects a more complex underlying picture: diverging fortunes between CCR luxury units and the mid-tier and mass-market segments, alongside a significant turnaround in landed property pricing.
Flash estimates are compiled from stamp duty submissions and developer sales data covering 1 April to mid-June 2026. URA notes that past estimates have differed from final figures and advises the public to interpret them with caution. The full Q2 dataset — including rental, vacancy and supply statistics — will be released on 24 July 2026.
Segment-by-Segment Breakdown
CCR: Luxury Demand Re-Emerges
The Core Central Region posted the strongest non-landed performance in Q2 2026 at +2.0%, up from a modest +0.6% in Q1. The CCR comprises Districts 9, 10, 11 and the Downtown Core and Sentosa Cove — Singapore’s prime and ultra-prime residential markets. The acceleration reflects continued interest from overseas buyers (particularly those from Southeast Asia and Europe), ABSD-resilient demand at the upper end, and limited new launch supply in the CCR pipeline for the remainder of 2026. Several analysts had anticipated a softer CCR following the 60% ABSD rate for foreigners introduced in April 2023; instead, those who remain in the market appear to be purchasing at higher price points.
RCR: Sharpest Correction
The Rest of Central Region posted the weakest result at –1.4% after a +0.8% gain in Q1. The RCR — encompassing the city fringe and established residential neighbourhoods — had benefited strongly from new launch activity in 2024 and early 2025. With fewer significant launches pricing in during Q2 2026 and buyers digesting earlier purchases, the RCR has retreated modestly. This is not unusual: RCR prices tend to be more launch-driven and can oscillate more sharply quarter-to-quarter than the CCR or OCR.
OCR: Post-Launch-Boom Cooling
The Outside Central Region, which drove Singapore’s 2024–2025 private property rally on the back of strong new BTO and EC launches drawing first-timer upgraders, slipped 0.2% in Q2 after a 2.2% surge in Q1. The normalisation is expected — Q1’s exceptional OCR performance was partly attributable to a cluster of well-received project launches recording strong take-up in the Jan–Mar window. Q2’s mild correction suggests that pricing has reached a level where buyers are exercising greater selectivity.
Landed: The Standout Performer
Landed property — comprising detached houses, semi-detached homes and terraces — rebounded sharply to +2.6% in Q2, reversing a –0.4% dip in Q1. The landed market is structurally limited in supply (foreigners cannot purchase landed property without Singapore Land Authority approval, and government resale restrictions apply to certain categories) and tends to recover quickly from short-term softness. The Q2 bounce aligns with a pickup in transaction volumes observed in the Good Class Bungalow (GCB) and semi-detached segments in prime districts.
Supply Context: Record GLS Output in 2026
URA simultaneously highlighted the Government’s sustained GLS (Government Land Sales) programme as the key supply-side stabiliser. The 2H2026 Confirmed List adds 4,745 private residential units, bringing the full-year 2026 Confirmed List total to 9,320 units — more than 50% above the 10-year annual average. When combined with the Reserve List, the total GLS pipeline for 2026 is the largest in over a decade.
| Metric | Value |
|---|---|
| Overall PPI change, Q2 2026 | +0.5% q-o-q |
| Non-landed overall | –0.1% q-o-q |
| CCR (non-landed) | +2.0% q-o-q |
| RCR (non-landed) | –1.4% q-o-q |
| OCR (non-landed) | –0.2% q-o-q |
| Landed properties | +2.6% q-o-q |
| Sale volume (to mid-Jun 2026) | 5,420 units |
| Q1 2026 volume (full quarter) | 5,413 units |
| 2H2026 GLS Confirmed List | 4,745 units |
| Full-year 2026 Confirmed List | 9,320 units (>50% above 10-yr avg) |
| Expected completions (next few years) | ~61,000 units (incl. ECs) |
| Full Q2 statistics release | 24 July 2026 |
What This Means for Buyers and Investors
📈 Analytical Note
The Q2 2026 flash estimate presents a nuanced picture rather than a simple upward or downward trend. The headline +0.5% masks significant divergence: CCR and landed properties are moving upward while the broader non-landed market (RCR, OCR) has softened or retreated modestly. For buyers, this suggests that bargaining power has returned somewhat in the mid-tier and mass-market segments, while CCR and prime landed command a premium and show no signs of price fatigue.
The record GLS supply pipeline — 61,000 units expected to complete over the next several years — is the most important structural factor for 2027 onwards. High supply typically dampens rental yields and constrains capital appreciation. Investors underwriting strong rental yield assumptions should pressure-test those models against the forthcoming supply wave.
MAS’s advisory to “exercise prudence” in the context of “highly uncertain macroeconomic outlook” is a consistent boilerplate, but the macro context in mid-2026 is genuinely uncertain: US tariff policy, global growth deceleration, and potential further geopolitical shocks could all affect Singapore’s export-dependent economy and, by extension, household income and property demand.
FAQ: URA Q2 2026 Flash Estimate
Why is the Q2 2026 flash estimate only partial data?
Flash estimates are compiled from stamp duty payment data submitted to IRAS and developer sales figures covering only the first two and a half months of the quarter (1 April to approximately mid-June). They do not include all transactions completed in June and cannot account for late-filed stamp duty submissions. URA releases full statistics, including rental, vacancy and pipeline data, at the end of July. The flash estimate is intended to give early market guidance, not a definitive picture.
What is driving CCR’s outperformance in Q2 2026?
CCR outperformance typically reflects foreign buyer demand, ultra-high-net-worth activity, and limited new supply in prime districts. Despite the 60% ABSD on foreign purchases introduced in April 2023, a residual pool of buyers for whom ABSD is not prohibitive — often high-net-worth individuals from Southeast Asia, India and Europe — continues to underpin CCR pricing. Domestic demand for CCR properties has also been relatively firm among Singapore Citizens and PRs trading up from large OCR condominiums.
Is the OCR correction a sign of a broader market downturn?
A –0.2% quarter-on-quarter movement is well within normal volatility for the OCR segment and does not signal a broad downturn. OCR prices tend to be more sensitive to the timing and reception of specific new launch projects; a quarter with fewer strong launches will naturally produce softer headline numbers. The underlying driver of OCR demand — the HDB upgrader pipeline, which remains robust given the volume of BTO completions expected in 2025–2027 — is structurally intact.
How does the GLS supply pipeline affect property prices?
High GLS supply expands the stock of private housing over a 3–5 year horizon as sites are tendered, developed and completed. More completions increase rental supply, which typically compresses rental yields, and adds to the inventory available for resale. Historically, URA has calibrated the GLS programme to balance supply and demand; a 9,320-unit Confirmed List in 2026 signals the government’s intent to sustain supply-side pressure on prices and rents. The full impact on capital values will depend on how quickly completions translate into market inventory and how strongly household formation and investment demand absorb the new supply.
When will the full Q2 2026 URA statistics be released?
URA has stated that the full set of real estate statistics for Q2 2026 will be released on 24 July 2026. The full release will include the definitive PPI (which may differ from the flash estimate), rental index, vacancy rates, pipeline supply and transaction volume by district and property type. LovelyHomes will publish a detailed analysis of the full Q2 2026 data upon release.
📚 Related Articles
- Singapore Property Cooling Measures 2026: ABSD, TDSR, LTV and SSD
- ABSD Singapore 2026: Complete Guide to Additional Buyer’s Stamp Duty
- JLD White Site Launched 3 July 2026: Up to 1,200 Homes at Jurong Lake District
- En Bloc Sale Singapore 2026: Complete Guide to Collective Sales
- Private Property Buying Guide 2026: Eligibility, ABSD and Financing
Supporting graphics
Original article illustrations are available below.