Singapore GLS Guide 2026: How the Government Land Sales Programme Works
- The Government Land Sales (GLS) programme is the primary mechanism by which the Singapore government releases state land for private residential, commercial, and mixed-use development.
- GLS operates through two lists: the Confirmed List (sites released on a fixed schedule regardless of demand) and the Reserve List (sites released only when triggered by developer interest).
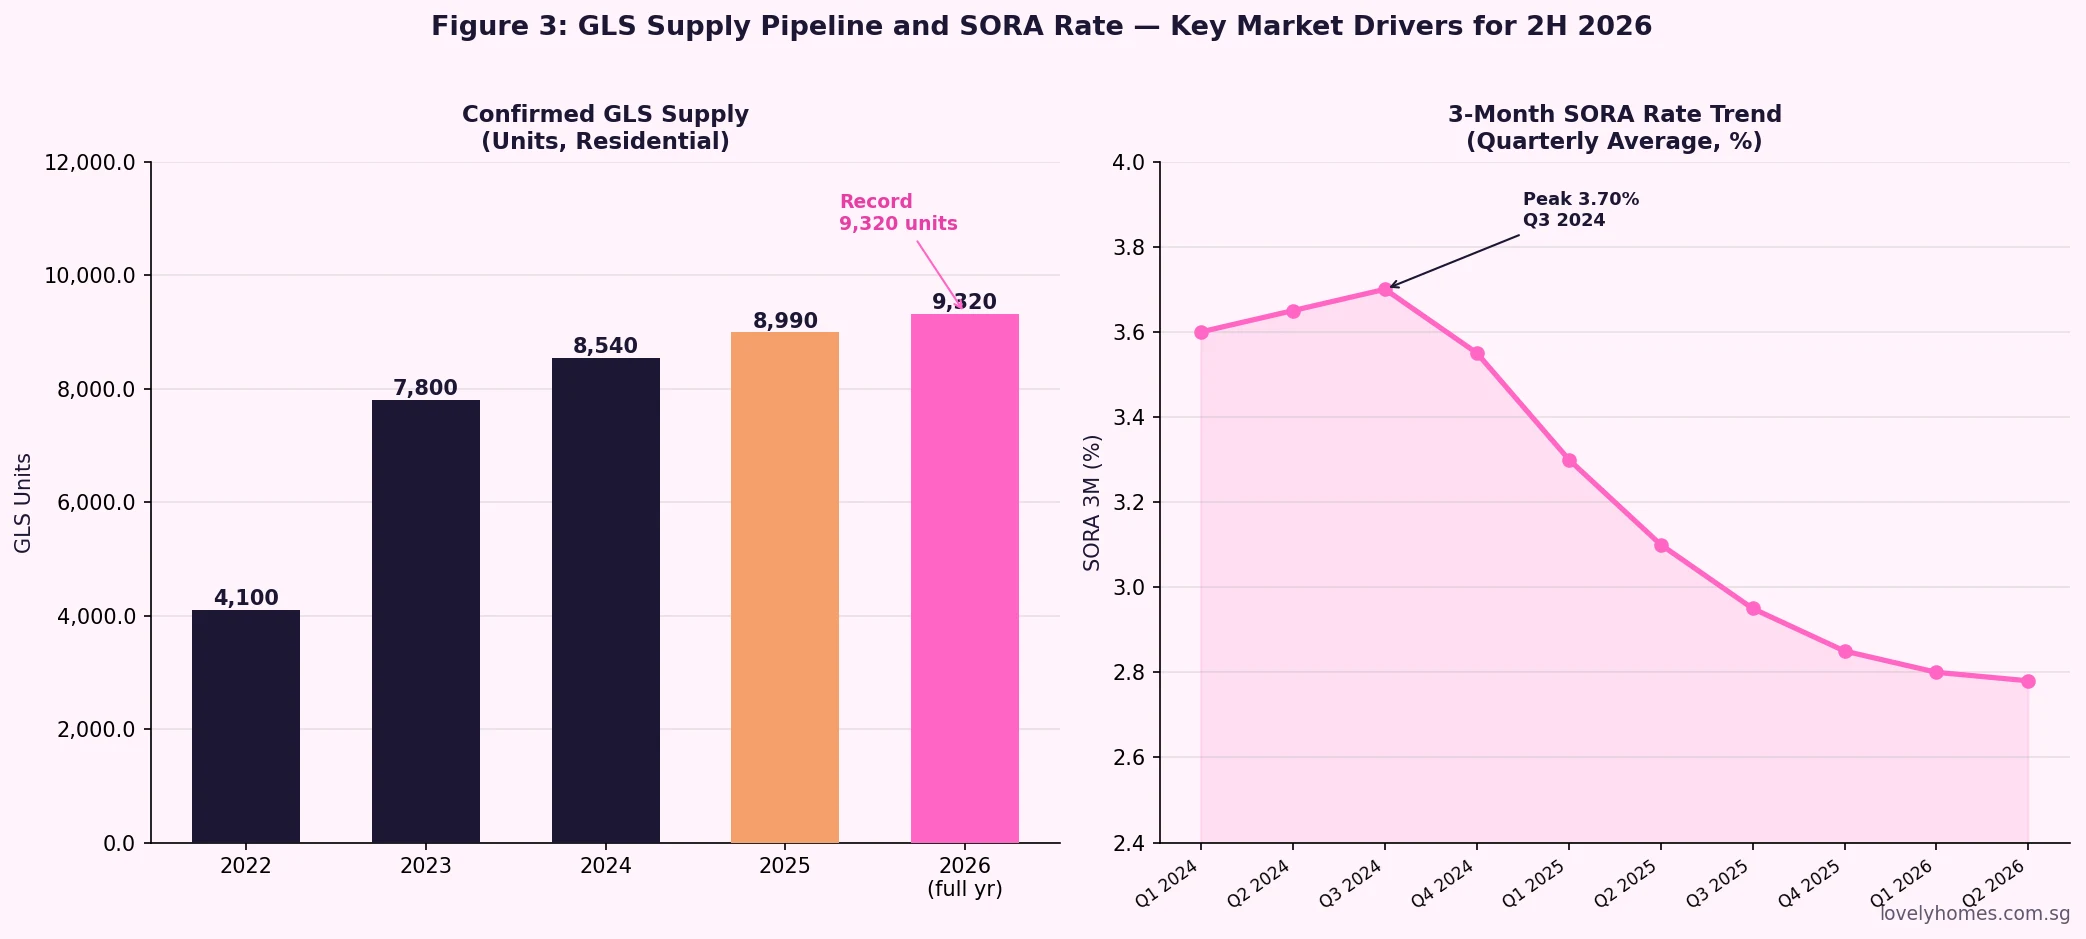
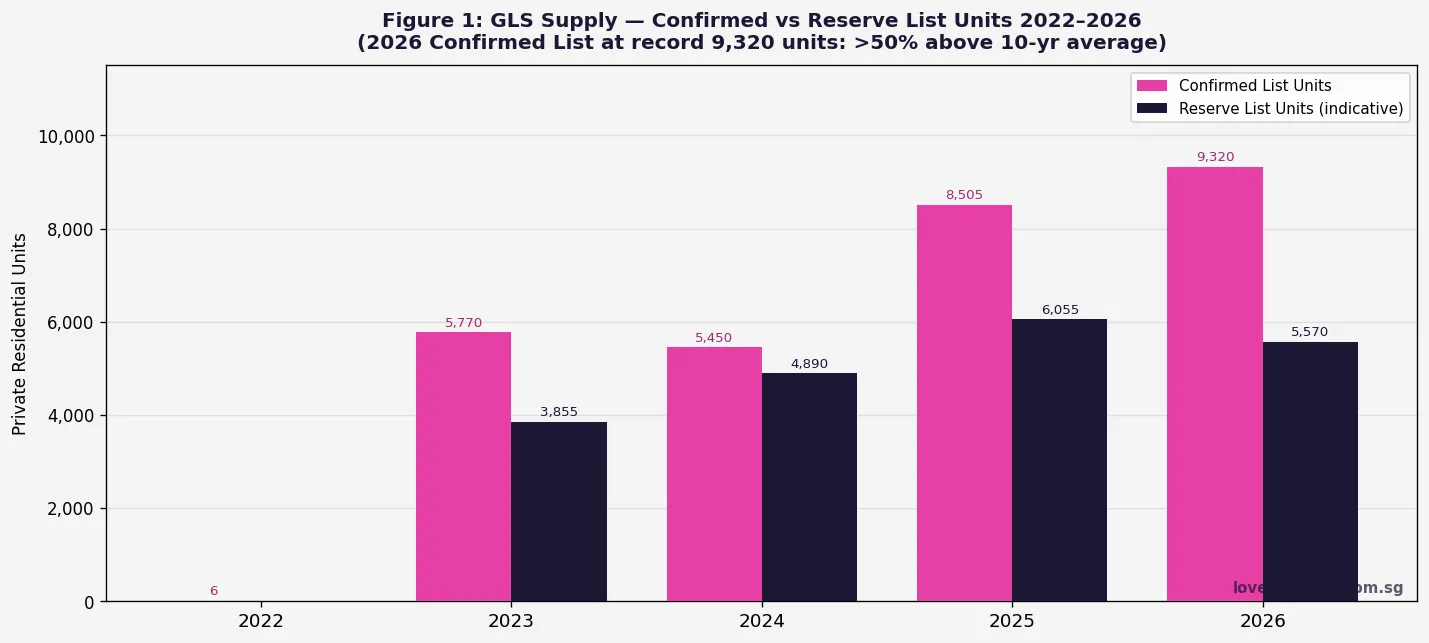
- For 2H 2026, the Urban Redevelopment Authority (URA) placed 9 sites on the Confirmed List yielding 4,745 residential units — part of a full-year record of 9,320 units, over 50% above the 10-year annual average.
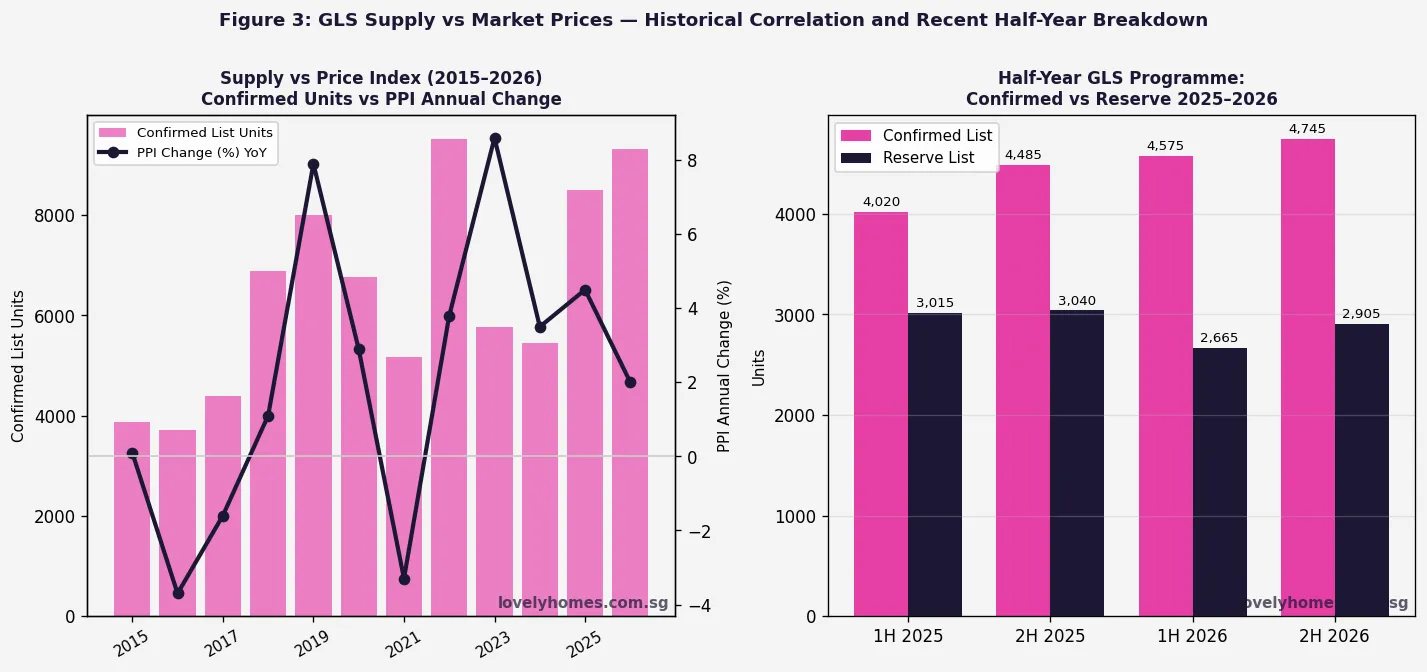
- GLS supply directly influences new launch pricing: high supply generally moderates price growth; constrained supply in 2021–2022 contributed to the sharp private property price surge of 8–10% per year.
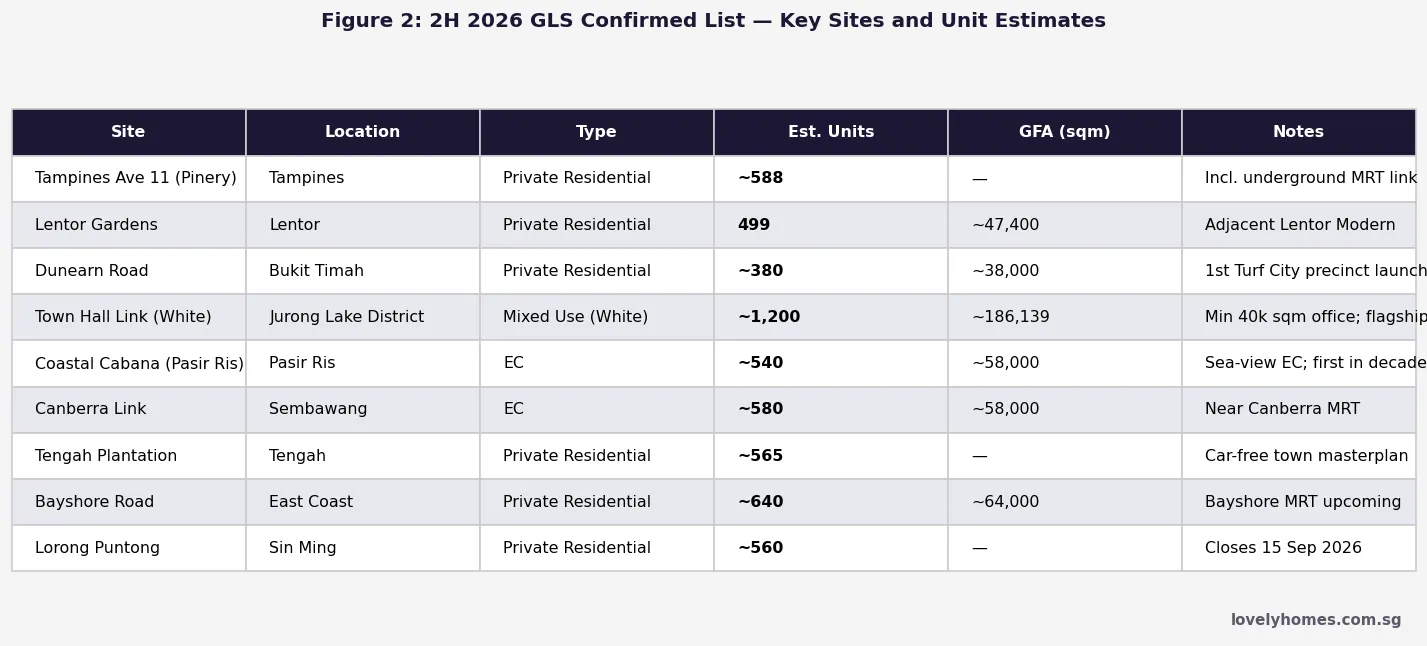
- Key 2H 2026 sites include the JLD White Site (Town Hall Link, up to 1,200 units plus major office component) and new launches at Lentor Gardens, Dunearn House (Turf City), and two EC sites.
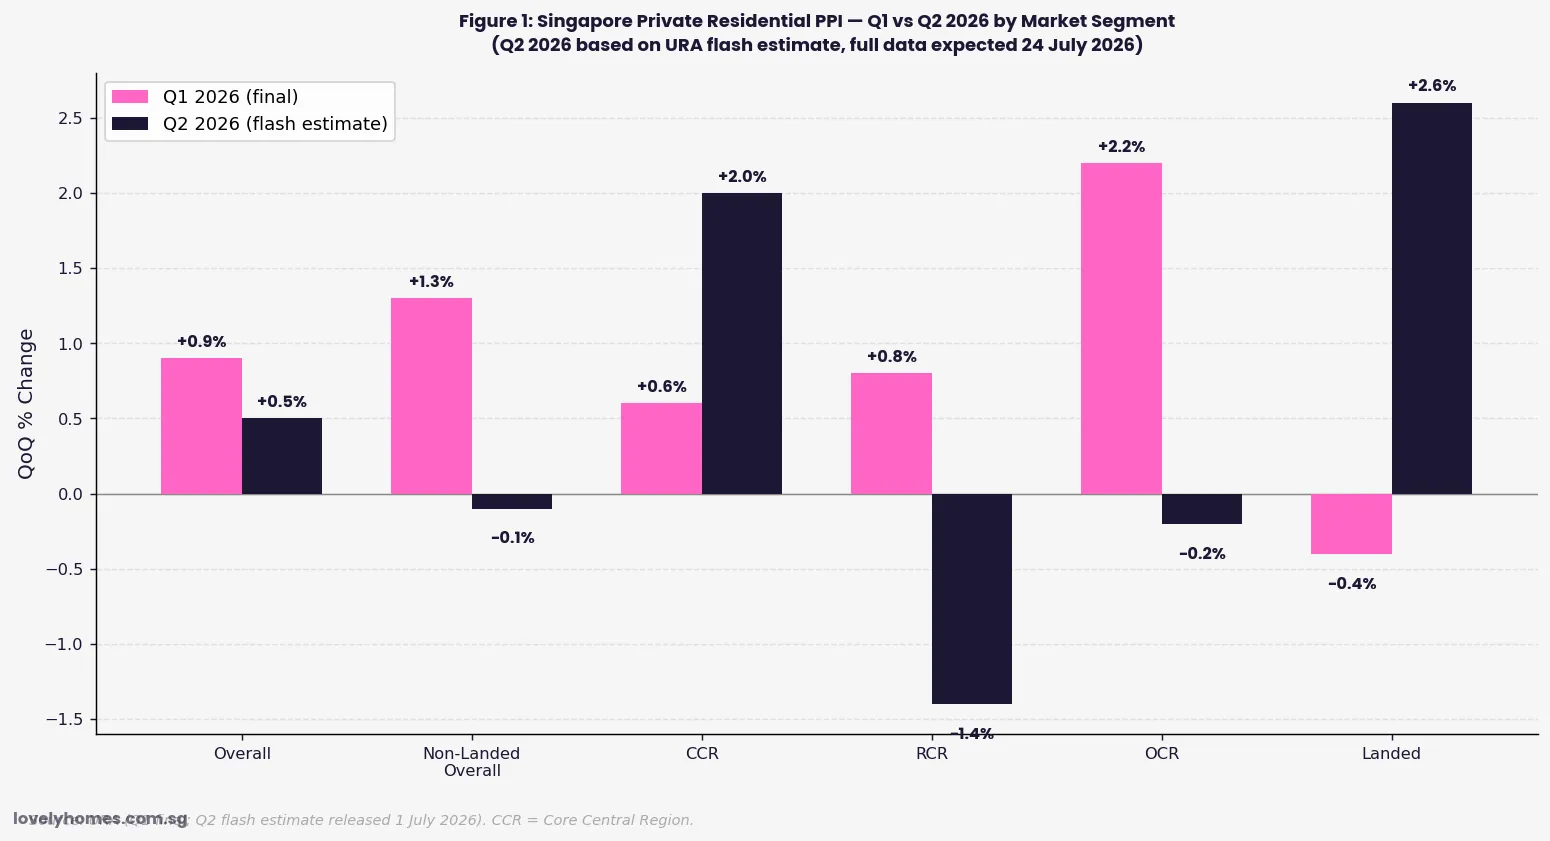
- The full-year Q2 2026 private residential statistics — including detailed take-up by GLS site — will be released by URA on 24 July 2026.
- Understanding GLS helps buyers and investors anticipate pipeline supply, assess whether a launch represents fair value, and time their entry into the market.
What Is the Government Land Sales Programme?
The Government Land Sales programme is administered by the Urban Redevelopment Authority (URA) and the Housing and Development Board (HDB) on behalf of the Singapore Land Authority (SLA) and the Ministry of National Development (MND). Since its formalisation in the 1990s, GLS has been the cornerstone of Singapore’s land supply policy — ensuring that private housing, commercial space, and mixed-use developments remain adequately supplied to meet demand without stoking speculative excess.
Each calendar half-year (1H and 2H), the government announces the GLS programme for that period, specifying which sites will be sold and whether they sit on the Confirmed List or the Reserve List. Developers bid for these sites through public tender, and the winning bid — assessed not only on price but on concept proposals for White sites — determines the land cost that ultimately feeds into new launch pricing.
For property buyers, the GLS programme is the earliest possible signal of future new launch supply. A large Confirmed List means more launches in 12–24 months; a reduced supply signals potential price pressure. Singapore’s land supply policy is explicitly counter-cyclical: the government increases GLS supply when prices rise strongly, and eases it when the market softens — a pattern clearly visible in the data since 2010.
Confirmed List vs Reserve List — How They Work
The two-list structure is deliberately designed to balance certainty of supply with responsiveness to market conditions.
Confirmed List sites are released for tender on a published schedule regardless of developer demand. These sites represent the government’s baseline supply commitment for the half-year. Developers know the tender timeline in advance and can plan their acquisition strategy accordingly. The Confirmed List is typically used for sites in areas where the government has strong urban planning reasons to catalyse development — for instance, new growth corridors like Tengah, Jurong Lake District, or the Greater Southern Waterfront.
Reserve List sites are only triggered when a developer submits an Application to Purchase (ATP) committing to a minimum price. If the government finds the minimum price acceptable, the site is formally launched for tender. If no developer submits an ATP, the site remains undeveloped. Reserve List sites thus act as a buffer — they expand effective supply precisely when developer appetite is high, dampening the price spikes that a purely fixed-supply regime might allow.
The 2026 GLS Programme — Record Supply
The 2026 GLS programme represents the most aggressive supply injection since the post-2013 cooling measures suppressed demand. For the full year 2026, the Confirmed List totals 9,320 private residential units (including 735 Executive Condominium units) across two half-year programmes, plus substantial commercial and white-site GFA.
The 2H 2026 Confirmed List, announced by URA, comprises eight private residential sites and one White site, with a combined potential yield of 4,745 private residential units (including 735 EC units) and 83,350 sqm gross floor area (GFA) of commercial space. Taken together with 1H 2026’s 4,575 units, the full-year total of 9,320 units is over 50% higher than the past 10-year annual average of approximately 6,100 units.
The Jurong Lake District White Site — Singapore’s Most Ambitious GLS Parcel
The centrepiece of the 2H 2026 GLS programme is the White site at Town Hall Link in Jurong Lake District (JLD), launched for tender on 3 July 2026 (URA Press Release pr26-53). White sites differ from standard residential or commercial tenders: developers must propose a concept for the entire parcel, and evaluation criteria include urban design quality, environmental sustainability, and integration with the surrounding masterplan — not just the land bid price.
The JLD White site has a total potential GFA of 186,139 sqm, comprising a minimum of 40,000 sqm of office space, up to 1,200 private residential units, and 44,000 sqm of complementary uses (retail, hotel, community facilities). The site reflects the government’s vision to transform Jurong into Singapore’s second Central Business District — a project that has been two decades in the making and will reshape the western corridor of Singapore’s property market. The tender closes on 17 November 2026.
How GLS Pricing Flows to New Launch Prices
The relationship between GLS land cost and new launch prices is direct but not perfectly linear. Developers account for land cost, construction cost (currently elevated at approximately S$450–S$600 per sqft for mid-range condominiums, driven by labour and materials), financing charges, and their target margin (typically 12–20%) when setting indicative prices. The break-even price for a developer with a land cost of S$1,200 psf ppr (price per square foot per plot ratio) and build costs of S$530 psf might be approximately S$1,800–S$1,900 psf at a target yield — before marketing and sales overheads.
This is why GLS tender results, when reported by URA, attract intense industry scrutiny. A land bid that exceeds market expectations (a “bullish bid”) signals that the developer expects strong selling prices; a conservative bid signals caution. The Lentor Gardens site (land cost approximately S$920 psf ppr), resulting in launch prices averaging S$2,350 psf, illustrates the mechanics: at a plot ratio of approximately 2.5, the land contribution per saleable sqft works out to roughly S$920 / 2.5 ≈ S$368 psf, plus build cost, fees, margin.
GLS and the Executive Condominium (EC) Market
ECs occupy a unique position in the GLS framework. EC sites are sold exclusively to developers who must then offer the units to eligible buyers (Singapore Citizens and SPRs meeting HDB income and eligibility criteria) at capped prices before the EC is privatised after 10 years. The MND sets EC GLS sites separately from standard private residential sites, with two EC sites on the 2H 2026 Confirmed List: Coastal Cabana at Pasir Ris (approximately 540 units) and a site at Canberra Link (approximately 580 units). The effective land cost per EC unit is generally lower than private residential, reflecting the restrictions on initial buyer eligibility and resale during the Minimum Occupation Period (MOP).
Notably, from 8 May 2026, the MOP for future EC sites (those with tender closing dates on or after that date) was extended from 5 years to 10 years — a significant policy tightening that reduces the liquidity appeal of ECs as investment vehicles while preserving their affordability role for first-time buyers. The 2H 2026 EC sites are subject to this new 10-year MOP requirement.
Summary Table: GLS Programme 2025–2026 at a Glance
| Parameter | 1H 2025 | 2H 2025 | 1H 2026 | 2H 2026 |
|---|---|---|---|---|
| Confirmed List Units | 4,020 | 4,485 | 4,575 | 4,745 |
| Reserve List Units (est.) | 3,015 | 3,040 | 2,665 | 2,905 |
| Total Programme | 7,035 | 7,525 | 7,240 | 7,650 |
| EC Units (within Confirmed) | 640 | 695 | 0 | 735 |
| White Sites | — | — | — | 1 (JLD Town Hall Link) |
| Commercial GFA (Confirmed) | ~28,000 sqm | ~32,000 sqm | ~35,000 sqm | 83,350 sqm |
| Full-Year Confirmed | 8,505 (2025) | 9,320 (2026) — 10-yr high | ||
Worked Example: Reading a GLS Tender Result as a Buyer
In June 2026, Kingsford was awarded the Lentor Gardens site at approximately S$920 psf ppr (price per square foot per plot ratio) against a site area of approximately 18,900 sqm and a gross plot ratio of 2.5, yielding 499 units. The land cost per saleable unit works out to approximately S$920 × 2.5 × average unit size 500 sqft / 499 units ≈ S$2.3M land component per unit.
Adding estimated construction cost (S$530 psf × 500 sqft = S$265,000), developer overhead and margin (~15%), and marketing costs, the break-even for a 500 sqft unit is approximately S$2.9M to S$3.0M — or roughly S$5,800–S$6,000 psf break-even before profit. The launch average of S$2,350 psf implies a unit size closer to 700 sqft (S$1.645M average), consistent with the development’s product mix. This breakdown helps buyers assess whether a launch price is commercially justifiable or whether a developer is selling at a margin that leaves room for future appreciation.
The key takeaway: GLS land cost sets a price floor for the surrounding resale market. When developers pay record land prices, they launch at record prices — and those prices become the new benchmark for nearby resale units. Buyers tracking GLS results in their target district are effectively monitoring the minimum that future launches must achieve, and thus the direction of resale competition.
Why This Matters: Supply Overshooting vs. Structural Demand
The 9,320-unit 2026 Confirmed List is large by historical standards, but Singapore’s structural property demand is equally robust. Net household formation runs at approximately 20,000–25,000 per year, immigration adds a steady flow of new permanent residents and employment pass holders, and owner-occupier replacement demand (upgrading, right-sizing) generates consistent transaction volumes. Against this backdrop, even a record 9,320-unit programme represents roughly 4–5 months of annual demand absorption. Analysts at major research desks argue that the supply wave will moderate price growth — particularly in the Outside Central Region where GLS supply is most concentrated — but is unlikely to cause a sustained price correction of the magnitude seen in 2013–2017, when cooling measures and oversupply combined to push prices down approximately 12% over four years.
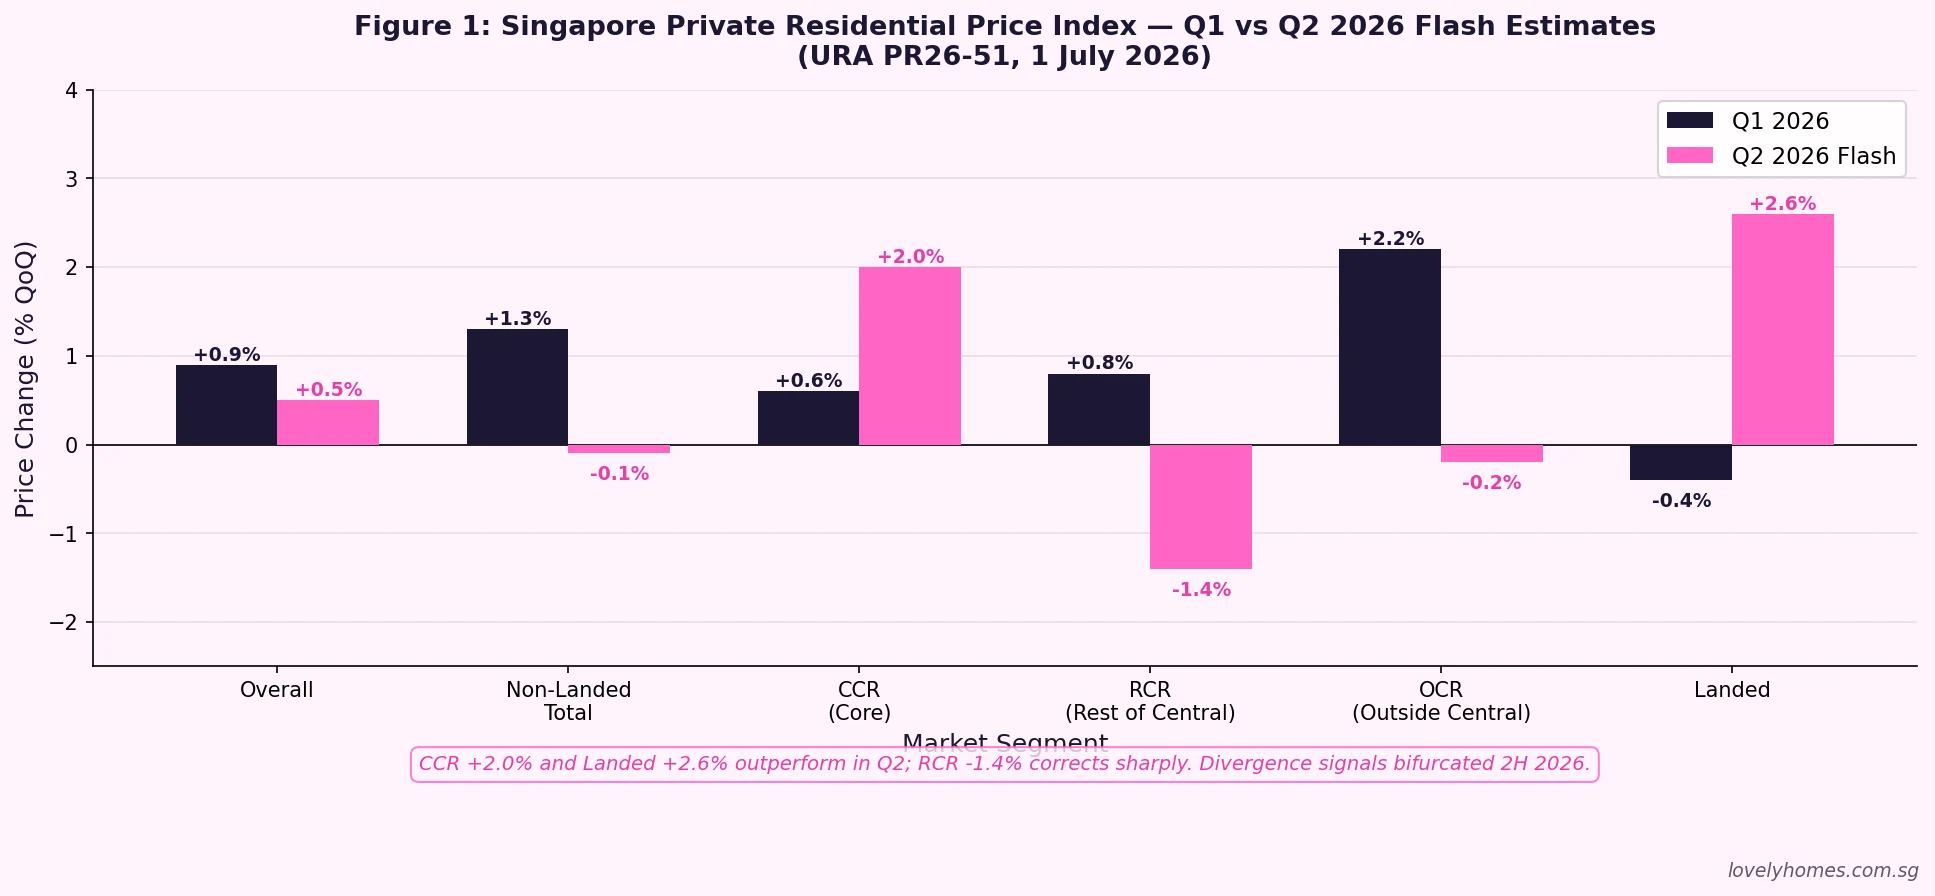
The Core Central Region and landed market remain structurally supply-constrained: fewer GLS sites exist in prime districts, freehold land is not created through GLS, and the luxury buyer profile is less sensitive to GLS supply volumes. This bifurcation between a moderating mass market and resilient prime and landed segment is the dominant property market narrative for the second half of 2026.
What Might Come Next
Several key GLS milestones are approaching in the remainder of 2026 and into 2027. The Lorong Puntong/Sin Ming site tender closes on 15 September 2026, and the JLD White Site tender closes on 17 November 2026 — both will be closely watched as barometers of developer confidence. URA’s full Q2 2026 private residential statistics, expected on 24 July 2026, will provide detailed take-up data for recent GLS launches and will likely influence the quantum of the 1H 2027 programme. If new-home sales remain above 7,000 units for the full year 2026, the government will likely maintain or even expand the confirmed list in 2027. If sales disappoint, a modest pullback in GLS quantum — as seen in 2015–2016 — is the most probable policy response.
Frequently Asked Questions
How long does it take from a GLS award to a new launch?
Typically 12 to 24 months. Once a developer wins a GLS tender, it must obtain planning approval, finalise the development’s concept and design, and satisfy various conditions before launching for sale. For straightforward residential sites, the timeline from award to launch preview is usually 12–18 months. For complex mixed-use or White sites, it can run to 24–36 months. The JLD White Site, for example, is unlikely to launch for sale before late 2028 or 2029, given the complexity of the development brief. Buyers tracking a GLS award as a proxy for future supply in their target district should add at least 18 months to the tender date to estimate when competition might appear on the market.
Can individual buyers participate in GLS tenders directly?
No. GLS tenders are open to developers and property companies, not individual buyers. The minimum land parcel values involved (typically S$200M to over S$1 billion for larger sites) and the development obligations attached to the tender conditions are designed for institutional participants. Individual investors participate in the GLS ecosystem indirectly — by purchasing units from developers who have won GLS sites and developed them into saleable projects. The closest an individual can get to a direct land transaction is through a collective sale (en bloc) of an existing strata development, or through a private land auction — neither of which is part of the GLS programme.
What is a White site and how does it differ from a standard residential GLS parcel?
A White site is a GLS parcel where the permissible uses are not pre-specified — the developer has flexibility to propose a mix of residential, commercial, hotel, and community uses, subject to minimum requirements and the Urban Redevelopment Authority’s concept proposal evaluation. Standard residential sites have a defined use (private housing), a specified gross plot ratio, and are awarded purely on the highest bid price. White sites are evaluated on a combination of price and concept quality, with URA assessing the urban design, public realm, sustainability, and programming. The JLD White site, Paya Lebar Central, and Marina South are examples of major White site developments in Singapore’s recent history. White sites typically result in more architecturally and programmatically complex developments that become landmark projects in their district.
Does high GLS supply mean property prices will fall?
Not necessarily, and not immediately. The GLS-to-prices relationship operates with a 12–24 month lag and is moderated by demand conditions, interest rates, and the composition of sites. High GLS supply increases the pipeline of future new launches, which gives buyers more options and reduces urgency — typically moderating the pace of price increases rather than causing outright falls. Singapore experienced a genuine price correction (12% over 2013–2017) only when a record GLS pipeline coincided with significant cooling measures, rising interest rates, and softening foreign demand simultaneously. In 2026, cooling measures remain in place (ABSD, SSD, TDSR) but demand is supported by historically low mortgage rates (3M SORA near 1%) and resilient employment. The base case from industry research is price growth of 2–4% for 2026 despite the record supply programme — a soft landing rather than a reversal.
Where can I track GLS tenders and results?
The URA publishes the current GLS programme, all active tenders, and awarded tender results on its official website at ura.gov.sg/Corporate/Land-Sales/Sites-For-Tender. The SLA also publishes related information at sla.gov.sg. For EC sites and HDB land sales, the HDB website at hdb.gov.sg publishes the relevant information. URA press releases accompanying new tender launches and awards are the primary source for official quantum, GFA, and evaluation outcomes. Industry portals compile GLS data in more digestible formats, but always cross-reference against the primary URA/SLA source for accuracy.
How does GLS land cost affect HDB resale prices?
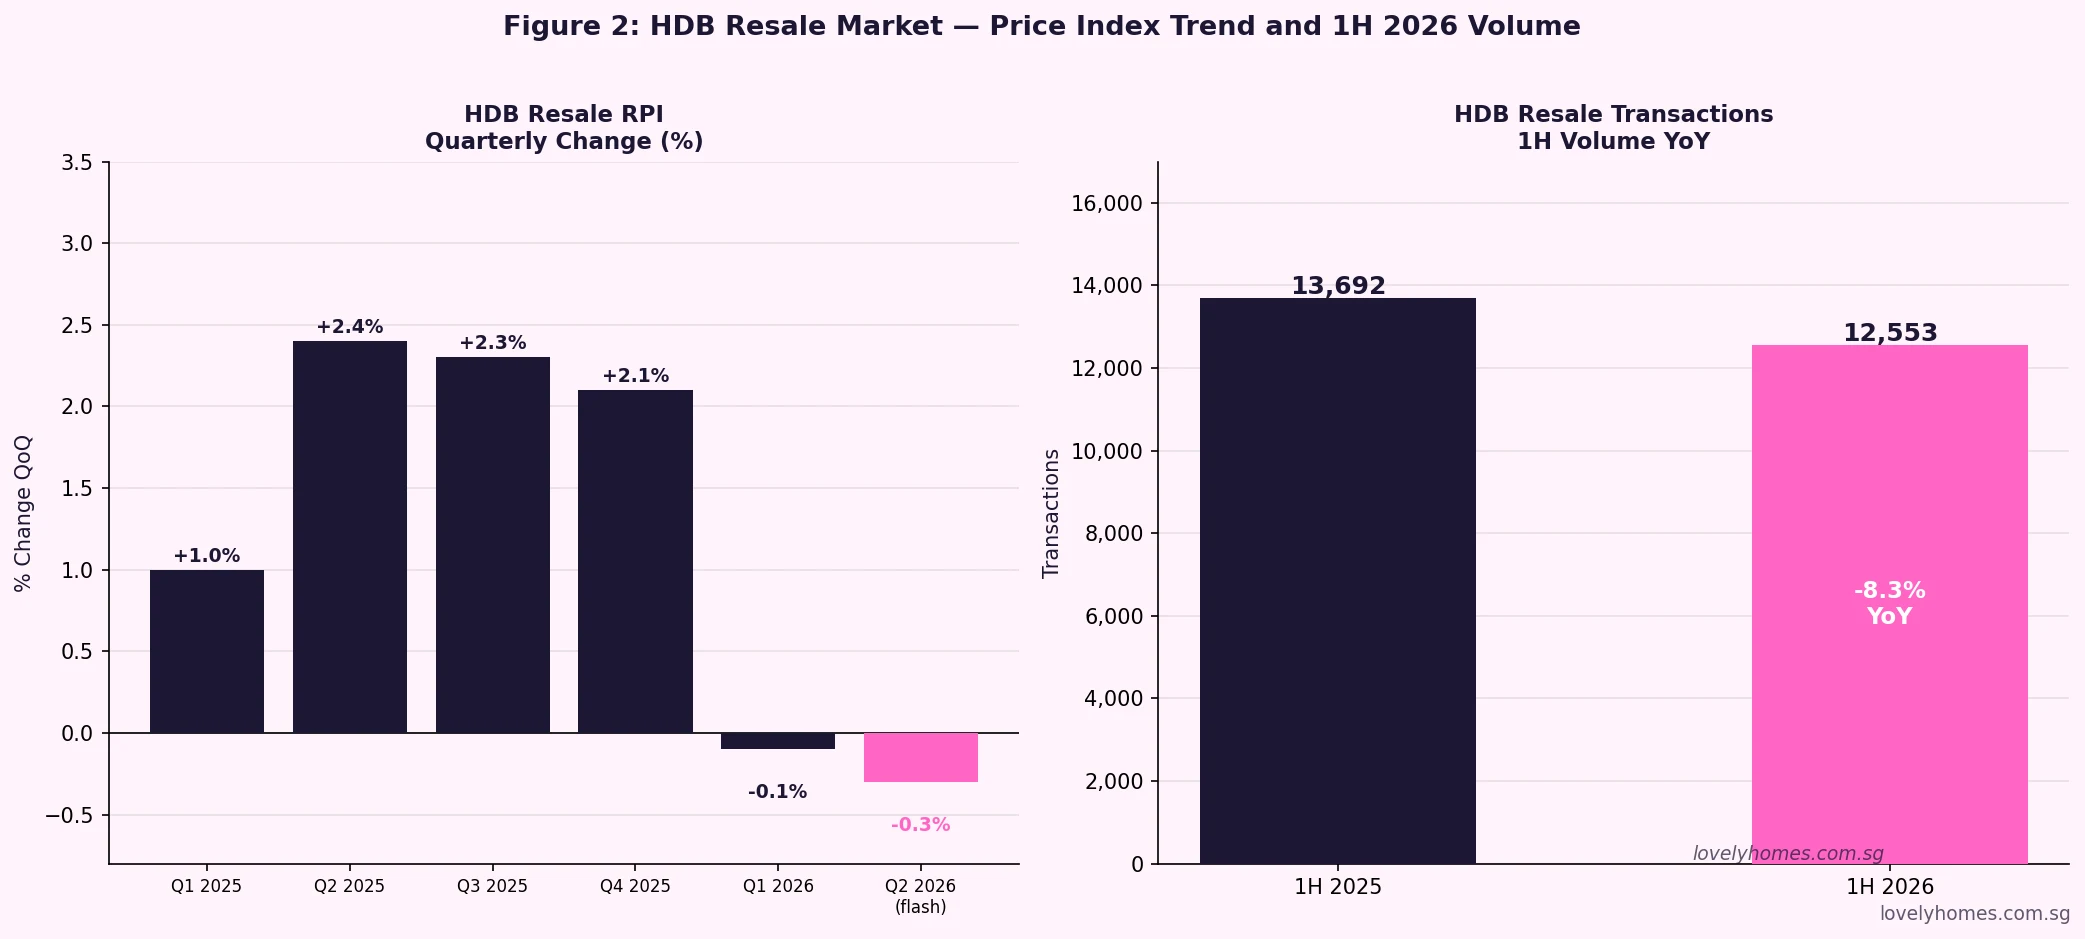
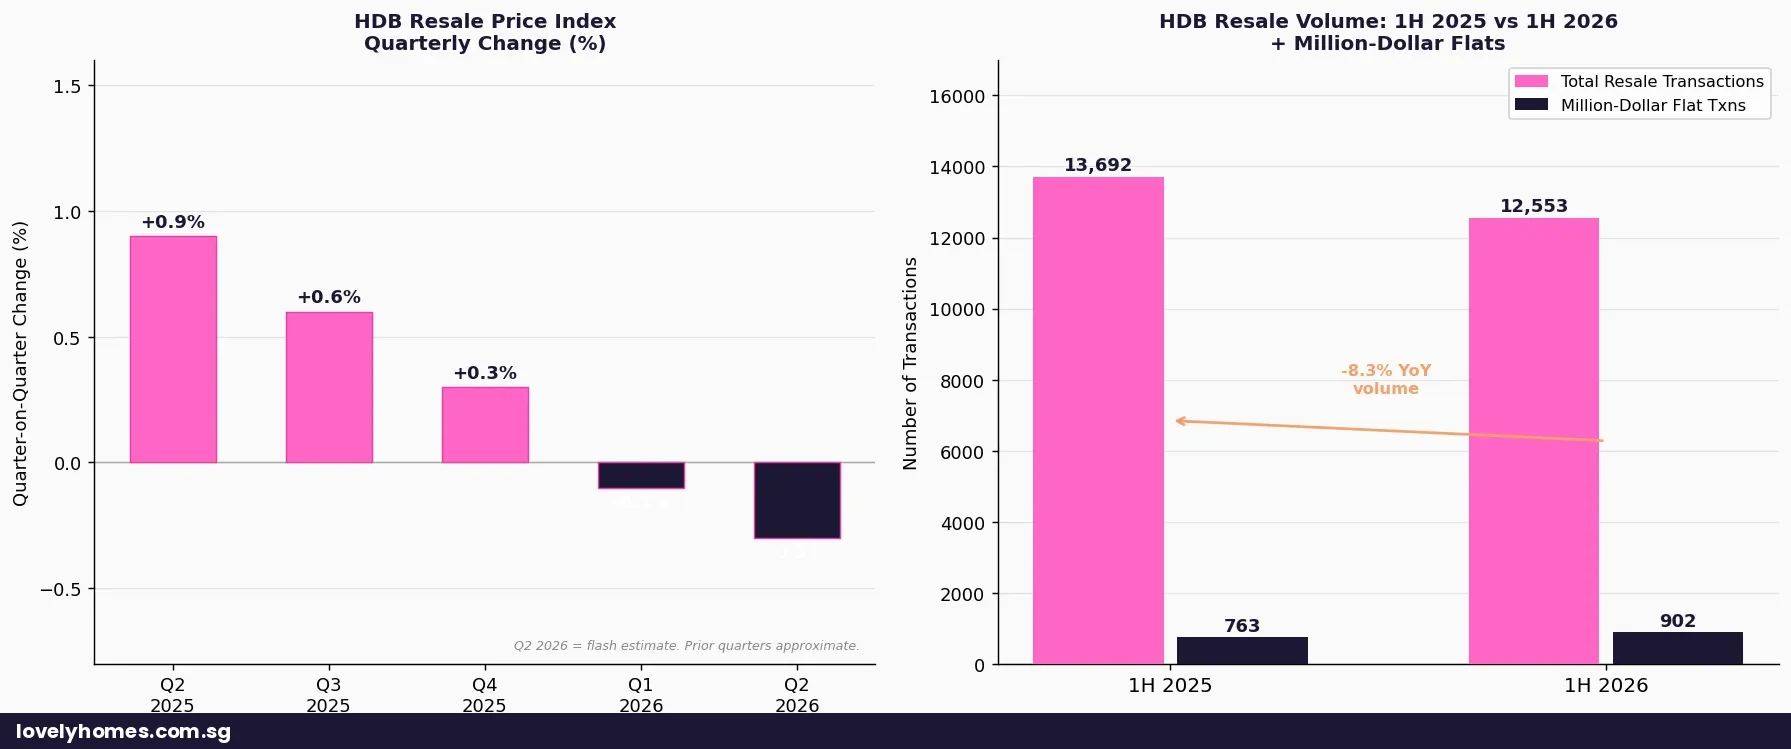
The relationship is indirect but real. GLS-derived new launch prices set a psychological reference point: when buyers compare an HDB resale flat in the same area against a new private condo launched at S$2,200 psf, the HDB flat at S$700–S$900 psf appears relatively affordable — supporting demand and prices. Conversely, if GLS supply moderates new launch prices, the urgency premium embedded in HDB resale prices may also ease. The more direct driver of HDB resale prices is HDB’s own build programme (BTO supply) and the Minimum Occupation Period pipeline: the 2026 surge of over 13,000 resale flats entering the market (5-year MOP completions from the 2021 BTO launches) is a stronger supply signal for the HDB resale market than GLS data. For a detailed discussion of the HDB resale market outlook, see our Singapore Property Market Outlook 2H 2026.
Related Articles
- ABSD Singapore 2026: Complete Guide to Additional Buyer’s Stamp Duty
- Singapore Property Market Outlook 2H 2026: CCR Rally, OCR Softening and the GLS Supply Wave
- Singapore Private Property Prices Q2 2026: URA Flash Estimate +0.5%
- Singapore EC Guide 2026: Executive Condominium Eligibility, ABSD and MOP
- Singapore Commercial Property Guide 2026: Shophouses, Office and the No-ABSD Advantage
- Singapore Property Cooling Measures Timeline 2009–2026
Disclaimer
This article is intended for general informational purposes only and does not constitute investment, financial, or legal advice. GLS programme details, unit yield estimates, and site information are based on publicly available URA and SLA announcements and may change. All supply figures, land cost estimates, and pricing illustrations are indicative. Readers should verify current GLS programme details with the Urban Redevelopment Authority at ura.gov.sg and the Singapore Land Authority at sla.gov.sg before making property decisions. Consult a licensed property professional or financial adviser for personalised guidance.
Click anywhere or press Esc to close