⚡ Quick Answer — River Valley Green Parcel C Award
The URA has awarded the River Valley Green (Parcel C) GLS tender to SMCL Haven 3 Pte. Ltd. and CSC Land Group (Singapore) Pte. Ltd. (URA pr26-48, 23 June 2026).
The winning bid was S$750,569,199 — equivalent to S$18,621.77 per square metre of GFA.
The site occupies 11,516 m² of land with a maximum permissible GFA of 40,306 m², on a 99-year leasehold tenure.
The land rate of S$18,622 psm GFA translates to approximately S$1,730 per square foot of GFA — a benchmark that will inform CCR launch pricing from this developer.
Estimated breakeven for the developer (land + construction + carrying costs) points to launch prices in the range of S$3,200–S$3,800 psf, depending on unit mix and construction timeline.
The River Valley Green precinct (D09 CCR) continues to attract firm developer conviction despite the elevated ABSD environment for foreign buyers.
URA Awards River Valley Green Parcel C for S$750.6 Million
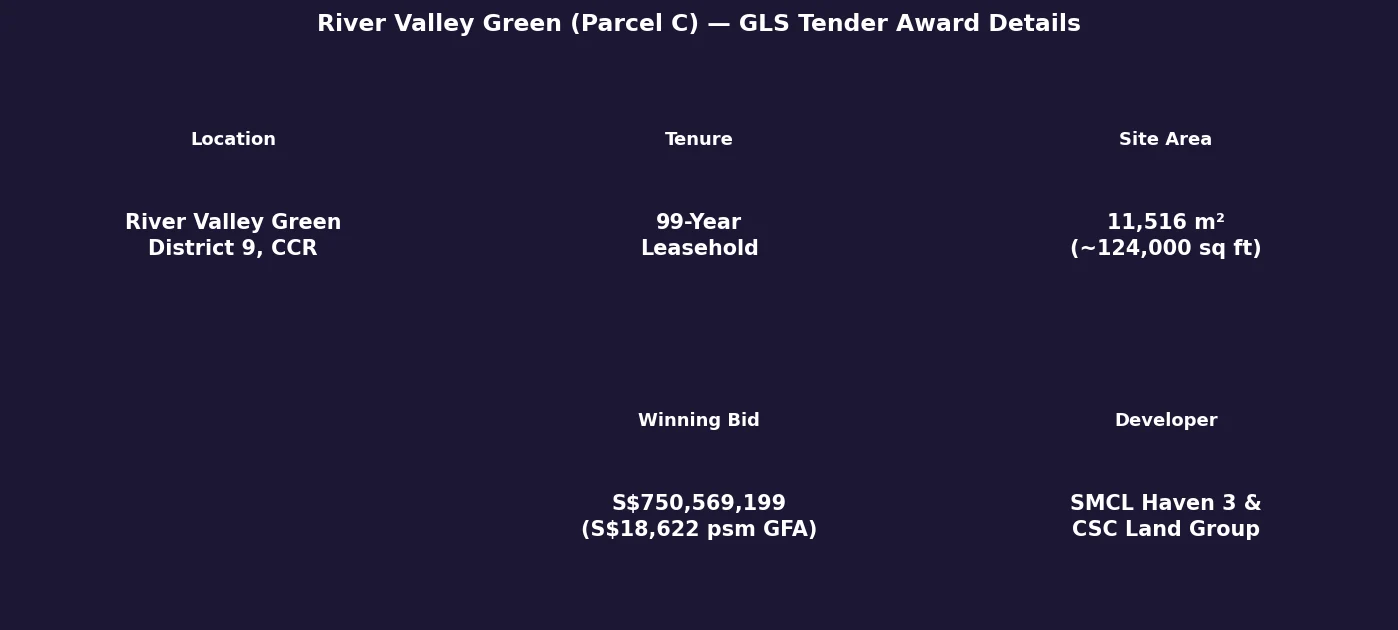
The Urban Redevelopment Authority (URA) confirmed on 23 June 2026 that the Government Land Sales (GLS) tender for River Valley Green (Parcel C) has been awarded to SMCL Haven 3 Pte. Ltd. and CSC Land Group (Singapore) Pte. Ltd. — a joint-venture consortium — at a bid price of S$750,569,199, or S$18,621.77 per square metre of permissible gross floor area (GFA).
The site was launched for tender on 9 April 2026 as part of URA’s first-half 2026 Government Land Sales programme and closed for bids on 18 June 2026. The 99-year leasehold residential parcel is the third of three River Valley Green sites to be tendered by URA, completing the planned residential component of the River Valley Green development corridor adjacent to Alexandra Canal.
Site Specifications and Award Details
Figure 1: River Valley Green (Parcel C) — GLS tender award details. Source: URA pr26-48, 23 June 2026.
What the Land Rate Signals About the CCR Market
The S$18,621.77 psm GFA land rate is a significant data point for the Core Central Region (CCR) residential market. To contextualise: this rate implies a total land cost of approximately S$1,730 per square foot on GFA — before construction, financing, professional fees, and developer profit are factored in.
Industry estimates suggest a typical CCR high-end residential project carries total development costs (land + construction + fees + financing) of S$3,000–S$3,500 psf on GFA before profit. Applying a 15–20% developer margin, the anticipated launch price range for the future project is approximately S$3,200–S$3,800 psf. This range is consistent with the broader CCR pricing environment in 2026 (median S$2,500–S$3,800 psf depending on project age and location) and suggests developers continue to price in buyer demand from Singapore-based ultra-high-net-worth individuals and PRs, notwithstanding the 60% ABSD deterrent for foreign buyers.
The award contrasts with the broader narrative of cooling CCR volumes: while the number of new sale transactions in D09 has declined since the 2023 ABSD hike, absolute pricing has held firm. The S$750.6M bid is a vote of confidence that there is an addressable buyer base — primarily Singapore Citizens and PRs — willing to transact at S$3,200+ psf in the River Valley sub-district.
Context: The River Valley Green GLS Programme
River Valley Green (Parcel C) is the final piece in a three-parcel residential GLS programme that URA has been releasing along the River Valley Green corridor. Earlier parcels in the same corridor attracted competitive bids, establishing a price trajectory for the sub-district. The proximity to the Great World MRT station (Thomson–East Coast Line), opened in 2022, has been a consistent factor cited by market participants in supporting GLS valuations along the Alexandra Canal fringe.
CSC Land Group is a Singapore-based developer with a portfolio spanning residential and mixed-use developments across the island. SMCL Haven 3 Pte. Ltd. is the project-specific SPV established for this joint venture. The choice of a joint-venture structure for a S$750M+ land parcel is consistent with Singapore market practice for managing capital concentration risk on large CCR sites.
Summary: River Valley Green Parcel C at a Glance
Detail
Data
URA Press Release
pr26-48, 23 June 2026
Site Location
River Valley Green (Parcel C), District 9
Tenure
99-Year Leasehold
Land Area
11,516 m² (~124,000 sq ft)
Max Permissible GFA
40,306 m² (~434,000 sq ft)
Winning Bidder
SMCL Haven 3 Pte. Ltd. & CSC Land Group (Singapore) Pte. Ltd.
Winning Bid (total)
S$750,569,199
Bid Per PSM of GFA
S$18,621.77
Bid Per PSF of GFA (approx.)
S$1,730
Estimated Launch PSF (industry est.)
S$3,200–S$3,800 psf (subject to project planning)
Frequently Asked Questions
What is a GLS tender and how does URA award it?
A Government Land Sales (GLS) tender is Singapore’s primary mechanism for releasing state land to private developers for residential or mixed-use development. Sites are offered on a Confirmed List (mandatory release within a programme period) or a Reserve List (released only when a developer triggers the tender by committing to a minimum bid). Bidders submit sealed tenders by a closing date; URA evaluates bids and awards to the highest qualifying tenderer, subject to a technical reserve price. The award is binding — developers must pay the full bid price and complete development within the stipulated period. The GLS programme is coordinated jointly by URA and the Singapore Land Authority (SLA).
What does this award mean for current River Valley property owners?
For owners of existing freehold and leasehold properties in the River Valley and Orchard fringe (D09), the S$18,622 psm GFA land rate provides a valuation signal. Developers will need to launch the future project at S$3,200–S$3,800+ psf to cover costs — which anchors new-launch comparable pricing in the precinct. Existing resale units in the River Valley sub-district typically trade at a 10–20% discount to new launches of equivalent specification, suggesting a price floor around S$2,800–S$3,400 psf for resale transactions near this site. However, each property is valued on its own merits, and owners should commission a formal valuation from a licensed appraiser before drawing conclusions about their specific unit.
When can buyers expect a new project launch from this site?
Based on typical Singapore residential development timelines — site planning approval (6–12 months), construction (3–4 years for a high-rise residential project) — a project launch from the River Valley Green Parcel C site could be expected in 2027–2028, with TOP (Temporary Occupation Permit) around 2030–2032. This is an estimate based on industry norms and is subject to the developer’s planning decisions, the Economic Development Board’s (EDB) permit process, and building construction pace. The developer has not yet made public announcements about the project name, unit mix, or launch timeline.
Is the 60% ABSD deterring foreign buyers from CCR new launches?
The 60% Additional Buyer’s Stamp Duty (ABSD) for foreign individuals, introduced in April 2023 (raised from 30%), has significantly reduced the proportion of foreign buyers in the CCR new launch market. URA data for 2023–2025 shows foreign purchases as a share of private residential transactions fell from roughly 7–8% (pre-2023) to under 3% post-ABSD hike. In dollar value terms, the deterrent is stark: a foreigner buying a S$4M CCR unit pays S$2.4M in ABSD alone. However, developers targeting the S$3,200–S$3,800 psf range for River Valley Green Parcel C are primarily underwriting to Singapore Citizen and PR demand — the ABSD regime makes foreign buyer demand a bonus rather than a base case for CCR projects launched post-2023.
How does this site compare to the Peck Hay Road GLS award?
The Peck Hay Road site (URA pr26-45, 16 June 2026) was awarded at a different psm GFA rate reflecting its distinct location, plot ratio, and site characteristics. Both sites are in the CCR (D09) and on 99-year leasehold tenure, but their proximity to MRT stations, site geometry, and view potential differ. River Valley Green Parcel C’s proximity to Great World MRT (TEL) is a key differentiator from the Peck Hay Road site, which is closer to the Orchard sub-precinct. Comparing land rates across sites of different specifications is useful for market context but should not be treated as a direct apples-to-apples benchmark.
All figures in this article are sourced directly from URA press release pr26-48 (23 June 2026). Developer cost estimates, launch price projections, and valuation commentary are based on industry consensus estimates as at July 2026 and are speculative — they do not constitute a valuation or investment advice. Actual launch prices, project timelines, and market outcomes will depend on factors including developer decisions, construction costs, interest rates, and government policy. Readers should consult a licensed appraiser and property professional for advice specific to their circumstances. Official GLS data: ura.gov.sg/land-sales.
Quick Answer: Singapore Property Market Outlook 2H 2026
Q2 2026 private prices: Overall +0.5% QoQ (flash estimate). CCR (Core Central Region) surged +2.0%; Landed properties rose +2.6%. RCR (Rest of Central Region) fell -1.4%; OCR (Outside Central Region) softened -0.2%.
HDB resale: The Resale Price Index (RPI) slipped to 202.7 in Q2 2026, down -0.3% — the second consecutive quarterly decline since 2018. Resale volumes for 1H 2026 fell 8.3% year-on-year to 12,553 transactions.
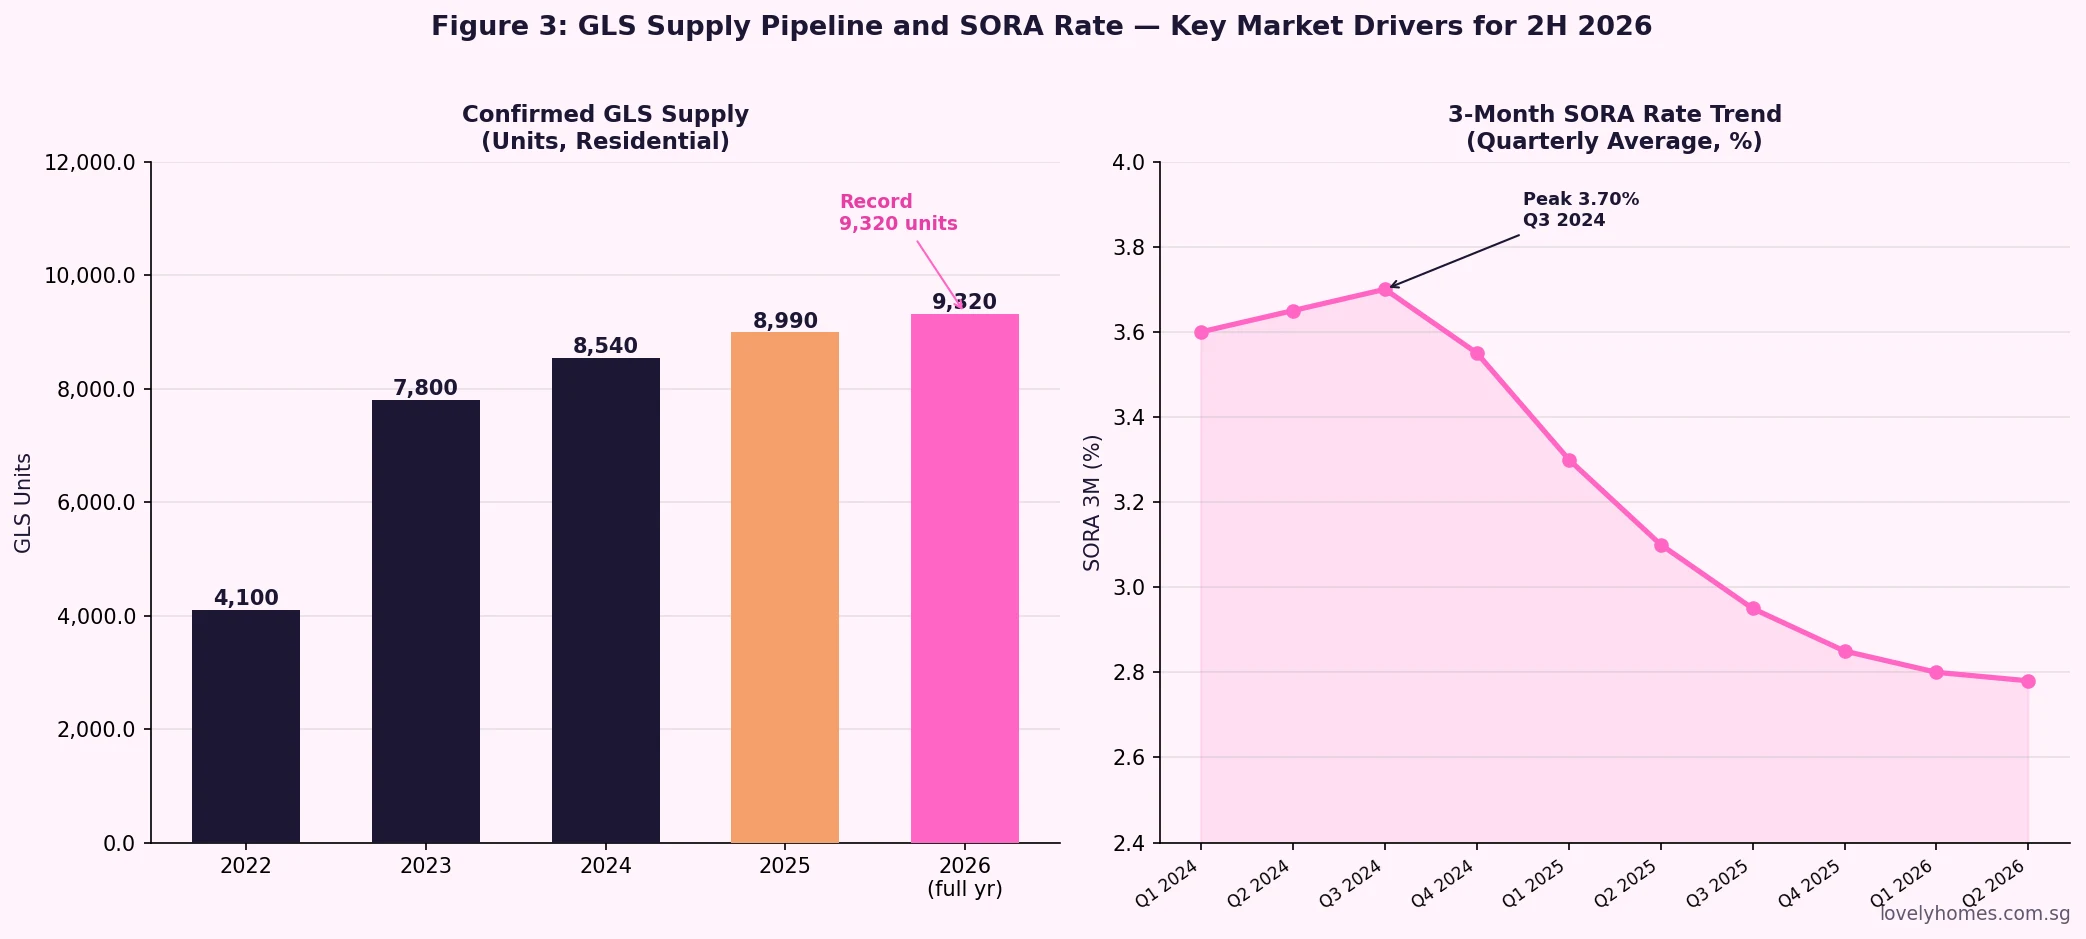
Supply headwind: Record Government Land Sales (GLS) of approximately 9,320 Confirmed List units in 2026 will put sustained pressure on OCR mass-market prices once completions accelerate from 2027.
SORA easing: The 3-month compounded SORA has fallen from a Q3 2024 peak of approximately 3.70% to around 2.78% in Q2 2026, materially reducing monthly instalment burdens for new buyers.
Key watch items for 2H 2026: URA full Q2 data (~24 July), HDB full Q2 resale data (~23 July), the Lorong Puntong and Kitchener GLS tender results, and the first major new launches of the second half.
LovelyHomes outlook: A market of two halves — CCR and landed supported by safe-haven demand and limited supply; OCR and HDB resale facing a gradual correction as GLS completions build. Selective buying, not blanket avoidance.
Where Singapore Property Prices Stand at Mid-2026
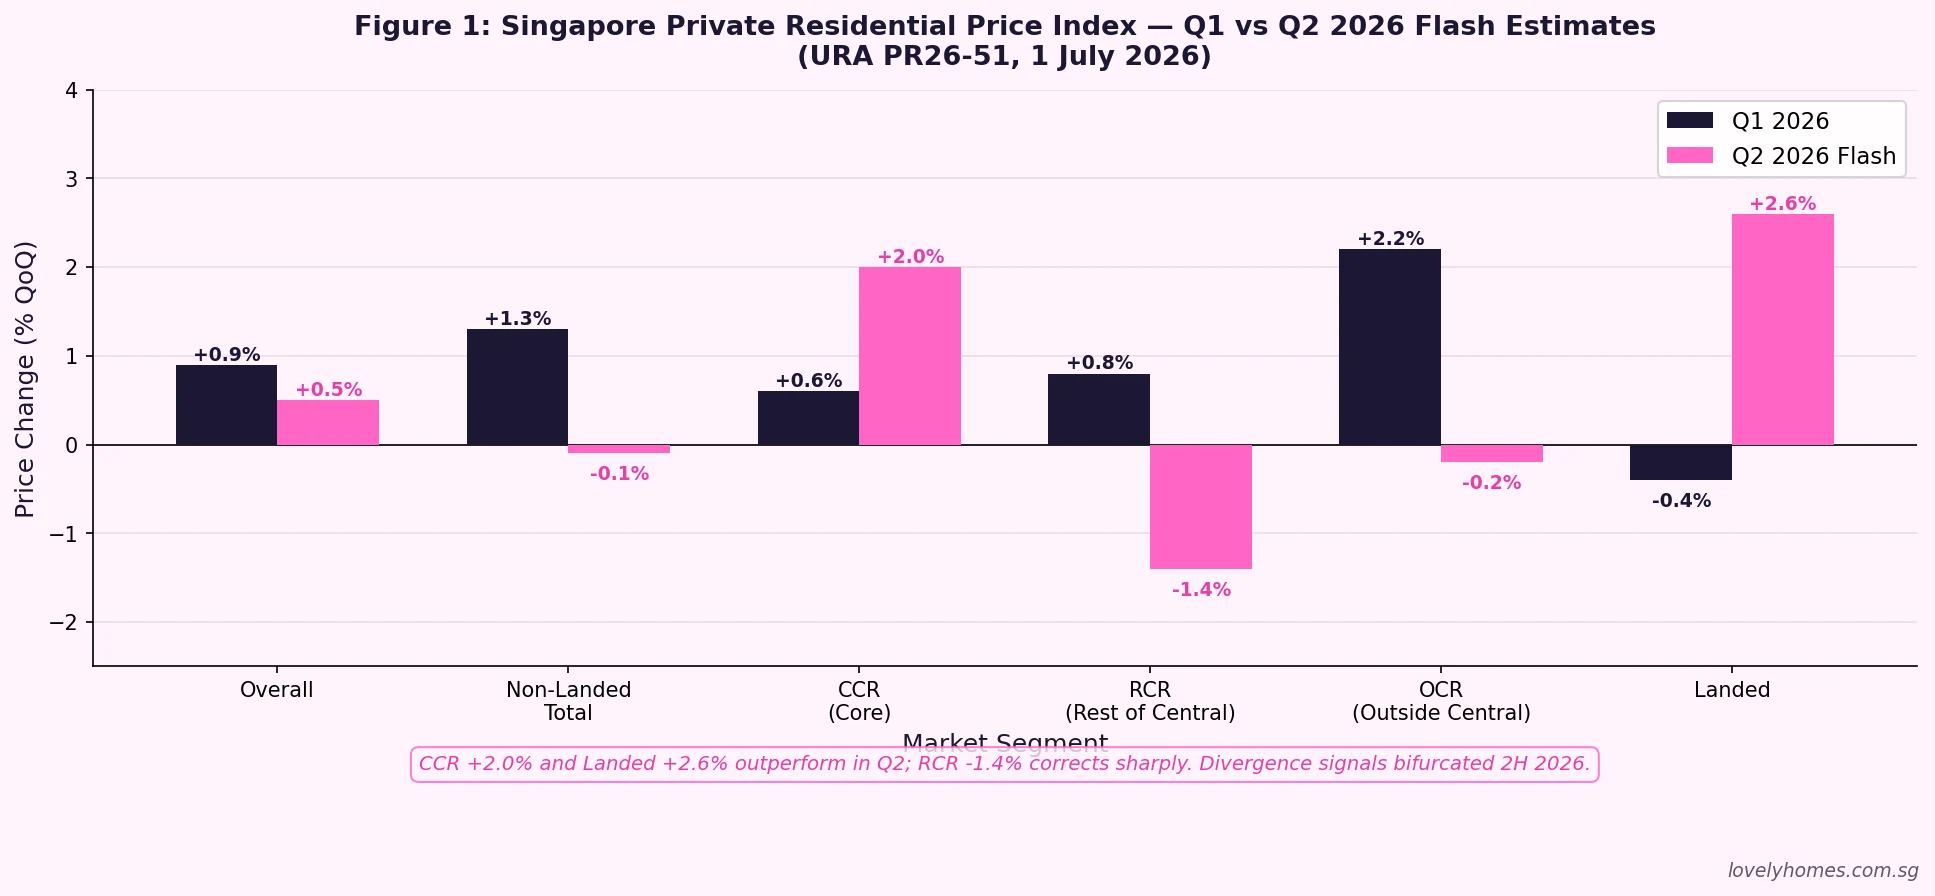
The URA released its Q2 2026 flash estimate on 1 July 2026 (PR26-51), confirming that the overall Private Residential Property Price Index (PPI) rose 0.5% quarter-on-quarter — a deceleration from the 0.9% gain recorded in Q1 2026. Beneath that headline number lies a market fracturing along segment lines: luxury and landed assets are accelerating while mass-market and city-fringe properties are softening.
This bifurcation is not accidental. It reflects the interplay of three structural forces: a record Government Land Sales pipeline adding future supply predominantly in the Outside Central Region (OCR); persistent demand from regional wealth for Singapore's premier residential addresses in the Core Central Region (CCR); and the cooling effect of ABSD on speculative or multiple-property demand in all segments. Understanding which segment you are buying in — and why each segment is behaving the way it is — is the essential starting point for any property decision in 2H 2026.
Figure 1: URA Private Residential Property Price Index — Q1 2026 vs Q2 2026 Flash by Segment. Source: URA PR26-51, 1 July 2026. CCR outperforms; RCR corrects sharply.
The CCR Rally: Why Luxury Properties Are Leading
The Core Central Region — comprising the prime Districts 9, 10, and 11, the Marina Bay Financial District, and Sentosa Cove — posted a flash price gain of +2.0% in Q2 2026, the strongest regional performance in Singapore's residential market. This follows +0.6% in Q1 2026, suggesting that the CCR recovery that began in late 2025 is gathering momentum rather than fading.
The drivers are well understood. As one of Asia's most politically stable and legally transparent jurisdictions, Singapore functions as a safe haven for regional wealth. Family offices, of which Singapore had surpassed 2,000 registered by end-2025 according to the Monetary Authority of Singapore (MAS), constitute a consistent source of demand for Orchard Road residences, Nassim Hill bungalows, and Marina Bay service apartments. Unlike retail buyers who are sensitive to monthly instalment affordability, family-office purchasers are frequently cash buyers for whom SORA movements and LTV limits are largely irrelevant.
The supply picture reinforces this demand. Conservation Good Class Bungalows (GCBs) in Districts 10 and 11 are subject to a government-mandated minimum plot size of 1,400 sq m and strict conservation restrictions — the result is a permanently supply-constrained asset class. Similarly, the Orchard Road corridor's freehold apartment inventory does not meaningfully grow: new completions in the CCR represent a small fraction of total pipeline. When global risk appetite is strong and the Singapore dollar holds firm, these segments benefit disproportionately.
RCR Correction: City Fringe Faces Re-Pricing
The Rest of Central Region — covering Districts 1 to 4 (city centre fringe), Districts 7, 8, 12, 13, 14, 15, and 20 — recorded a -1.4% quarterly decline in the Q2 2026 flash estimate, the sharpest segment correction this cycle. This follows a +0.8% gain in Q1 2026, marking an abrupt reversal.
The RCR has been the primary arena for new-launch condominium activity over the past three years. Developers of projects in Toa Payoh, Upper Serangoon, Queenstown, and the River Valley area set aggressive launch prices in 2023 and 2024 on the back of strong take-up. By mid-2026, secondary market sellers in these same estates are discovering that buyers who absorbed aggressive launch prices are now reluctant to transact at further premiums in the resale market — particularly given the mounting GLS supply pipeline and the moderating economic backdrop.
The -1.4% flash reading likely overstates the correction to some degree (flash estimates are based on caveated transactions within a shortened window), but the directional signal is consistent with anecdotal reports from the industry of reduced viewing traffic and longer days-on-market for RCR resale listings in Q2 2026.
OCR Softening: Mass Market Feels Supply Pressure
The Outside Central Region — covering the large residential estates of Woodlands, Jurong West, Pasir Ris, Tampines, Sengkang, Punggol, and Tengah — declined -0.2% in Q2 2026 after posting the strongest Q1 2026 gain of any segment at +2.2%. This sharp reversal from the previous quarter underscores how quickly sentiment can shift in the mass-market segment when buyers perceive that alternative options — HDB resale, new BTO launches, and a growing pipeline of GLS completions — are available at lower effective cost.
The GLS supply factor warrants particular attention. URA released its H2 2026 Confirmed List on 25 June 2026 (PR26-49), adding sites at Lorong Puntong/Sin Ming Avenue (approximately 570 units) and Kitchener Link (approximately 530 units). When combined with the H1 2026 Confirmed List and sites already in the pipeline, total 2026 Confirmed List supply for private residential amounts to approximately 9,320 units — the highest annual volume since 2013, when the government was actively cooling a market running at fever pitch. These units will begin reaching the completion and occupation stages from approximately 2028–2029, adding significant inventory at a time when overall market demand is not expected to grow at the pace it did during the 2021–2022 pandemic-rebound period.
HDB Resale: Second Consecutive Quarterly Decline
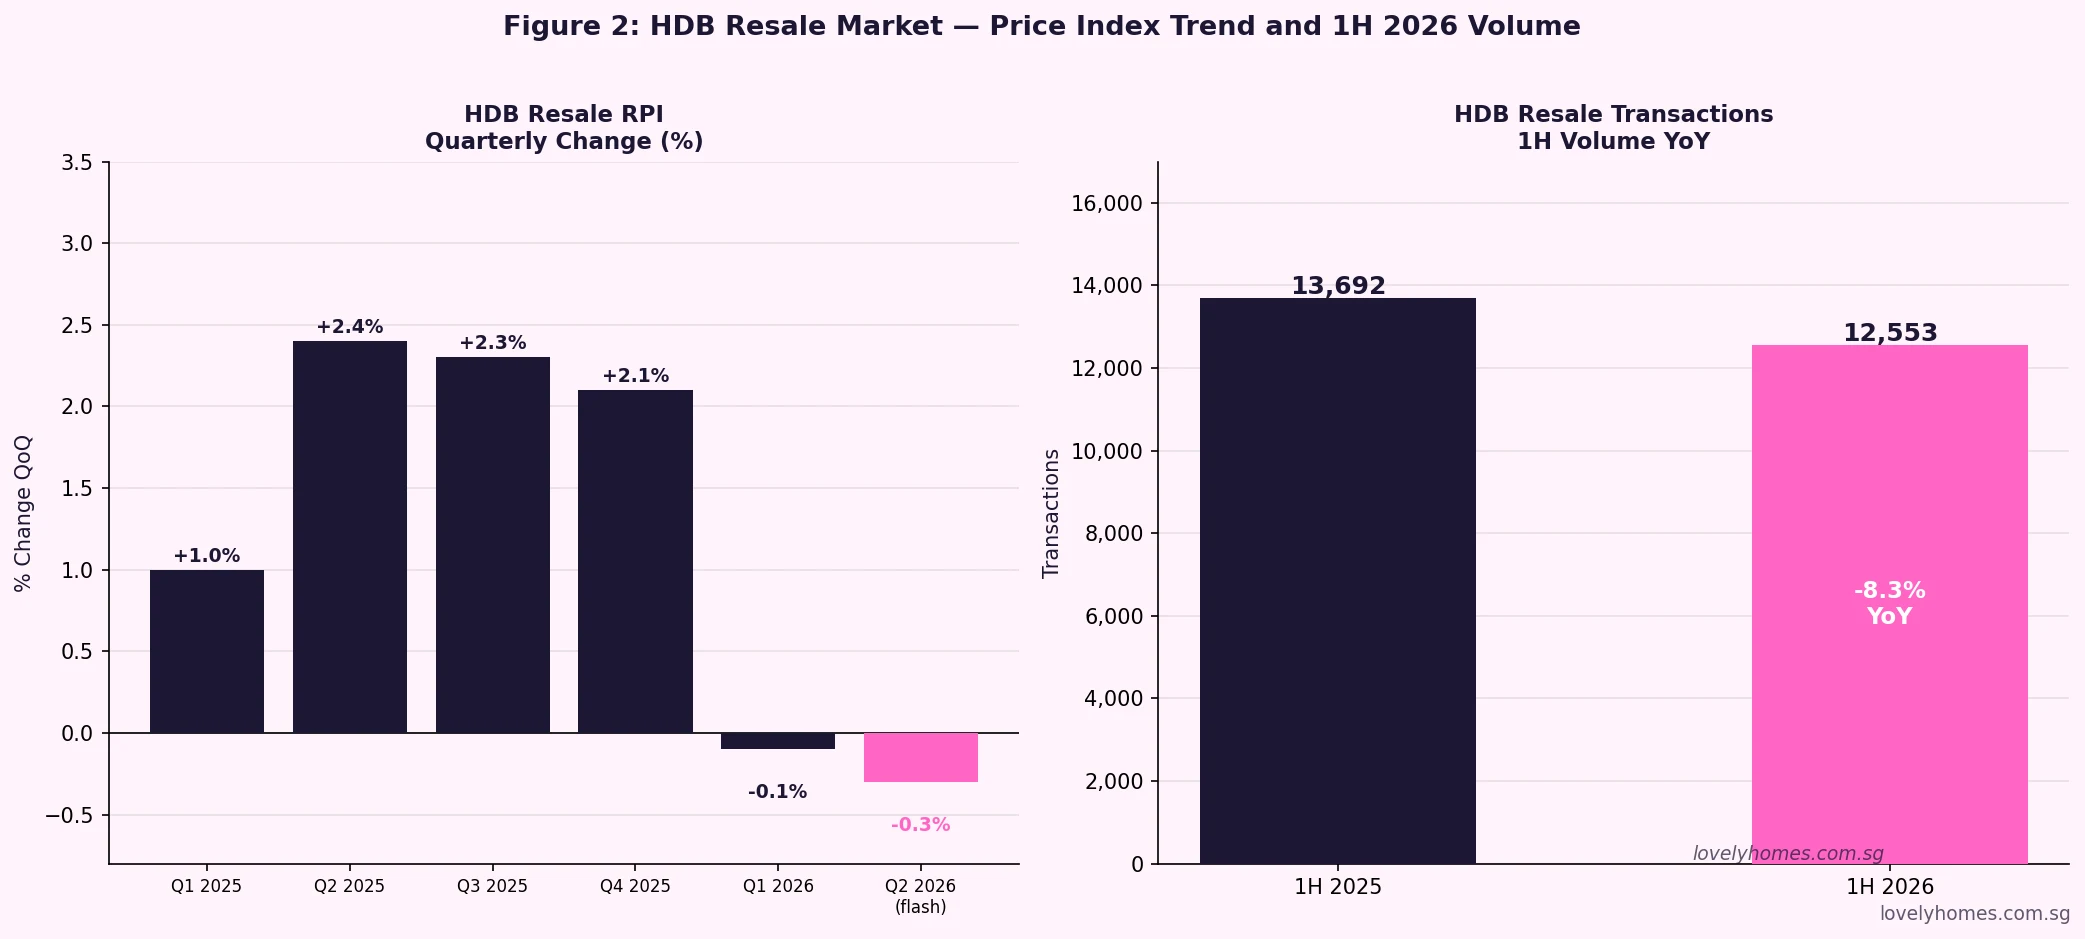
The HDB resale market delivered its second consecutive quarterly price decline in Q2 2026, with the Resale Price Index (RPI) falling 0.3% QoQ to 202.7 — the first back-to-back decline since the 2018–2019 cooling measure correction. For the first half of 2026, total HDB resale transactions reached 12,553, down 8.3% from 13,692 in 1H 2025.
The paradox of the HDB resale market in 2026 is that headline RPI softening coincides with a continued surge in million-dollar flat transactions: 902 such transactions occurred in 1H 2026, up 18.2% from 763 in 1H 2025. This apparent contradiction reflects compositional effects — the supply of large (5-Room, Executive) flats in prime locations continues to command premium prices, pulling up the million-dollar count, while the bulk of the market in heartland estates is moderating as fresh BTO supply absorbs first-timer demand that would otherwise have entered the resale market.
Figure 2: HDB Resale Price Index quarterly change (Q1 2025 to Q2 2026 flash) and 1H transaction volumes. Source: HDB flash estimates, 1 July 2026. Two consecutive quarterly declines; volumes down 8.3% year-on-year.
Financing Conditions: SORA at Post-Peak Ease
The 3-month Compounded Singapore Overnight Rate Average (SORA) — the benchmark that replaced SIBOR for most bank mortgage packages from 2022 — peaked at approximately 3.70% in Q3 2024. By Q2 2026, the 3-month SORA had eased to approximately 2.78%, reducing the monthly instalment on a S$1 million, 25-year loan by approximately S$500 relative to the peak rate environment.
This easing is meaningful at the margin. A household that found a S$1.5 million HDB resale or OCR condo marginal in 2024 on affordability grounds may find the same unit comfortably within TDSR limits at 2026 SORA rates — and this dynamic is one factor supporting transaction volumes despite softer prices. However, lenders continue to apply a stress-test buffer when assessing borrower eligibility, and MAS has indicated no intention to relax the TDSR of 55% or the MSR of 30% for HDB purchases.
GLS Pipeline and New Launches: What to Expect
The H2 2026 GLS programme confirms Singapore's commitment to supply-side management as the primary tool for long-run price stability. Beyond the record Confirmed List volume, two sites in the pipeline carry outsized significance for 2H 2026 market narrative:
The Lorong Puntong/Sin Ming Avenue GLS tender, launched on 25 June 2026 (PR26-49), closes on 15 September 2026. The site sits adjacent to Bishan-Ang Mo Kio Park and proximate to the Upper Thomson MRT corridor — a location that supports premium pricing relative to typical OCR land. The tender result will signal developer appetite for GLS land at current price levels, and any unusually low bid would be read as a bearish signal for near-term launch pricing.
The Jurong Lake District White Site, launched under the June 2026 programme (PR26-53), closes on 17 November 2026. This is a transformational commercial and mixed-use site that will anchor the second CBD vision for western Singapore. The developer who wins this tender will shape the Jurong East skyline for decades — and the land bid quantum will be a leading indicator of long-term commercial investment confidence in Singapore.
Figure 3: Annual GLS Confirmed List supply (residential units) and 3-month compounded SORA rate trend. Sources: URA GLS programmes 2022–2026; MAS SORA data. Record 9,320 GLS units in 2026; SORA easing from Q3 2024 peak.
Summary: Market Snapshot at July 2026
Indicator
Latest Reading
Trend
Private Overall PPI (Q2 2026 flash)
+0.5% QoQ
Slowing
CCR prices (Q2 2026 flash)
+2.0% QoQ
Accelerating
RCR prices (Q2 2026 flash)
-1.4% QoQ
Correction
OCR prices (Q2 2026 flash)
-0.2% QoQ
Softening
Landed prices (Q2 2026 flash)
+2.6% QoQ
Accelerating
HDB Resale RPI (Q2 2026 flash)
202.7 (-0.3% QoQ)
2nd consecutive decline
HDB Resale volume 1H 2026
12,553 transactions
-8.3% YoY
GLS Confirmed List 2026
~9,320 units
Record high
SORA 3M (Q2 2026)
~2.78%
Easing from 3.70% peak
URA full Q2 data
Expected ~24 July 2026
Monitor
HDB full Q2 resale data
Expected ~23 July 2026
Monitor
Worked Example: How SORA Easing Changes the Affordability Calculation
Mr and Mrs Goh are Singapore Citizens considering a 5-Room HDB resale flat in Bishan at S$850,000. They have no existing property loans. Their combined gross monthly income is S$14,000.
At Q3 2024 peak SORA (~3.70% bank package rate ~4.20%):
Loan amount (HDB not eligible; income exceeds S$9,000 cap): bank loan 75% LTV = S$637,500
Monthly instalment at 4.20% over 25 years: ~S$3,450
MSR: S$3,450 / S$14,000 = 24.6% — borderline
TDSR headroom: 55% x S$14,000 = S$7,700; used S$3,450 — comfortable
At Q2 2026 SORA (~2.78% bank package rate ~3.30%):
Same loan S$637,500 at 3.30% over 25 years: ~S$3,110
MSR: S$3,110 / S$14,000 = 22.2% — comfortably within 30%
Monthly saving versus 2024 peak: ~S$340
Total interest saving over 25-year loan: approximately S$102,000
Conclusion: SORA easing has added roughly S$340 per month of headroom for the Goh family — equivalent to bringing approximately 12% more buyers into affordability range for this price bracket. This is a meaningful structural support for HDB resale and OCR condominium demand, partially offsetting the headwind from increased GLS supply.
Why This Matters: Singapore in the Regional Property Context
Singapore's property market is often benchmarked against Hong Kong as the other major established gateway city in Asia. In 2026, the comparison is instructive: Hong Kong's residential market has been in a multi-year correction following the 2019 civil unrest and subsequent COVID-era lockdowns, with prices falling more than 20% from the 2021 peak. Singapore, by contrast, is experiencing a controlled deceleration rather than a correction — the price level in nominal terms remains substantially above any pre-pandemic reference point.
This relative resilience reflects the effectiveness of Singapore's demand-side management toolkit (ABSD, TDSR, MSR) in preventing speculative excess, and the credibility of the government's commitment to using supply (GLS) as a long-run moderator. International investors who choose Singapore over Hong Kong, Tokyo, or Sydney are selecting stability of institutional framework over raw yield or growth potential — and 2H 2026 data continues to validate that preference.
What Might Come Next in 2H 2026
The most significant scheduled data release is the URA full Q2 2026 private residential statistics, expected around 24 July 2026. The full release will confirm the flash estimate, provide transaction volume breakdowns, vacancy rates, and the rental index — the latter being a key lead indicator of future price direction. LovelyHomes will publish a dedicated analysis immediately upon release.
The HDB full Q2 2026 resale statistics, expected around 23 July 2026, will confirm the RPI reading and provide the complete breakdown of transactions by flat type, estate, and price band — including an updated million-dollar flat count that will receive significant media attention regardless of the direction.
On the policy front, no ABSD adjustment is widely anticipated for 2H 2026 given that price levels are moderating rather than surging. Any upward ABSD adjustment would likely be reserved for a scenario where CCR prices re-accelerate materially — a possibility if US Fed rate cuts in H2 2026 trigger renewed capital flows into Asian safe-haven assets. Conversely, any downward ABSD adjustment (e.g., relaxation of the 65% foreigner rate) would be a major bullish signal for the CCR and would likely be announced in the annual Budget Statement (February 2027) if at all.
Frequently Asked Questions
Is the Singapore property market in a bubble in 2026?
The empirical evidence does not support a bubble characterisation. The price-to-income ratio for Singapore private residential property has risen materially since 2020, but the primary driver has been genuine household formation, immigration-driven demand, and supply shortfalls during the COVID construction hiatus — rather than speculative leverage. MAS stress tests continue to show that the mortgage book is resilient at a hypothetical 200-basis-point rate increase. The HDB resale market is now experiencing a controlled moderation, which is the textbook outcome of effective demand management rather than a bubble correction. That said, buyers at elevated entry prices in the RCR and OCR should model their returns conservatively given the supply pipeline.
Should I buy property in Singapore now or wait until 2027?
Timing the market is notoriously difficult and not the approach LovelyHomes advocates. For owner-occupiers, the primary question is whether the property meets your household needs at an affordable instalment given current income and rates — not whether prices will be 5% higher or lower in 12 months. For investors, the relevant question is whether the rental yield after financing costs, taxes, and maintenance is adequate for the risk undertaken — and whether the specific asset class you are targeting (CCR luxury, HDB resale, industrial) has supply fundamentals that support occupancy over your intended hold period. 2H 2026 presents genuinely attractive opportunities in the CCR for cash-rich buyers with safe-haven motivations, and in the industrial space for yield-focused investors. Blanket avoidance is as problematic as indiscriminate buying.
What is the full Q2 2026 URA data release date and what will it cover?
The URA typically releases full quarterly private residential data approximately 3 to 4 weeks after the flash estimate. With the Q2 2026 flash released on 1 July 2026, the full release is expected around 24 July 2026. The full publication will include the finalised Property Price Index for all segments, transaction volumes by project and unit type, vacancy rates, uncompleted unit statistics, new sales and subsales data, rental index by region and property type, and median unit prices by postal district. LovelyHomes will publish a dedicated analysis within 24 hours of the full data release.
How does the record GLS supply affect property prices?
The impact of the 2026 GLS supply on transaction prices is lagged by approximately 3 to 5 years — the time between land tender and project completion. Units from sites awarded in 2026 will typically reach the resale market between 2029 and 2031. In the near term (2H 2026), the GLS supply primarily creates a perception headwind for OCR prices: buyers and sellers both know that future supply is coming, which moderates the urgency of purchase and weakens sellers' ability to hold firm on asking prices. The effect is most pronounced in OCR estates near new GLS sites (e.g., Tengah, Plantation) and less significant in CCR or landed segments where GLS supply is structurally limited.
Will ABSD be reduced in 2026 or 2027?
As at July 2026, there is no publicly signalled intention from the Ministry of Finance or MAS to reduce ABSD rates in the near term. Singapore's Finance Minister has consistently reiterated that ABSD remains necessary to maintain housing affordability for Singaporeans and to prevent a destabilising price surge. For ABSD to be reduced materially, the government would typically need to observe sustained price declines (not just moderation), rising vacancy rates, or a structural change in underlying demand dynamics. None of those conditions is currently met. LovelyHomes will update this analysis immediately if any Budget 2027 ABSD announcement is made.
How do I interpret the CCR vs RCR vs OCR classification?
The URA divides Singapore's residential market into three regions based on planning area and District designations. The Core Central Region (CCR) covers the most prime addresses: Districts 9, 10, 11, the Downtown Core, Sentosa, and Marina Bay. The Rest of Central Region (RCR) covers Districts 1 to 4, 7, 8, 12 to 15, and 20 — essentially the city-fringe and inner-suburb estates. The Outside Central Region (OCR) covers all remaining Districts — the HDB-dominated heartland areas of Woodlands, Jurong, Tampines, Sengkang, Punggol, and Tengah. Property prices and rental yields differ substantially across these regions, and the supply pipeline dynamics discussed above apply differently to each. Buyers should be clear about which region they are investing in before comparing projects by price per square foot alone.
Disclaimer: This article is published for general informational purposes only and does not constitute investment, legal, or financial advice. Price index data is sourced from URA and HDB flash estimates as at 1 July 2026; full official data expected ~23–24 July 2026. SORA figures are approximate quarterly averages based on MAS published data. GLS unit counts are estimates based on URA press releases and are subject to final confirmation. Forward-looking statements and market outlook commentary represent the editorial views of LovelyHomes and should not be relied upon for investment decisions. Consult a licensed financial adviser, mortgage broker, or property professional before making any property purchase or sale decision.
Source: URA / HDB Press Release pr26-50, 30 June 2026 — “Preparatory works for ‘Long Island’ project to commence from end-2026”
Key Takeaways: Long Island Preparatory Works 2026
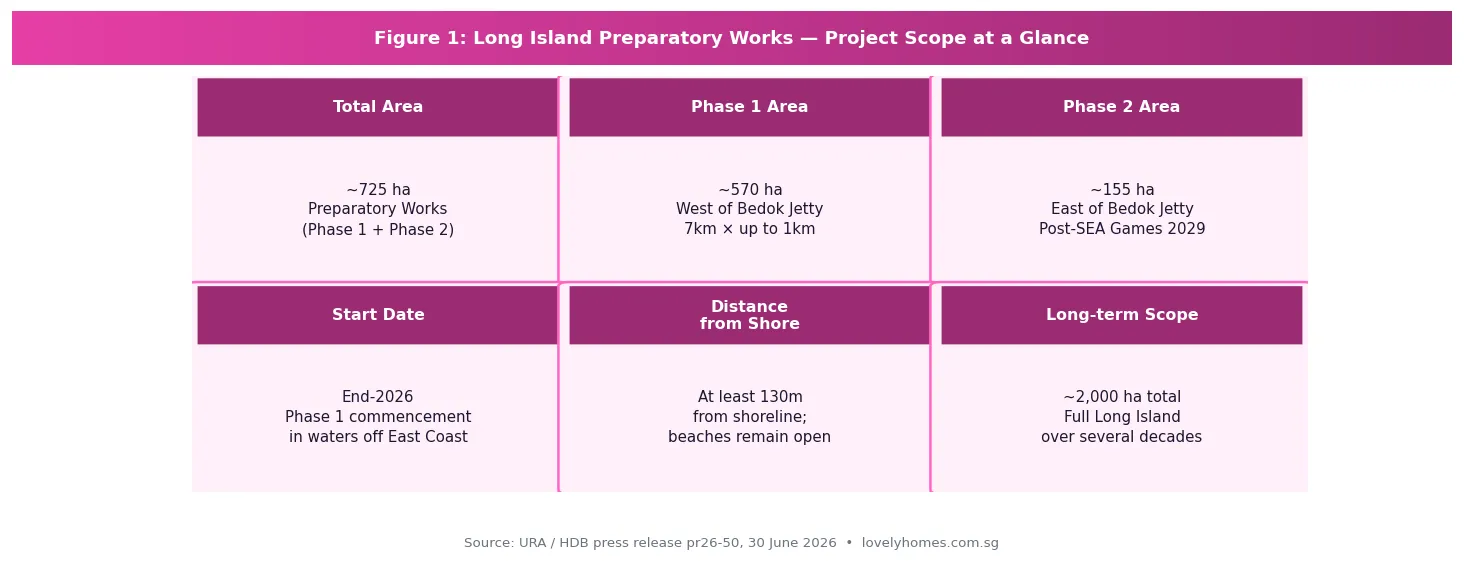
What: Preparatory marine works for Singapore’s large-scale ‘Long Island’ coastal protection and land reclamation project, to begin end-2026 off East Coast Park
Phase 1: ~570 ha, west of Bedok Jetty, starts end-2026; 7km long, up to 1km wide, at least 130m from shoreline
Phase 2: ~155 ha, east of Bedok Jetty — deferred until after the Southeast Asian (SEA) Games 2029
Public impact: Beaches at East Coast Park remain open throughout; near-shore swimming continues; sea sports (especially kiteboarding) will be temporarily displaced
Environmental study: Water quality expected to meet marine criteria; minor impacts on coral and seagrass beds; dust and sediment managed by silt screens and EMMP
Property implications: East Coast (D15) property holders should view Long Island as a long-term positive catalyst — ultimately creating new land, extended waterfront, and a future reservoir adjacent to Singapore’s most liveable eastern corridor
Full reclamation: The preparatory works area is NOT the final Long Island profile; detailed plans will be developed through further technical studies and public engagement over the coming years
Singapore took a significant step forward on its most ambitious coastal infrastructure project on 30 June 2026, when the Urban Redevelopment Authority (URA) and the Housing & Development Board (HDB) jointly announced that preparatory marine works for the ‘Long Island’ project will begin from end-2026. For property owners and buyers along the East Coast corridor — particularly in District 15 (D15), Bedok (D16), and the Tampines/Pasir Ris eastern stretch — the announcement marks the formal start of a multigenerational transformation that will ultimately reshape Singapore’s entire southern coastline.
LovelyHomes has previously covered the Greater Southern Waterfront (GSW) — the western bookend of Singapore’s coastal transformation — in our Tanjong Pagar Neighbourhood Guide and East Coast Neighbourhood Guide. Long Island is the eastern counterpart: a critical flood protection measure that will eventually create new land and a future reservoir east of Bedok, protecting the entire East Coast from rising sea levels over the coming century.
Figure 1: Long Island preparatory works — project scope, Phase 1 and Phase 2 parameters, and long-term scale. Source: URA / HDB press release pr26-50, 30 June 2026.
What Are the Preparatory Works, Exactly?
Long Island is Singapore’s planned response to climate change and rising sea levels along its vulnerable East Coast. The full project — which will ultimately involve major land reclamation to create a new island and a freshwater reservoir — is a decades-long undertaking. What begins at end-2026 is the preparatory phase: essential marine construction works that lay the groundwork for eventual reclamation, but do not yet constitute reclamation itself.
The preparatory works involve three primary activities: removal of seabed obstructions (historical debris, hazards); construction of temporary sand bunds (underwater containment structures); and sand infilling within the bunded areas. These works will take place entirely offshore, at least 130 metres from the shoreline, and will be clearly demarcated by silt screens and floating barriers visible from the beach.
The works are split into two phases:
Phase
Location
Area
Dimensions
Timing
Phase 1
Waters west of Bedok Jetty
~570 ha
~7km long × up to 1km wide
Commences end-2026
Phase 2
Waters east of Bedok Jetty
~155 ha
TBC
After SEA Games 2029 completion
Full Long Island
Entire East Coast offshore zone
~2,000+ ha (indicative)
TBC through technical studies
Over several decades
The deferral of Phase 2 until after the 2029 SEA Games is a deliberate accommodation: the waters east of Bedok Jetty are currently used for water sports and will host major aquatic events for the SEA Games. This sequencing shows that the government is managing the project’s community impact thoughtfully — a signal that should give East Coast residents some comfort about near-term disruption.
Environmental Findings: What the Study Revealed
HDB commissioned a formal Environmental Study covering the preparatory works, consulting nature groups on scope. The study’s key findings are reassuring for the majority of East Coast users:
Water quality: No significant changes expected; water will continue to meet Singapore’s prevailing marine water quality criteria throughout the works.
Currents and waves: Slight localised changes near Bedok Jetty are expected to have minimal impact on near-shore activities. Swimming can continue along the entire East Coast stretch.
Air quality and visibility: Up to minor visual impact from sand infilling operations; intermittent sediment plumes and dust are expected, mitigated by silt screen deployment and active dust monitoring under the Environmental Monitoring and Management Plan (EMMP).
Biodiversity: Some coral and seagrass beds found near the work site may experience short-term, localised impact from sediment plumes. However, the majority of coral and seagrass — including Sisters’ Islands Marine Park — is assessed as largely unaffected. HDB has committed to EMMP monitoring throughout.
Sea sports displacement: This is the most tangible near-term impact for active East Coast users. Kiteboarding is most affected; other sea sports face minor to moderate displacement. Agencies are working with affected user groups to identify alternative sites within the sea space east of Bedok Jetty in the interim.
Key Takeaway: The environmental study concludes that preparatory works will have manageable, temporary, and localised impacts — not the large-scale ecological disruption that some stakeholders had feared. Beaches remain open. Swimming is unaffected. The most significant disruption is displacement of marine leisure activities, particularly kiteboarding, which will require temporary relocation.
What This Means for East Coast Property Buyers and Owners
For property owners in the East Coast corridor — covering D15 (Katong, Tanjong Katong, Marine Parade), D16 (Bedok, Siglap, Upper East Coast), and the eastern planning areas (Tampines, Pasir Ris, Changi) — the Long Island announcement is a long-term positive with a short-term noise caveat.
Short-term (2026–2029): Managed Disruption
The preparatory works will generate visible marine activity offshore — construction vessels, sand infilling operations, and temporary bunds. From the shoreline, this will be noticeable but distant (at least 130m offshore). Air quality impacts are expected to be minor and intermittent. Beaches remain open. The practical implication for property values is minimal in the short term: these works are a public infrastructure programme, not a lifestyle degradation, and they come with an explicit government commitment to environmental monitoring and mitigation.
Medium-term (2029–2035): Planning Uplift Begins
As the preparatory phase completes and the URA begins formal planning for Long Island’s reclamation profile, the East Coast will progressively benefit from the same planning-uplift dynamic that has historically preceded major Singapore waterfront transformations. When Marina Bay was being planned in the 1980s and 1990s, property in D1 and D2 began appreciating in anticipation of the new precinct long before a single building was complete. Long Island represents a similar, though slower, catalyst for the D15/D16 corridor.
Long-term (2035+): Transformative Uplift
When the full Long Island reclamation creates new land along the East Coast — including a future reservoir — the implications for D15 and D16 property are substantial: extended waterfront promenade access, reduced flood risk (supporting insurance and bank valuations), new residential parcels potentially creating supply (a risk to existing owners) but also major new amenity and connectivity (a positive for the precinct as a whole). The 2026 URA Q2 price data already showed D15 benefiting from TEL Stage 4 connectivity; the Long Island catalyst is additive to this structural tailwind over the 2030s and beyond.
Horizon
Impact on East Coast Property
Key Risk
2026–2029 (prep works)
Neutral to marginally negative optics; no material price impact expected
Marine activity visible from beachfront; minor sea-sport disruption
2029–2035 (early planning)
Positive sentiment as Long Island masterplan solidifies; planning uplift begins
Timeline may slip; full reclamation profile remains unconfirmed
2035+ (reclamation & beyond)
Transformative — new waterfront, reduced flood risk, new amenity corridors
New residential supply on Long Island may moderate prices on existing stock
Public Engagement and What Comes Next
The URA reiterated in the 30 June 2026 announcement that Singapore’s commitment to public engagement on Long Island planning remains firm. The government has engaged more than 14,000 people to date on Long Island’s vision. From end-2026, a new phase of public engagement will invite Singaporeans to shape key planning topics including recreational uses along the new coastline, the design of the future reservoir, and the character of new precincts that will eventually emerge.
Crucially, the URA clarified that the area used for preparatory works is not the final Long Island land profile. The reclamation profile will be determined through subsequent technical studies — covering environmental impact assessments for the actual reclamation, engineering studies, and further public engagement — expected to take several more years. Main reclamation works will only commence after these studies are complete and mitigation measures are determined.
The Environmental Study report was published for public feedback for four weeks from 30 June 2026. Members of the public may view it and submit feedback at go.gov.sg/long-island.
Frequently Asked Questions: Long Island and East Coast Property
Will the preparatory works affect East Coast Park beach access?
No. All beaches along East Coast Park will remain open throughout the preparatory works. Near-shore swimming can continue along the entire stretch of the East Coast. Exercise paths and tracks for jogging and cycling also remain fully accessible. The works are offshore (at least 130m from the shoreline) and cordoned off for public safety. Safety advisories will be posted at East Coast Park and on government agency websites.
How might Long Island affect property values in D15 and D16?
In the short term (2026–2029), the preparatory works are unlikely to have a material impact on property values in D15 (Marine Parade, Katong, Tanjong Katong) or D16 (Bedok, Upper East Coast, Siglap). The works are offshore, temporary, and environmentally monitored. In the medium to long term, Long Island is broadly a positive catalyst for the East Coast corridor — creating new waterfront, improved flood protection, and eventually new amenities. However, buyers should note that full Long Island reclamation is decades away and carries execution and timeline uncertainty. Purchase decisions should be based on the neighbourhood’s existing merits, with Long Island treated as optionality, not a near-term price driver.
What is the difference between the preparatory works and the main Long Island reclamation?
The preparatory works (beginning end-2026) involve seabed clearance, temporary bund construction, and sand infilling — foundational marine works that create the conditions for eventual reclamation without being the reclamation itself. The area used for preparatory works is not the final land profile of Long Island. The main reclamation works — which will actually create the new island — will only commence after the government completes further technical studies, determines mitigation measures, and incorporates feedback from additional public engagement rounds. This could be many years away. Think of the preparatory works as clearing and grading a site before construction, not as the construction itself.
Will Long Island create new HDB or private residential areas in the future?
Long Island’s ultimate land use profile — including any residential development — has not been finalised. The URA has noted that planning will incorporate findings from technical studies and public engagement, and that the government retains flexibility to meet evolving national needs. Historically, Singapore’s reclaimed land has been used for a mix of residential, commercial, and infrastructure purposes. It is reasonable to expect that some Long Island land will eventually be developed for housing, but the specific profile, tenure, and density remain undecided. Any residential development on Long Island is likely to be 15–25 years away.
Can I still use East Coast Park for water sports during the works?
Most water sports can continue, but with some adjustment. Near-shore swimming is unaffected. However, sea sports that require more sea space — particularly kiteboarding — will be the most significantly impacted, as the Phase 1 work area covers much of the sea space west of Bedok Jetty. Agencies are working with affected groups to identify alternative sites, including the sea space east of Bedok Jetty (until Phase 2 begins post-2029). Recreational paddling, kayaking, and water skiing in near-shore areas should be largely unaffected, though users should maintain safe distances from vessels and the cordoned work area.
Disclaimer: This article is an editorial summary of URA/HDB press release pr26-50 (30 June 2026). All project details, timelines, areas, and environmental findings cited are drawn from that official source. Property value commentary reflects editorial analysis only and does not constitute investment advice. Long Island timelines are subject to change by the Singapore Government. Readers should consult official sources — go.gov.sg/long-island, URA, HDB — and qualified property professionals before making property decisions based on this or any infrastructure announcement.
Quick Answer: JLD Town Hall Link White Site at a Glance
Site: Town Hall Link, Jurong Lake District (JLD), adjacent to the Jurong Town Hall national monument.
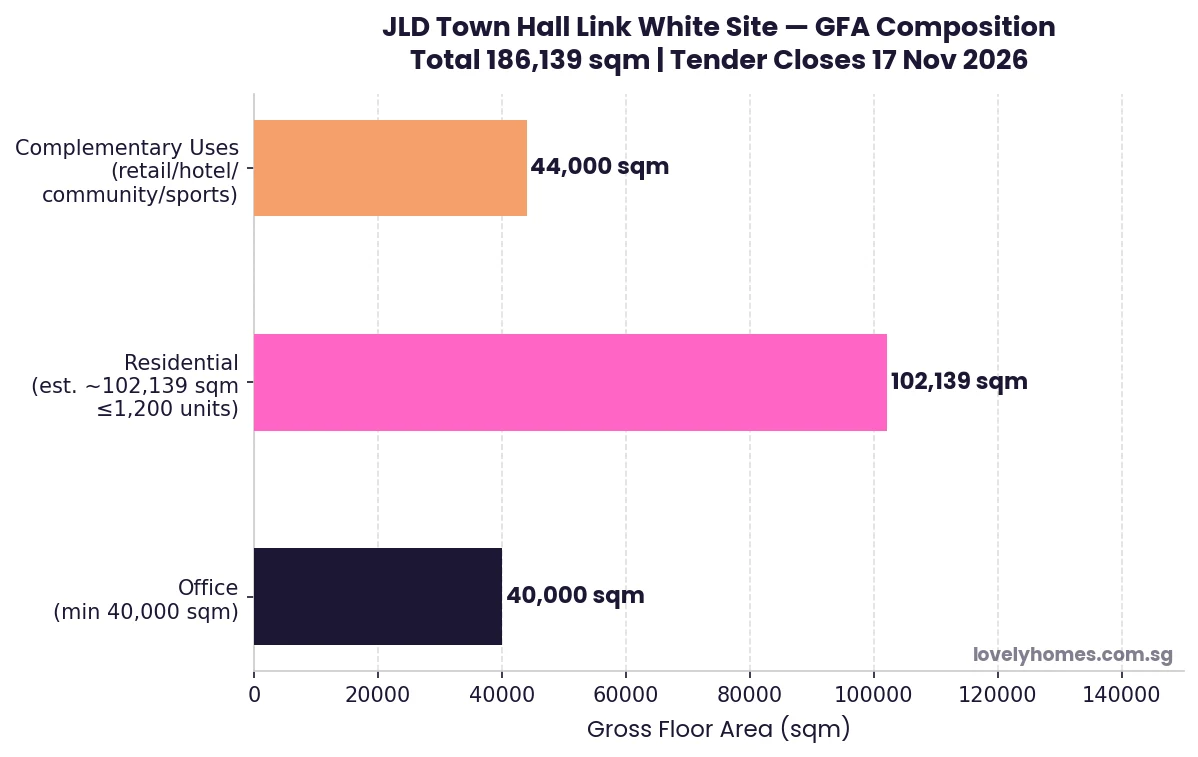
Total GFA: 186,139 sqm — one of the largest mixed-use sites launched in Singapore in recent years.
Residential: up to 1,200 private residential units.
Office: minimum 40,000 sqm — anchoring JLD’s ambition as the largest business node outside the city centre.
Complementary uses: up to 44,000 sqm for retail, serviced apartments, hotel, sports, community and medical facilities.
Connectivity: integrated with Jurong East MRT interchange (EWL/NSL), future JRL JE5 station, and upcoming CRL CR19 station (planned 2032).
Tender closes: 17 November 2026.
Why it matters: the White site designation gives developers flexibility to configure uses — residential, commercial, or mixed — based on market conditions at launch, making it one of Singapore’s most strategically significant land sales of 2026.
URA Launches JLD White Site: Singapore’s Most Anticipated 2H 2026 GLS Tender
The Urban Redevelopment Authority (URA) launched the tender for a White site at Town Hall Link in the Jurong Lake District (JLD) on 3 July 2026, marking one of the most significant Government Land Sales (GLS) moves of the year. At 186,139 sqm of total potential Gross Floor Area (GFA) — comprising a minimum 40,000 sqm of office, up to 1,200 private residential units, and 44,000 sqm of complementary uses — this site has the potential to define the next chapter of Singapore’s western regional centre.
The tender forms part of the Confirmed List for the 2H 2026 GLS Programme and will close at 12 noon on 17 November 2026. It comes less than two weeks after URA released its Q2 2026 property price flash estimate showing the overall private residential PPI rising a modest 0.5% — a market context that is stable enough for developers to bid with confidence, but not so frothy as to suggest over-payment risk.
JLD is Singapore’s flagship decentralisation initiative: a vision to create a vibrant live-work-play precinct in the western part of Singapore that can absorb commercial, residential, and civic activity without adding further pressure on the already-congested central business district. The Town Hall Link site occupies a prime position within this vision — sited next to the Jurong Town Hall national monument, directly connected to the Jurong East MRT interchange, and in the future path of two new MRT lines.
What Is a White Site?
A White site in Singapore’s GLS framework is a land parcel that developers may develop for any combination of uses permitted under the Master Plan, subject to a minimum requirement for one or more specified uses. Unlike purpose-specific GLS sites (e.g., residential-only or commercial-only), a White site allows developers to calibrate the use mix based on their read of market conditions at the time of design and launch.
For the Town Hall Link site specifically, the conditions are: minimum 40,000 sqm office; up to 1,200 residential units; and up to 44,000 sqm for complementary uses. The developer awarded the site will have latitude to decide the precise mix of hotel, serviced apartments, retail, community facilities, and sports/recreation components — creating significant design flexibility in exchange for the commitment to deliver a meaningful commercial core.
White sites have historically attracted strong bidding interest in Singapore because they reduce the development risk associated with committing entirely to a single use in a market that can shift between residential launch and commercial occupation. The last major White site in JLD — the site that became J Gateway and the surrounding cluster — generated keen bidding when it was first introduced.
Figure 1: Town Hall Link White Site — indicative GFA breakdown by use. Total 186,139 sqm. Source: URA pr26-53, 3 July 2026.
The JLD Masterplan: Context for This Site
JLD’s transformation has been driven by two decades of sustained government investment in infrastructure and planning. The revitalised Jurong Lake Gardens (90 hectares) provides the greenery spine at the district’s heart. Two new MRT lines are changing the connectivity calculus dramatically:
Jurong Region Line (JRL): JE5 station at Jurong East and JE6 station at International Business Park (planned to open 2028).
Cross Island Line (CRL): CR19 station at the heart of the new JLD precinct (planned to open 2032).
The addition of CRL is particularly significant: it will provide a direct east-west connection from JLD to Ang Mo Kio, Pasir Ris, and eventually Changi — transforming what has historically been perceived as a “western” destination into a genuinely cross-island node. For the Town Hall Link site, the multi-level pedestrian connections to Jurong East MRT interchange and the upcoming CR19 station mean that residents and office workers at this development will enjoy arguably the best public transport connectivity of any mixed-use site currently on the GLS market.
The site sits next to the Jurong Town Hall, a gazetted national monument. This adjacency imposes design constraints — any development will need to respect the monument’s visual and physical setting — but also provides a distinctive civic character that differentiates the JLD precinct from purely commercial developments elsewhere.
Development Mix Analysis
Use Component
GFA (sqm)
Status
Commentary
Office
40,000 minimum
Mandatory
Anchors JLD’s role as business node; positions site as corporate headquarters address
Private Residential
Up to ~102,139 (est.), max 1,200 units
Optional (developer discretion)
1,200 units at typical 80–90 sqm average ≈ 102,000 sqm; adds residential critical mass to district
Complementary Uses
Up to 44,000
Optional (developer discretion)
Can include: retail, hotel, serviced apartments, sports/recreation, medical clinics, community facilities, visitor attractions
Total GFA
186,139
One of Singapore’s largest mixed-use GLS sites
At 1,200 residential units, this would represent one of Singapore’s larger single-site condominium developments — comparable in scale to recent developments like Canninghill Piers (696 units) and Lentor Modern (605 units), but notably larger. The scale is appropriate for JLD’s ambition to create residential density that sustains the commercial base.
Key Catalysts and Infrastructure Timeline
The development that occupies this site will benefit from a series of planned catalysts over the 2026–2035 horizon:
Catalyst
Timeline
Impact on Site
JRL JE5 (Jurong East) and JE6 (International Business Park)
Phased opening, 2027–2028
Improved east-west connectivity within JLD; connects IBP to Jurong East interchange
New Science Centre at JLD
Expected by 2027
Adds visitor attraction and civic anchor to the precinct; drives weekend footfall
Jurong Gateway Hub (bus interchange + office + retail + community club + library + sports)
Expected by 2028
Integrated civic hub immediately adjacent; dramatically increases JLD’s daytime and evening population
CRL CR19 station at JLD
Planned 2032
Cross-island connectivity; potential 15% to 20% capital value uplift for residential units at this site based on historical TEL/MRT proximity premiums
Residential Investment Angle: 1,200 Units in JLD
If the awarded developer proceeds with the full 1,200-unit residential allocation, this will be among the more significant new private residential supply additions to JLD since the area last saw major development activity in the 2013–2017 era (J Gateway, Westwood Residences, Lake Grande, Twin Vew). JLD has historically commanded a premium relative to other OCR locations — driven by the live-work-play narrative, the lake setting, and the Jurong East MRT interchange’s accessibility to both the western industrial belt and the central business district via the East-West Line.
A new-launch condo at this site, post-CRL connectivity, could plausibly target $2,000–$2,400 psf based on the trajectory of comparable new launches in OCR/RCR boundary locations in 2025–2026. The tender price paid by the developer will be the key determinant of eventual launch pricing — a high land bid will translate into a premium launch price, while a competitive-but-measured bid could allow the developer to price attractively and generate strong take-up. The tender close date of 17 November 2026 gives the market approximately four and a half months to assess these dynamics.
What This Means for the Broader Market
The JLD White Site launch is a policy signal as well as a commercial opportunity. URA’s decision to include a major White site in the 2H 2026 Confirmed List — rather than deferring it to the Reserve List — indicates confidence that developer demand is sufficient to support a committed bid within the current market cycle. The White site mechanism also signals flexibility: if the residential market softens before design completion, the developer can weight the mix toward commercial and serviced apartment uses.
For existing JLD residential owners — in projects like J Gateway, Lake Grande, Twin Vew, and the upcoming The LakeGarden Residences — the Town Hall Link development represents both an opportunity (improved amenity and connectivity as the precinct builds out) and a risk (increased residential supply within the immediate catchment). On balance, the infrastructure and amenity uplift from the New Science Centre, Jurong Gateway Hub, and CRL CR19 is likely to outweigh the supply effect, particularly for well-located existing units.
What Might Come Next
The following is editorial commentary — not official guidance.
Bidding for the Town Hall Link site is expected to attract Singapore’s larger developers and possibly joint ventures. The scale of the site (186,139 sqm) requires significant capital — a land price in the S$1.5–S$2.5 billion range would not be surprising, depending on the assumed residential launch pricing and the developer’s commercial income projections. International developers with Asian regional headquarters-in-a-hub ambitions could also consider the mandatory 40,000 sqm office component as a corporate campus opportunity.
The CRL CR19 station opening in 2032 is a known future catalyst — developers will model this into their land bid assumptions. A project that launches residential units in 2028–2029 (assuming a 2027 tender award, 1-year design/approval, and early 2028 launch) would be telling buyers that their units will be CRL-connected by the time they reach the 5-year mark of ownership.
Frequently Asked Questions
What does “White site” mean for buyers of the eventual development?
A White site designation affects the developer’s design choices, not individual buyers’ rights. When the eventual development is launched for sale, buyers will purchase units in a standard private condominium development. They will benefit from the mixed-use amenities — retail, food and beverage, possibly a hotel or serviced apartment building within the same development — that result from the White site configuration. The White site label itself conveys no special lease conditions or restrictions on buyers beyond the standard conditions of a freehold or 99-year leasehold private condominium.
When will the residential units at Town Hall Link be available for sale?
The tender closes 17 November 2026. Assuming the tender is awarded in Q1 2027, and accounting for design, planning approval, and construction timelines, the earliest a residential launch could realistically occur is late 2027 or 2028. Physical completion (Temporary Occupation Permit) would likely follow in 2030–2032. Prospective buyers interested in this development should monitor URA and the awarded developer’s announcements in 2027.
How does the JLD CRL station affect property values nearby?
Historical evidence from Singapore MRT openings — most recently the Thomson-East Coast Line (TEL) stages 1–4 and the Downtown Line — suggests that residential properties within 500 metres of a new MRT station tend to appreciate by 8–15% relative to comparable properties further away in the 3–5 years following station opening. The effect is partially priced in ahead of the opening as buyers and investors anticipate the connectivity uplift. For CR19 (planned 2032), properties in the immediate JLD precinct likely already incorporate some forward-looking CRL premium in 2026. The full premium crystallises as the opening date approaches and actual connectivity is confirmed.
Is the Town Hall Link site freehold or leasehold?
GLS sites in Singapore are typically sold on 99-year leasehold terms. The Town Hall Link site is expected to follow this standard. Buyers of units in the eventual development will hold 99-year leasehold titles, with the lease commencement date tied to the date of the land award. Leasehold tenure is the norm for new GLS-sourced developments in Singapore; the premium-location attributes of the site — MRT connectivity, JLD masterplan, CRL uplift — are expected to sustain long-term value notwithstanding the leasehold structure.
What other major GLS sites were launched in 2H 2026?
The 2H 2026 GLS Confirmed List provides a total of 4,745 private residential units. In addition to the Town Hall Link White site, URA also launched sites at Lorong Puntong/Sin Ming Avenue (~140 units, TEL Bright Hill MRT, tender closes 15 September 2026) and Kitchener Link (~145 units, Reserve List, Farrer Park MRT NEL). The full 2H 2026 GLS programme — including industrial and commercial sites — is available on the URA website at ura.gov.sg/land-sales.
This article is for general informational purposes only and does not constitute financial or investment advice. Details of the Town Hall Link White site are sourced from URA press release pr26-53 (3 July 2026) and the URA website. Developer bidding, design outcomes, launch pricing, and project timelines are speculative editorial commentary and do not represent commitments by URA or any developer. For authoritative site details and tender conditions, refer to ura.gov.sg. Consult a licensed financial adviser before making any property investment decision.
Overall PPI: +0.5% QoQ — a deceleration from +0.9% in Q1 2026. Prices are still rising but at a slower pace.
Core Central Region (CCR) rebounded: +2.0% (vs +0.6% in Q1 2026) — luxury segment recovering after two quarters of underperformance.
Rest of Central Region (RCR): −1.4% (vs +0.8% in Q1) — notable reversal; high-priced new launches in this segment may have peaked.
Outside Central Region (OCR): −0.2% (vs +2.2% in Q1) — mass market segment cools after a strong Q1.
Landed properties: +2.6% (vs −0.4% in Q1) — sharp rebound in the landed segment, driven by supply scarcity.
Transaction volume: 5,420 units (up to mid-June) — broadly comparable to Q1’s 5,413. No supply glut or demand collapse.
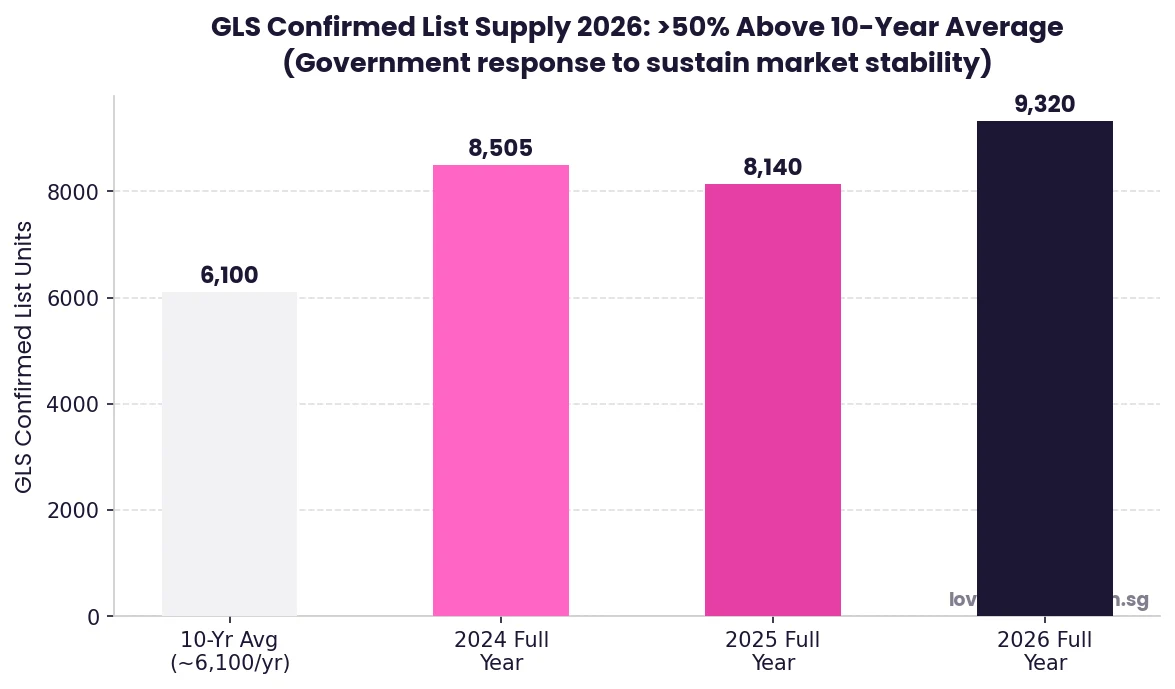
Government response: 2H 2026 Confirmed List GLS supply = 4,745 units; full-year 2026 Confirmed List = 9,320 units, over 50% above the 10-year average.
Full Q2 statistics will be released by URA on 24 July 2026.
Singapore Q2 2026 Private Residential Property Prices: A Measured Softening
Singapore’s private residential property market continued its gradual moderation in the second quarter of 2026, according to the flash estimate released by the Urban Redevelopment Authority (URA) on 1 July 2026. The overall Private Residential Property Price Index (PPI) rose by 0.5% on a quarter-on-quarter basis — a visible step down from the 0.9% gain recorded in Q1 2026 and a world away from the 3%+ quarterly swings seen during the 2021–2022 boom.
The headline figure conceals a striking divergence beneath the surface: the Core Central Region (CCR) — Singapore’s luxury prime district covering the traditional Central Business District fringe, Orchard Road, and Sentosa Cove — rebounded strongly with a 2.0% gain, while the Rest of Central Region (RCR) and Outside Central Region (OCR) recorded modest declines of 1.4% and 0.2% respectively. Landed properties, which had dipped 0.4% in Q1, surged 2.6% in Q2 — reflecting the structural supply scarcity of this asset class.
The flash estimate is based on transaction prices submitted for stamp duty payment and developer sales data from 1 April 2026 up to mid-June 2026. The full Q2 2026 real estate statistics — covering HDB resale, rental, and the complete development pipeline — will be published by URA on 24 July 2026.
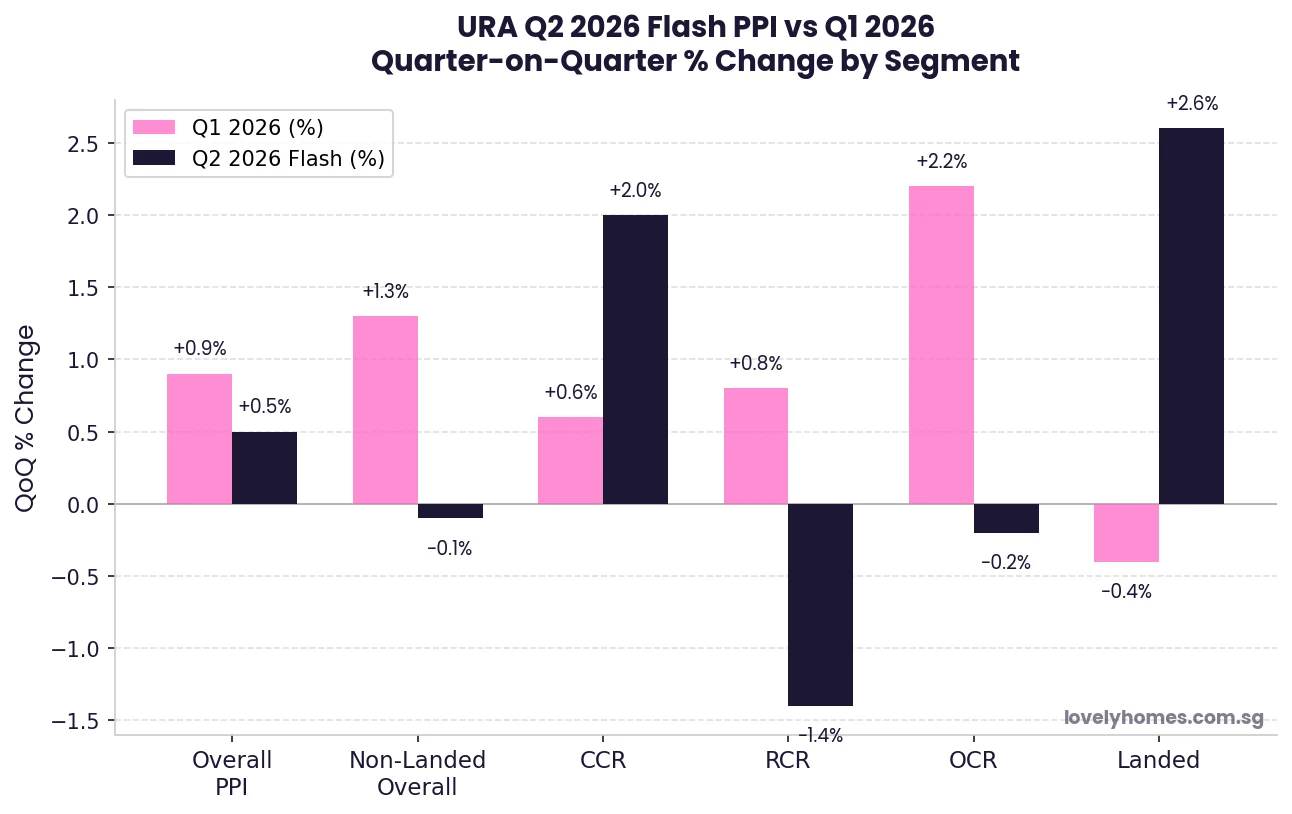
Figure 1: URA Q2 2026 PPI flash estimate — quarter-on-quarter % change by segment, compared to Q1 2026. Source: URA press release pr26-51, 1 July 2026.
Segment-by-Segment Analysis
Segment
Q1 2026 QoQ %
Q2 2026 Flash QoQ %
Direction
Overall PPI
+0.9%
+0.5%
↓ Deceleration
Non-Landed Overall
+1.3%
−0.1%
↓ Turned Negative
CCR (Core Central Region)
+0.6%
+2.0%
↑ Sharp Recovery
RCR (Rest of Central Region)
+0.8%
−1.4%
↓ Sharp Reversal
OCR (Outside Central Region)
+2.2%
−0.2%
↓ Turned Negative
Landed Properties
−0.4%
+2.6%
↑ Sharp Rebound
CCR rebound: The 2.0% CCR gain in Q2 is the strongest single-quarter reading for this segment since early 2024. The CCR has historically lagged the OCR/RCR recovery because foreign buying — the CCR’s key demand driver — was hit hardest by the April 2023 cooling measures (which raised the foreigners’ ABSD from 30% to 60%). The Q2 2026 recovery suggests that either (a) some internationally mobile buyers are re-engaging despite the 60% ABSD, or (b) domestic upgrader demand from Singaporeans and PRs is filling the luxury segment. The URA’s full Q2 data release on 24 July will shed more light on the transaction mix.
RCR contraction: The −1.4% RCR reading is notable. The RCR has been the market’s most active new-launch corridor, with several high-profile projects launching in 2025–2026 at elevated per-square-foot prices. A reversion in Q2 may reflect buyers’ price resistance after the aggressive pricing of some recent launches, combined with increased competition from HDB upgraders who are now also being drawn by improving BTO supply timelines.
Landed recovery: The 2.6% landed rebound follows a brief Q1 pause. Singapore’s landed housing supply is essentially fixed — there is virtually no new landed housing land being released — and as such, landed prices reflect pure demand dynamics. The Q2 strength likely reflects pent-up demand from local ultra-high-net-worth families who had been watching the market from the sidelines.
Transaction Volume: Stable, Not Surging
Sale transaction volume for Q2 2026 (up to mid-June) totalled 5,420 units, broadly comparable to Q1 2026’s 5,413 units. This stability is significant: it indicates that the market is transacting at a healthy pace without the frenzied turnover of 2021–2022 (when quarterly volumes regularly exceeded 6,000–7,000 units). A market that transacts steadily at moderate volumes — without speculative churning — is precisely what Singapore’s property policy framework has been calibrated to achieve.
The comparable volume across Q1 and Q2, combined with decelerating overall price growth, is broadly consistent with URA’s characterisation of the market as “broadly stable.” There is no sign of a demand-side collapse, nor of a renewed speculative surge.
Government Policy Response: GLS Supply Elevated
In its press release accompanying the Q2 2026 flash estimate, URA noted that the Government is sustaining a high and steady supply of private housing through the Government Land Sales (GLS) Programme. Key supply data:
2H 2026 Confirmed List: 4,745 private residential units to be launched.
Full-year 2026 Confirmed List: 9,320 units — over 50% higher than the past 10-year annual average of approximately 6,100 units.
Total pipeline (including ECs): around 61,000 private residential units expected to be completed over the next few years.
Figure 2: GLS Confirmed List supply — 2026 full year at 9,320 units is more than 50% above the 10-year average, reflecting the government’s commitment to market stability. Source: URA.
What This Means for Property Buyers and Sellers
For buyers, the Q2 2026 data reinforces a cautious but constructive outlook. The market is not in free fall, but neither is it in a runaway boom. Price growth is positive but subdued at the overall level, meaning buyers who act carefully — securing financing, doing diligent market research, and buying at realistic prices — are unlikely to face an immediately adverse market movement. The government’s elevated GLS supply commitment over the coming years means that the supply pipeline will continue to exert a moderating influence on prices in the medium term.
For sellers, the divergence between CCR strength and RCR/OCR softness matters. Sellers of mass-market condominiums in the RCR and OCR face a more challenging environment than they did in early 2026, when Q1 showed strong gains. Setting realistic asking prices — based on recent comparable transactions rather than the 2021–2022 peak — will be critical to achieving timely sales.
URA reminds buyers that “the macroeconomic outlook remains highly uncertain,” and that “households are advised to exercise prudence when purchasing property and taking out mortgage loans.” In a global environment where interest rates remain elevated and economic uncertainty persists, this is sound counsel.
What Might Come Next
The following is analytical commentary — not official guidance.
The Q2 2026 flash PPI reading, combined with the full-year supply trajectory, suggests the most likely scenario is continued modest positive overall price growth through H2 2026 — perhaps in the +0.2% to +0.8% range per quarter — with the CCR outperforming and OCR/RCR remaining relatively flat or slightly negative. A material downside scenario (sharp price falls) would require a severe external shock — a global recession, a sharp rise in Singapore unemployment, or a significant tightening of MAS monetary conditions. None of these appear imminent as at early July 2026.
The June 2026 JLD White Site tender launched by URA (Town Hall Link; tender closes 17 November 2026) adds a significant new mixed-use supply node to the western corridor. Investor sentiment around this site will be a useful bellwether for developer confidence in the H2 2026 market — a strong bid premium would signal that private developers remain bullish despite the moderating price environment.
Frequently Asked Questions
What is the URA PPI and how is it calculated?
The URA Private Residential Property Price Index (PPI) measures the change in prices of private residential properties in Singapore on a quarterly basis. It is compiled by URA using transaction data from stamp duty submissions and developer sale returns, covering all private residential transactions (both new sales and resale). The index uses a hedonic regression model that controls for property characteristics (size, location, floor level, age) to isolate pure price change from changes in the mix of properties transacted. The flash estimate, released around the first day of the following quarter, is a preliminary reading based on transactions up to mid-quarter; the full estimate, released three to four weeks later, incorporates complete quarter data and may differ from the flash figure.
Why did CCR prices rise so sharply in Q2 2026?
The CCR’s 2.0% rebound likely reflects a combination of factors: (1) limited new CCR supply coming to market in Q2 2026, creating upward price pressure on the available stock; (2) renewed demand from Singapore Citizens and PRs upgrading to prime-district condominiums, partially replacing the foreign demand that was curtailed by the 2023 cooling measures; and (3) the delayed effect of earlier GLS site launches around the Orchard / River Valley / Marina Bay corridors. The CCR has historically been more volatile than OCR/RCR — large individual transactions can move the segment average. The full Q2 data release on 24 July 2026 will clarify whether this rebound is broad-based or driven by a handful of high-value transactions.
What is 61,000 units in pipeline mean for future prices?
URA’s announcement that approximately 61,000 private residential units (including executive condominiums) are expected to be completed “in the next few years” represents a substantial supply pipeline. As a reference point, annual demand for private homes in Singapore has typically ranged from 8,000 to 13,000 units per year over the past decade. A pipeline of 61,000 units spread over approximately 5–6 years implies a continued period of elevated completions that is expected to moderate demand-supply imbalances and limit sharp price appreciation. This is a deliberate policy signal from the government: it is committed to keeping supply well ahead of demand to prevent the kind of price spike seen in 2021–2022.
Should I buy now or wait for the full Q2 data on 24 July 2026?
For most buyers, the difference between the flash estimate and the full Q2 data release (on 24 July 2026) will be immaterial to their purchase decision. The flash estimate is generally close to the final figure. Waiting for the full release — if you are ready to buy and have found a suitable property — is unlikely to reveal a dramatically different picture. More meaningful than the index number is individual property pricing relative to comparable transactions, your personal financing capacity, and your long-term holding horizon. The PPI is a broad market average; individual properties in specific locations can diverge significantly from the average.
Is now a good time to invest in Singapore property given this data?
This article does not constitute financial advice. The Q2 2026 data presents a mixed but broadly stable picture: limited overall price growth, elevated supply pipeline, divergent performance across segments. For owner-occupiers, Singapore property remains a significant but generally sound long-term asset — the fundamentals (limited land, stable governance, strong rule of law, robust demand from domestic upgraders) are intact. For investors, the combination of elevated ABSD (for second-property and foreign purchases), 4% SSD on early disposals, moderate rental yields (typically 2.5%–3.5% for private condominiums), and elevated mortgage rates means that the return calculus is tighter than it was in 2019 or 2021. Independent financial advice from a licensed professional is strongly recommended before making any investment property decision.
This article is for general informational purposes only and does not constitute financial or investment advice. Property market data is sourced from URA press release pr26-51 (1 July 2026) and supplementary URA publications. All analysis and projections are LovelyHomes editorial commentary and should not be relied upon as predictions of future prices or market movements. For authoritative data, refer to www.ura.gov.sg. Before making any property purchase or investment decision, consult a licensed financial adviser and a licensed real estate salesperson registered with the Council for Estate Agencies (CEA).
Quick Answer: What Is Driving Singapore Luxury Home Sales in 2026?
Singapore’s Core Central Region (CCR) posted a +2.0% price increase in Q2 2026 — the strongest of any market segment and a sharp reversal from Q1’s tepid +0.6%.
Industry observers and URA data point to a safe-haven demand thesis: high-net-worth individuals from Asia and globally are channelling wealth into Singapore amid geopolitical uncertainty in 2026.
Good Class Bungalow (GCB) deals in H1 2026 are reported to average S$2,121 per square foot — near all-time highs despite lower transaction volumes.
Foreigner buying share of private residential transactions remains below 2% due to the 65% ABSD, but dollar volumes in the CCR continue to outpace other regions.
The luxury market is bifurcating: sub-S$3M OCR and RCR condos are softening (OCR -0.2%, RCR -1.4% in Q2 2026), while trophy assets above S$5M are tightening.
Singapore’s combination of rule of law, no capital gains tax, SGD strength, and geopolitical neutrality underpins its premium positioning among global wealth management centres.
Full Q2 2026 transaction data is expected from URA on 24 July 2026 — the flash estimate published 1 July 2026 covers pricing only, not full volumes.
CCR Surges 2.0% in Q2 2026 as Luxury Demand Returns
Singapore’s Core Central Region (CCR) property market recorded a 2.0% price increase in Q2 2026, according to the Urban Redevelopment Authority’s flash estimate released on 1 July 2026. This makes the CCR the best-performing segment of the entire private residential market for the quarter — outpacing the overall market gain of 0.5% and standing in sharp contrast to the Rest of Central Region (RCR, -1.4%) and Outside Central Region (OCR, -0.2%), which both posted price declines.
The CCR’s outperformance is particularly notable given the backdrop: the wider Singapore private residential market has been moderating since early 2025, with the URA Private Property Price Index (PPI) recording gains of just 0.9% in Q1 2026 and 0.5% in Q2 2026 — well below the 8.4% full-year gain of 2023. The surge in CCR prices reflects a specific dynamic: demand from wealth-preserving investors, both domestic and international, for premium Singapore residential assets.
The Safe-Haven Thesis: Why Singapore Is Attracting Global Wealth
Industry observers note that Singapore’s luxury property market has increasingly attracted demand driven not by speculative gain but by wealth preservation. Several structural factors reinforce Singapore’s position as a premium repository of global capital in 2026.
Geopolitical diversification: Ongoing conflicts in Europe, rising trade tensions between the United States and China, and political uncertainty in multiple Southeast Asian nations have prompted high-net-worth individuals to diversify their real-asset holdings into jurisdictions perceived as politically stable. Singapore — with its neutral foreign policy, independent judiciary, and transparent legal framework — is among a short list of global cities offering this combination.
No capital gains tax: Singapore does not tax capital gains on property disposal (subject to the IRAS’s anti-speculation rules around short-term trading). For investors holding a property for more than three years, any appreciation is fully exempt from tax. This contrasts sharply with major competing markets: the United Kingdom taxes property gains at 18–28%, Australia at the marginal income rate, and Hong Kong at stamp duty and property tax regimes that have been progressively tightened.
Singapore Dollar resilience: The Monetary Authority of Singapore (MAS) manages the Singapore Dollar within a policy band that has delivered steady appreciation against a trade-weighted basket since the 1980s. For USD or EUR-denominated investors, Singapore property effectively provides implicit currency protection alongside the real-asset yield.
Rule of law and property rights: Singapore property title is freehold or 99-year leasehold under a clear and well-enforced framework. Title searches are transparent, conveyancing is regulated, and disputes are adjudicated by courts with a strong track record of enforcing property rights. There is no risk of compulsory acquisition without fair compensation under the Land Acquisition Act.
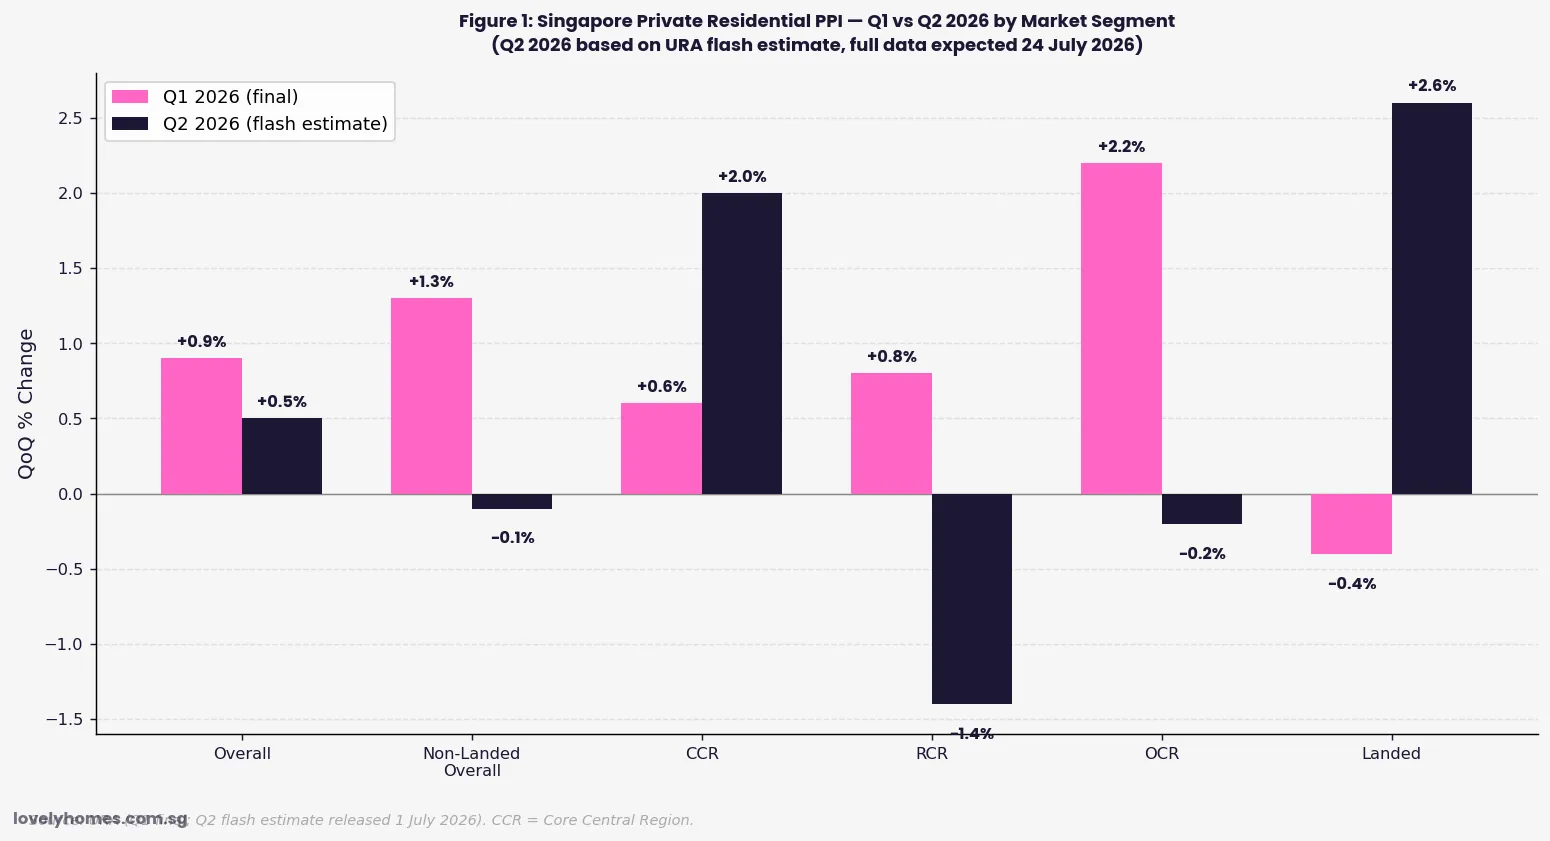
Figure 1: Singapore Private Residential PPI — Q1 vs Q2 2026 by Market Segment. Source: URA (Q2 based on flash estimate, 1 July 2026).
The Luxury Segment in Numbers: What the Data Shows
The Q2 2026 URA flash estimate provides pricing data but not full transaction volumes — those will be released with the full Q2 statistics on approximately 24 July 2026. However, the H1 2026 market narrative is already forming from the available data points.
Market Segment
Q1 2026 PPI Change
Q2 2026 PPI Change (Flash)
H1 2026 Direction
Overall Private Residential
+0.9%
+0.5%
Moderating
Non-Landed Overall
+1.3%
-0.1%
Softening
CCR (Core Central Region)
+0.6%
+2.0%
Accelerating
RCR (Rest of Central Region)
+0.8%
-1.4%
Correcting
OCR (Outside Central Region)
+2.2%
-0.2%
Cooling
Landed Residential
-0.4%
+2.6%
Rebounding
The data shows a clear bifurcation: mid-market mass-market condominiums (OCR and RCR) are softening or correcting, while the premium CCR segment and landed residential — the two categories most associated with high-net-worth buying — are strengthening. This is consistent with the safe-haven demand thesis: wealth-preserving buyers are focused on premium Singapore assets, not the mass-market segment where supply from new GLS sites is more acute.
Landed residential and GCBs: Industry data cited in market commentary indicates that Good Class Bungalow (GCB) transactions in H1 2026 averaged approximately S$2,121 per square foot — near historical highs. While GCB volume has been subdued (fewer than 20–30 transactions per half typically), the average transacted PSF points to the depth of demand at the very top of the market. GCBs are the only residential asset class in Singapore where the absolute supply is fixed by planning policy: there are approximately 2,800 GCB plots gazetted in 39 designated GCB Areas, and no new GCB land has been released since the 1990s.
ABSD as a Structural Filter: Who Is Still Buying at the Top End?
The 65% ABSD for foreigners did not eliminate luxury CCR buying — it filtered it. At the S$5 million price point, a foreign buyer pays S$3,250,000 in ABSD alone. The buyers who can absorb this cost are a qualitatively different group from the pre-2023 foreign luxury buyer cohort: predominantly ultra-high-net-worth (UHNW) individuals or family offices for whom the ABSD represents a tolerable cost of admission to a prized asset class rather than a prohibitive barrier.
The primary luxury buyer base in 2026 remains Singapore Citizens and PRs, who face no ABSD (SC 1st property) or 5% ABSD (SPR 1st property) respectively. Singapore-based UHNW families who have grown their wealth over the past two decades through private equity, technology, or trade finance are the backbone of CCR demand. A secondary and growing segment is foreign family office principals who have established Single Family Office (SFO) structures in Singapore under the Monetary Authority of Singapore’s SFO incentive framework — these are resident in Singapore and may qualify for SC or PR status over time.
What This Means for Property Buyers in Singapore
The CCR’s Q2 2026 outperformance is both a market signal and a policy-test. It signals that the ultra-premium segment is resilient to macroeconomic headwinds and retains structural demand even at historically high price levels. The question for the government is whether this resilience in the top tier justifies ongoing caution about relaxing the foreigner ABSD — or whether the bifurcation (luxury up, mass-market softening) suggests the cooling measures are having their intended effect of segmenting demand without depressing the overall market.
For Singapore Citizens and PRs looking at the CCR, the data suggests that the window of Q4 2025 / Q1 2026 softness (CCR posted only +0.6% in Q1) may have already passed. If the CCR’s Q2 2026 momentum carries into Q3, the entry window could narrow further. Buyers targeting premium properties — Orchard Road, Sentosa Cove, River Valley, Buona Vista — may find pricing firming through the second half of 2026.
What Might Come Next
The full Q2 2026 private residential statistics from URA (expected 24 July 2026) will reveal whether the CCR volume recovery matched the price recovery. If CCR transaction volumes in Q2 2026 show a meaningful uptick from the subdued Q1 levels, it would confirm the demand recovery is broad-based rather than driven by a small number of high-value transactions. Conversely, a further Q3 2026 reading above +1.5% CCR PPI growth could bring the CCR back onto the radar of the government’s cooling measure review — though any specific policy response ahead of the next scheduled review is speculative.
The full Q2 2026 HDB resale statistics (expected from HDB around 23 July 2026) will provide a complementary read on the mass-market segment — and whether the flash estimate’s -0.3% RPI decline was accurately captured. Taken together, the two data releases in late July 2026 will give the market its clearest picture yet of whether Singapore’s property bifurcation — luxury strengthening, mass-market moderating — is the dominant theme for H2 2026.
Frequently Asked Questions
Why is the CCR doing better than the RCR and OCR in 2026?
The Core Central Region comprises Districts 1–4 and 9–11 — the prime downtown and Orchard Road belt. It attracts a qualitatively different buyer profile: high-income Singapore residents, wealth-preserving investors, and family office principals. This cohort is less sensitive to interest rate cycles and supply pipeline impacts because they are buying premium or trophy assets rather than investment units. In contrast, the RCR and OCR have seen more mid-market supply from new Government Land Sales (GLS) sites, and their buyer base — including upgraders and first-time condo buyers — is more sensitive to mortgage rates and HDB resale price trends.
Can foreigners still buy Singapore luxury property given the 65% ABSD?
Yes, but the economics have changed dramatically since the April 2023 cooling measures. On a S$5 million CCR condo, a foreign buyer faces S$3,250,000 in ABSD alone. This effectively restricts the foreign luxury buyer market to ultra-high-net-worth individuals or family office structures where the ABSD is an acceptable cost of entry. MAS data suggests foreign buyer volumes remain below 2% of all private residential transactions — but their average deal size is materially higher than the market average, meaning they contribute disproportionately to CCR dollar volume.
What is a Good Class Bungalow (GCB) and why are prices so high?
Good Class Bungalows are the most exclusive form of landed residential property in Singapore, located within 39 designated GCB Areas gazetted under the URA Master Plan. GCBs must occupy a minimum land area of 1,400 square metres (about 15,000 sqft) and are subject to strict development controls. The supply is fixed at approximately 2,800 plots — no new GCB land has been created since the 1990s. Combined with strong demand from Singapore’s wealthiest families and a long-standing restriction on foreign ownership (SLA approval required), GCBs represent the most inelastic supply in the Singapore property market. Average transacted PSF of approximately S$2,121 in H1 2026 reflects this structural scarcity premium.
When will the full Q2 2026 property transaction data be released?
The Urban Redevelopment Authority typically releases full quarterly private residential statistics approximately 3–4 weeks after the quarter ends. The Q2 2026 flash estimate (covering the PPI only) was released on 1 July 2026. The full data — including transaction volumes, unit counts, new sales, sub-sales, and resale transactions by region and property type — is expected around 24 July 2026. LovelyHomes will cover the full release when it is published. For HDB resale statistics, the Q2 2026 full data (including median prices by flat type and town) is expected around 23 July 2026.
Is Singapore’s luxury property market in a bubble?
This is a contested question among market analysts. Arguments against a bubble: Singapore property prices are underpinned by genuine end-use demand, a restricted land supply, and government cooling measures that actively suppress speculative demand; the ABSD itself is the most powerful anti-bubble tool in the market. Arguments for caution: CCR prices are near historical highs on a PSF basis; low transaction volumes mean that a small number of trophy deals can move the index; and if global macroeconomic conditions worsen materially — reducing the “safe-haven” narrative — demand could soften quickly. The MAS monitors private residential price trends closely through its Financial Stability Review process, and will act if it assesses that price growth is becoming detached from fundamentals. As at July 2026, the government has not signalled any concern about a bubble in the CCR.
Disclaimer: This article is for general information and editorial purposes only. Property market data is sourced from URA’s Q2 2026 flash estimate (released 1 July 2026) — full Q2 2026 data is expected on approximately 24 July 2026. GCB and luxury transaction figures are indicative industry data. This article does not constitute investment advice. Readers should conduct their own research and seek qualified advice before making any property or investment decisions. LovelyHomes.com.sg is not a licensed real estate agency.