URA Q2 2026 Singapore Property Price Index: Market Softens as CCR Rebounds
Quick Answer: URA Q2 2026 PPI Flash Estimate
- Overall PPI: +0.5% QoQ — a deceleration from +0.9% in Q1 2026. Prices are still rising but at a slower pace.
- Core Central Region (CCR) rebounded: +2.0% (vs +0.6% in Q1 2026) — luxury segment recovering after two quarters of underperformance.
- Rest of Central Region (RCR): −1.4% (vs +0.8% in Q1) — notable reversal; high-priced new launches in this segment may have peaked.
- Outside Central Region (OCR): −0.2% (vs +2.2% in Q1) — mass market segment cools after a strong Q1.
- Landed properties: +2.6% (vs −0.4% in Q1) — sharp rebound in the landed segment, driven by supply scarcity.
- Transaction volume: 5,420 units (up to mid-June) — broadly comparable to Q1’s 5,413. No supply glut or demand collapse.
- Government response: 2H 2026 Confirmed List GLS supply = 4,745 units; full-year 2026 Confirmed List = 9,320 units, over 50% above the 10-year average.
- Full Q2 statistics will be released by URA on 24 July 2026.
Singapore Q2 2026 Private Residential Property Prices: A Measured Softening
Singapore’s private residential property market continued its gradual moderation in the second quarter of 2026, according to the flash estimate released by the Urban Redevelopment Authority (URA) on 1 July 2026. The overall Private Residential Property Price Index (PPI) rose by 0.5% on a quarter-on-quarter basis — a visible step down from the 0.9% gain recorded in Q1 2026 and a world away from the 3%+ quarterly swings seen during the 2021–2022 boom.
The headline figure conceals a striking divergence beneath the surface: the Core Central Region (CCR) — Singapore’s luxury prime district covering the traditional Central Business District fringe, Orchard Road, and Sentosa Cove — rebounded strongly with a 2.0% gain, while the Rest of Central Region (RCR) and Outside Central Region (OCR) recorded modest declines of 1.4% and 0.2% respectively. Landed properties, which had dipped 0.4% in Q1, surged 2.6% in Q2 — reflecting the structural supply scarcity of this asset class.
The flash estimate is based on transaction prices submitted for stamp duty payment and developer sales data from 1 April 2026 up to mid-June 2026. The full Q2 2026 real estate statistics — covering HDB resale, rental, and the complete development pipeline — will be published by URA on 24 July 2026.
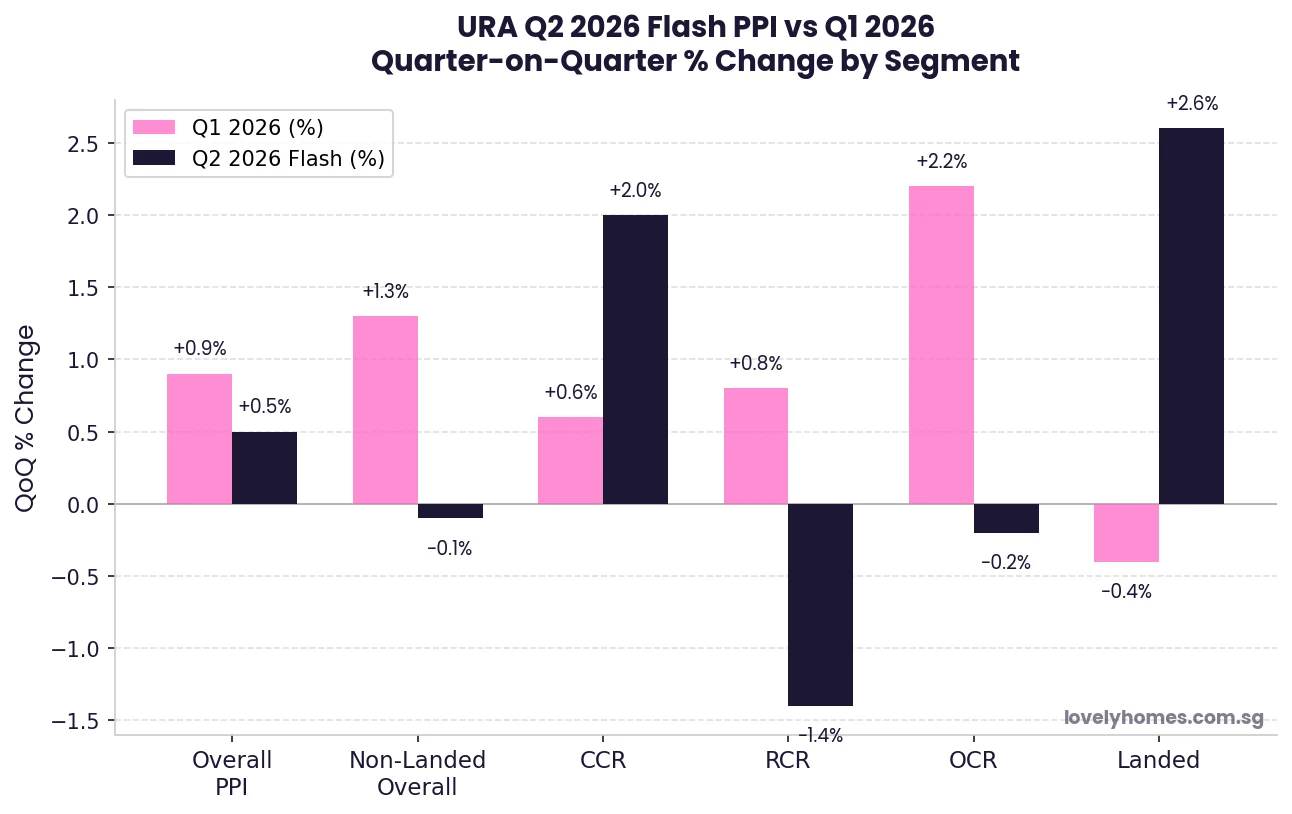
Figure 1: URA Q2 2026 PPI flash estimate — quarter-on-quarter % change by segment, compared to Q1 2026. Source: URA press release pr26-51, 1 July 2026.
Segment-by-Segment Analysis
| Segment | Q1 2026 QoQ % | Q2 2026 Flash QoQ % | Direction |
|---|---|---|---|
| Overall PPI | +0.9% | +0.5% | ↓ Deceleration |
| Non-Landed Overall | +1.3% | −0.1% | ↓ Turned Negative |
| CCR (Core Central Region) | +0.6% | +2.0% | ↑ Sharp Recovery |
| RCR (Rest of Central Region) | +0.8% | −1.4% | ↓ Sharp Reversal |
| OCR (Outside Central Region) | +2.2% | −0.2% | ↓ Turned Negative |
| Landed Properties | −0.4% | +2.6% | ↑ Sharp Rebound |
CCR rebound: The 2.0% CCR gain in Q2 is the strongest single-quarter reading for this segment since early 2024. The CCR has historically lagged the OCR/RCR recovery because foreign buying — the CCR’s key demand driver — was hit hardest by the April 2023 cooling measures (which raised the foreigners’ ABSD from 30% to 60%). The Q2 2026 recovery suggests that either (a) some internationally mobile buyers are re-engaging despite the 60% ABSD, or (b) domestic upgrader demand from Singaporeans and PRs is filling the luxury segment. The URA’s full Q2 data release on 24 July will shed more light on the transaction mix.
RCR contraction: The −1.4% RCR reading is notable. The RCR has been the market’s most active new-launch corridor, with several high-profile projects launching in 2025–2026 at elevated per-square-foot prices. A reversion in Q2 may reflect buyers’ price resistance after the aggressive pricing of some recent launches, combined with increased competition from HDB upgraders who are now also being drawn by improving BTO supply timelines.
Landed recovery: The 2.6% landed rebound follows a brief Q1 pause. Singapore’s landed housing supply is essentially fixed — there is virtually no new landed housing land being released — and as such, landed prices reflect pure demand dynamics. The Q2 strength likely reflects pent-up demand from local ultra-high-net-worth families who had been watching the market from the sidelines.
Transaction Volume: Stable, Not Surging
Sale transaction volume for Q2 2026 (up to mid-June) totalled 5,420 units, broadly comparable to Q1 2026’s 5,413 units. This stability is significant: it indicates that the market is transacting at a healthy pace without the frenzied turnover of 2021–2022 (when quarterly volumes regularly exceeded 6,000–7,000 units). A market that transacts steadily at moderate volumes — without speculative churning — is precisely what Singapore’s property policy framework has been calibrated to achieve.
The comparable volume across Q1 and Q2, combined with decelerating overall price growth, is broadly consistent with URA’s characterisation of the market as “broadly stable.” There is no sign of a demand-side collapse, nor of a renewed speculative surge.
Government Policy Response: GLS Supply Elevated
In its press release accompanying the Q2 2026 flash estimate, URA noted that the Government is sustaining a high and steady supply of private housing through the Government Land Sales (GLS) Programme. Key supply data:
- 2H 2026 Confirmed List: 4,745 private residential units to be launched.
- Full-year 2026 Confirmed List: 9,320 units — over 50% higher than the past 10-year annual average of approximately 6,100 units.
- Total pipeline (including ECs): around 61,000 private residential units expected to be completed over the next few years.
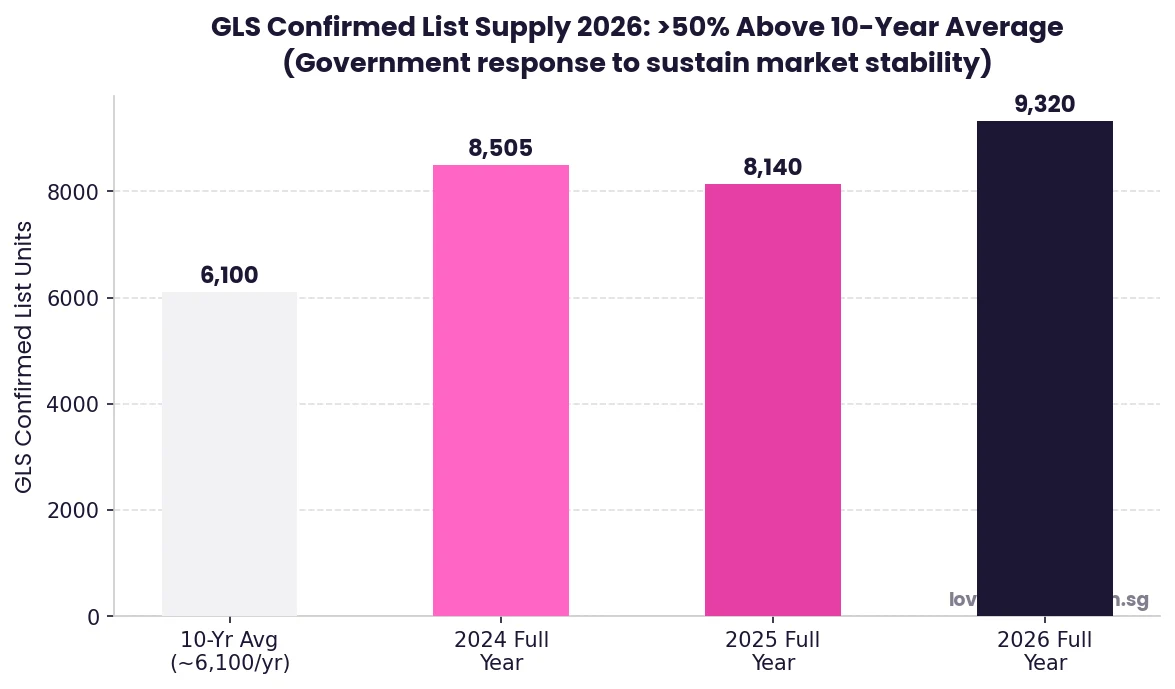
Figure 2: GLS Confirmed List supply — 2026 full year at 9,320 units is more than 50% above the 10-year average, reflecting the government’s commitment to market stability. Source: URA.
What This Means for Property Buyers and Sellers
For buyers, the Q2 2026 data reinforces a cautious but constructive outlook. The market is not in free fall, but neither is it in a runaway boom. Price growth is positive but subdued at the overall level, meaning buyers who act carefully — securing financing, doing diligent market research, and buying at realistic prices — are unlikely to face an immediately adverse market movement. The government’s elevated GLS supply commitment over the coming years means that the supply pipeline will continue to exert a moderating influence on prices in the medium term.
For sellers, the divergence between CCR strength and RCR/OCR softness matters. Sellers of mass-market condominiums in the RCR and OCR face a more challenging environment than they did in early 2026, when Q1 showed strong gains. Setting realistic asking prices — based on recent comparable transactions rather than the 2021–2022 peak — will be critical to achieving timely sales.
URA reminds buyers that “the macroeconomic outlook remains highly uncertain,” and that “households are advised to exercise prudence when purchasing property and taking out mortgage loans.” In a global environment where interest rates remain elevated and economic uncertainty persists, this is sound counsel.
What Might Come Next
The following is analytical commentary — not official guidance.
The Q2 2026 flash PPI reading, combined with the full-year supply trajectory, suggests the most likely scenario is continued modest positive overall price growth through H2 2026 — perhaps in the +0.2% to +0.8% range per quarter — with the CCR outperforming and OCR/RCR remaining relatively flat or slightly negative. A material downside scenario (sharp price falls) would require a severe external shock — a global recession, a sharp rise in Singapore unemployment, or a significant tightening of MAS monetary conditions. None of these appear imminent as at early July 2026.
The June 2026 JLD White Site tender launched by URA (Town Hall Link; tender closes 17 November 2026) adds a significant new mixed-use supply node to the western corridor. Investor sentiment around this site will be a useful bellwether for developer confidence in the H2 2026 market — a strong bid premium would signal that private developers remain bullish despite the moderating price environment.
Frequently Asked Questions
What is the URA PPI and how is it calculated?
The URA Private Residential Property Price Index (PPI) measures the change in prices of private residential properties in Singapore on a quarterly basis. It is compiled by URA using transaction data from stamp duty submissions and developer sale returns, covering all private residential transactions (both new sales and resale). The index uses a hedonic regression model that controls for property characteristics (size, location, floor level, age) to isolate pure price change from changes in the mix of properties transacted. The flash estimate, released around the first day of the following quarter, is a preliminary reading based on transactions up to mid-quarter; the full estimate, released three to four weeks later, incorporates complete quarter data and may differ from the flash figure.
Why did CCR prices rise so sharply in Q2 2026?
The CCR’s 2.0% rebound likely reflects a combination of factors: (1) limited new CCR supply coming to market in Q2 2026, creating upward price pressure on the available stock; (2) renewed demand from Singapore Citizens and PRs upgrading to prime-district condominiums, partially replacing the foreign demand that was curtailed by the 2023 cooling measures; and (3) the delayed effect of earlier GLS site launches around the Orchard / River Valley / Marina Bay corridors. The CCR has historically been more volatile than OCR/RCR — large individual transactions can move the segment average. The full Q2 data release on 24 July 2026 will clarify whether this rebound is broad-based or driven by a handful of high-value transactions.
What is 61,000 units in pipeline mean for future prices?
URA’s announcement that approximately 61,000 private residential units (including executive condominiums) are expected to be completed “in the next few years” represents a substantial supply pipeline. As a reference point, annual demand for private homes in Singapore has typically ranged from 8,000 to 13,000 units per year over the past decade. A pipeline of 61,000 units spread over approximately 5–6 years implies a continued period of elevated completions that is expected to moderate demand-supply imbalances and limit sharp price appreciation. This is a deliberate policy signal from the government: it is committed to keeping supply well ahead of demand to prevent the kind of price spike seen in 2021–2022.
Should I buy now or wait for the full Q2 data on 24 July 2026?
For most buyers, the difference between the flash estimate and the full Q2 data release (on 24 July 2026) will be immaterial to their purchase decision. The flash estimate is generally close to the final figure. Waiting for the full release — if you are ready to buy and have found a suitable property — is unlikely to reveal a dramatically different picture. More meaningful than the index number is individual property pricing relative to comparable transactions, your personal financing capacity, and your long-term holding horizon. The PPI is a broad market average; individual properties in specific locations can diverge significantly from the average.
Is now a good time to invest in Singapore property given this data?
This article does not constitute financial advice. The Q2 2026 data presents a mixed but broadly stable picture: limited overall price growth, elevated supply pipeline, divergent performance across segments. For owner-occupiers, Singapore property remains a significant but generally sound long-term asset — the fundamentals (limited land, stable governance, strong rule of law, robust demand from domestic upgraders) are intact. For investors, the combination of elevated ABSD (for second-property and foreign purchases), 4% SSD on early disposals, moderate rental yields (typically 2.5%–3.5% for private condominiums), and elevated mortgage rates means that the return calculus is tighter than it was in 2019 or 2021. Independent financial advice from a licensed professional is strongly recommended before making any investment property decision.
Related Articles
- ABSD Singapore 2026: Complete Guide to Additional Buyer’s Stamp Duty
- Singapore Property Cooling Measures Timeline 2009–2026
- Seller’s Stamp Duty Singapore 2026: Complete Guide to SSD Rates
- URA GLS: Lorong Puntong/Sin Ming Avenue and Kitchener Link Sites
- Buyer’s Stamp Duty Singapore 2026: BSD Rates, Calculation and Remissions
Disclaimer
This article is for general informational purposes only and does not constitute financial or investment advice. Property market data is sourced from URA press release pr26-51 (1 July 2026) and supplementary URA publications. All analysis and projections are LovelyHomes editorial commentary and should not be relied upon as predictions of future prices or market movements. For authoritative data, refer to www.ura.gov.sg. Before making any property purchase or investment decision, consult a licensed financial adviser and a licensed real estate salesperson registered with the Council for Estate Agencies (CEA).