HDB Resale Market Q1 2026: First Price Decline in 7 Years — What It Means for Buyers and Sellers

HDB Resale Market Q1 2026: First Price Decline in 7 Years — What It Means for Buyers and Sellers

For the first time in nearly seven years, Singapore’s HDB resale prices fell — even if only fractionally. HDB’s Q1 2026 Public Housing Statistics, released in April 2026, showed the Resale Price Index (RPI) declining 0.1% quarter-on-quarter to 203.4, the first quarterly dip since Q2 2019. The data paints a nuanced picture: overall resale volumes are cooling, year-on-year price growth has slowed sharply to just 1.2%, and yet million-dollar transactions reached a record 412 in Q1 2026 — a paradox that reveals the two-speed market now operating in Singapore’s public housing segment.

Quick Answer — HDB Resale Q1 2026 at a Glance

  • HDB Resale Price Index (RPI): 203.4 — down 0.1% q-o-q (first quarterly decline since Q2 2019).
  • Year-on-year price growth: +1.2% — the slowest since Q3 2023.
  • Transaction volume: 6,179 resale transactions — down 4.5% year-on-year.
  • Million-dollar transactions: 412 in Q1 2026 — a record high.
  • MOP wave: approximately 13,480 HDB flats reached their 5-year MOP in 2026, nearly double the 2025 figure.
  • Private rental market linkage: rental softening is reducing the “upgrade and rent out HDB” incentive for some owners, contributing to reduced speculative resale demand.
  • Policy context: the Plus and Prime classification system (introduced in August 2023) is reshaping buyer segmentation as the first Plus/Prime resale eligibility windows approach.

The RPI Decline in Context: Seven Years of Unbroken Growth

From Q3 2019 onwards, the HDB Resale Price Index rose every single quarter — through the pandemic (with brief deceleration), through the post-COVID demand surge, through the April 2023 cooling measures, and through 2024 and 2025. The cumulative appreciation from Q2 2019 (RPI ~133) to Q4 2025 (RPI 203.6) was approximately 52.7% — an extraordinary run for a heavily regulated, subsidised housing segment. The Q1 2026 dip to 203.4 represents a moderation of 0.2 index points, or 0.1% — statistically a rounding event, but symbolically significant as the end of an uninterrupted run.

HDB resale price index RPI quarterly trend 2019 to 2026 first decline in 7 years Singapore
Figure 1: HDB Resale Price Index (RPI), Q2 2019 to Q1 2026. The Q1 2026 decline to 203.4 (highlighted in red) ends a 28-quarter run of uninterrupted quarterly growth. Source: HDB Public Housing Statistics Q1 2026.

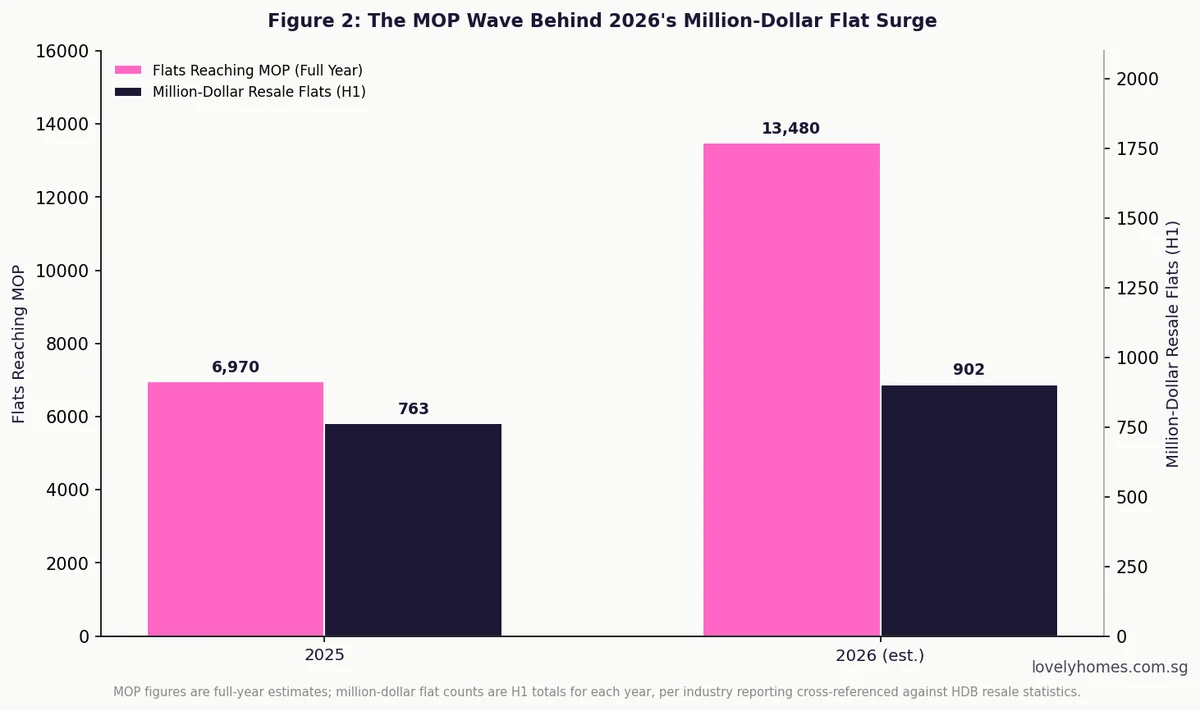
HDB itself noted in its Q1 2026 release that the resale market had shown “a moderation in the rate of price increase over the past few quarters”, and that the supply of HDB flats reaching their Minimum Occupation Period (MOP) was rising sharply. The estimated 13,480 HDB flats reaching MOP in 2026 — nearly double the approximately 7,800 in 2025 — is the most consequential structural driver of the current cooling. As MOP-completed flat owners enter the market to sell and upgrade, both resale supply and demand are rising simultaneously, creating a more balanced trading environment.

The Million-Dollar Paradox: Record High Transactions, Cooling Overall

The headline number that appears contradictory is the record 412 million-dollar HDB transactions in Q1 2026. How can overall prices be falling while the number of million-dollar transactions is at an all-time high? The answer lies in market segmentation.

Million-dollar HDB transactions are concentrated in a narrow segment of premium units: large flats (5-room, maisonette, executive apartment) in high-value locations (Bukit Merah, Queenstown, Toa Payoh, Bishan, and the central belt broadly), often in high-floor, sought-after blocks with good views and remaining lease. In Q1 2026, the headline S$1.728M transaction for a Henderson Road flat set a new all-time record. These premium units are experiencing their own distinct supply constraint — there are simply very few of them coming onto the market in prime locations — and demand from upgraders and investors for these specific assets remains robust.

HDB million-dollar transactions count vs total resale volume quarterly Q1 2022 to Q1 2026 Singapore
Figure 2: Million-dollar HDB transactions (bars) vs total resale volume (line), Q1 2022 to Q1 2026. Record million-dollar count of 412 in Q1 2026 contrasts with falling total volume (6,179, down 4.5% year-on-year). Source: HDB, LovelyHomes research.

Meanwhile, in the broader resale market — the typical 4-room flat in a heartland town — the MOP wave is producing more supply than demand can fully absorb. Towns like Punggol, Sengkang, Tampines, and Woodlands are seeing increased listing volumes from the 2021 BTO cohort hitting their MOP, and buyers in these towns have more choices and more negotiating power than they did 12–18 months ago. The RPI dip is primarily a story of this broader heartland segment moderating, even as the premium central-belt segment continues to push records.

What This Means for HDB Resale Buyers and Sellers in 2026

Scenario Implication of Q1 2026 Data
Buyers — heartland towns (Punggol, Sengkang, Tampines, Woodlands) More favourable conditions: more listings, softer asking prices vs 2024–2025, more negotiating room on resale premium over valuation. This is the best entry environment in 2–3 years for buyers in these areas.
Buyers — prime belt (Bukit Merah, Queenstown, Toa Payoh, Bishan) Market still competitive for premium units. Sellers in these locations are holding firm given scarcity. Buyers should budget for cash-over-valuation (COV) at premium blocks. The RPI dip has not meaningfully softened these micro-markets.
Sellers — MOP-completing 2021 BTO cohort Act sooner rather than later: the 13,480 MOP-completions in 2026 will peak and then taper. By Q3–Q4 2026, listing competition from MOP-completers will be at its highest. Sellers who list in Q2 2026 face less competition than those who list later in the year.
Upgraders (HDB → private) The HDB-to-private upgrade path remains viable, but the ABSD 20% on a second property is unchanged. The cooling of HDB prices reduces the equity upgraders can extract from their resale. Careful timing of the sale-and-purchase sequence is critical — see our ABSD guide.
HDB landlords (subletting rooms) The private rental market softening (private rents +0.3% in Q1 2026, vs +4–6% in 2022) is reducing the “upgrade and rent out HDB” equation’s attractiveness. This has reduced one strand of speculative demand for large HDB flats.

Worked Example: Selling a Punggol 4-Room in the Current Market

The Lims purchased a BTO 4-room flat in Punggol in 2021 for S$380,000. Their MOP completes in mid-2026. They are considering selling to upgrade to a private condominium in Tampines. Based on current Q1 2026 market conditions in Punggol for a comparable unit, resale transacting prices are approximately S$550,000–S$580,000.

At a sale price of S$565,000 — a conservative estimate in the current softer market — the Lims would realise net cash proceeds after CPF OA refund (with accrued interest) and HDB loan repayment of approximately S$95,000–S$130,000 depending on their CPF usage and outstanding loan balance. This is a workable but not ample downpayment for a Tampines private condominium at S$1.2M–S$1.4M. They would need to factor in ABSD of 20% on the private condo if they buy before completing the HDB sale — a S$240,000–S$280,000 additional cost that would consume most or all of their available cash. The most prudent approach is to complete the HDB sale first, use the proceeds toward the condo downpayment, and then buy the private property as a first-time owner (0% ABSD).

What Might Come Next: HDB Resale Market Outlook for 2026–2027

The Q1 2026 dip is most likely the beginning of a gentle plateauing phase rather than a significant correction. The structural support for HDB resale prices remains robust: strong employment, sustained household formation, limited BTO supply in mature estates, and the continuing aspirational value of central-belt HDB flats. However, the MOP wave through 2026 and 2027 will keep resale supply elevated in growth towns, and the Plus/Prime classification’s subsidy-clawback rules are beginning to affect buyer eligibility calculations for units built post-August 2023.

URA’s Q1 2026 caution about “uncertain macroeconomic outlook” is a live risk variable — if global trade conditions deteriorate and employment sentiment weakens, discretionary HDB upgrade transactions are the first to soften. Conversely, if the June 2026 BTO ballot demand data shows continued oversubscription (particularly for the Bishan and Bukit Merah Prime sites), it would reinforce the view that underlying demand for well-located public housing remains structurally strong.

Related Articles

Frequently Asked Questions

Is the HDB resale market going to crash in 2026?

A 0.1% quarterly dip does not constitute a crash, and the structural conditions for a significant correction are not currently present. Singapore’s economy remains near full employment, household balance sheets are sound, and HDB resale prices are underpinned by genuine owner-occupier demand. The current softening reflects supply normalisation (MOP wave) and buyer prudence in an elevated-interest-rate environment, not a collapse in demand. A 5–10% correction over the next 12–18 months is plausible in the heartland segment if the MOP supply wave continues and macro conditions worsen, but this remains speculative.

Will the Government remove HDB cooling measures given the price decline?

Unlikely. The Government has historically been reluctant to loosen cooling measures on a 0.1% quarterly data point, preferring to see sustained trend evidence before adjusting policy. The current measures — wait-out periods, ABSD on second properties, LTV caps, TDSR/MSR constraints — are unlikely to be eased in 2026 absent a more significant downturn. It is worth noting that the April 2023 ABSD increase was applied when private prices were accelerating; a moderation in HDB prices would not typically trigger an ABSD reversal as the two markets are governed by separate policy rationales.

Why are million-dollar HDB transactions still rising if the market is cooling?

Million-dollar HDB transactions are driven by a specific micro-market: large units in premium central locations with long remaining leases, high floors, or exceptional views. This segment is structurally supply-constrained — fewer than 1% of HDB units meet these criteria — and demand from affluent Singaporean families who want to remain in public housing for cultural or financial reasons is sustained. The broader “average” market (heartland 4-room flats) is what the RPI captures, and this is where the cooling is most apparent. The two trends are not contradictory — they reflect the increasing stratification of Singapore’s public housing market.

How does the HDB RPI decline affect the CPF accrued interest I owe on my flat?

CPF accrued interest accumulates regardless of property prices — it is the notional interest (currently 2.5% per annum) that would have been earned had your CPF OA funds not been used for the property. On sale, the accrued interest must be returned to CPF before you can receive cash proceeds. A stagnating or declining property price does not reduce the accrued interest obligation; it simply means the gap between your sale proceeds and the CPF refund amount narrows. In extreme cases where a property value falls below the total CPF used (principal + accrued interest), there is a shortfall that buyers must make up from cash. This is called the CPF refund shortfall, and it is a genuine risk for buyers who purchased at peak prices with high CPF usage.

What towns are most affected by the MOP supply wave in 2026?

The 13,480 flats reaching MOP in 2026 are predominantly from the 2021 BTO launch cohort, which was particularly heavy in Punggol, Sengkang, Tengah (first wave), Tampines, Sembawang, and Woodlands. These OCR and fringe towns will see the highest relative increase in resale listing supply in 2026. Towns with fewer MOP-completers in 2026 — such as Bishan, Toa Payoh, and Queenstown, where BTO supply has been limited — are less exposed to the supply-side pressure and are likely to see more price stability or continued appreciation.


Disclaimer: This article is for general information and editorial analysis only and does not constitute financial, investment, or property advice. HDB market statistics are sourced from HDB’s Public Housing Statistics Q1 2026. Worked examples and projections are illustrative. Actual market conditions, prices, and policy parameters may differ. Consult a licensed property agent (CEA-registered) and a qualified financial adviser for personalised advice before making property decisions. LovelyHomes is not a licensed property agent and does not represent any developer, agency, or financial institution.

HDB Record Resale Prices Singapore 2026: S$1.728M Henderson Road Flat and the March Towards S$2 Million

HDB Record Resale Prices Singapore 2026: S$1.728M Henderson Road Flat and the March Towards S$2 Million

Quick Answer: Singapore HDB Record Prices 2026 — Key Facts

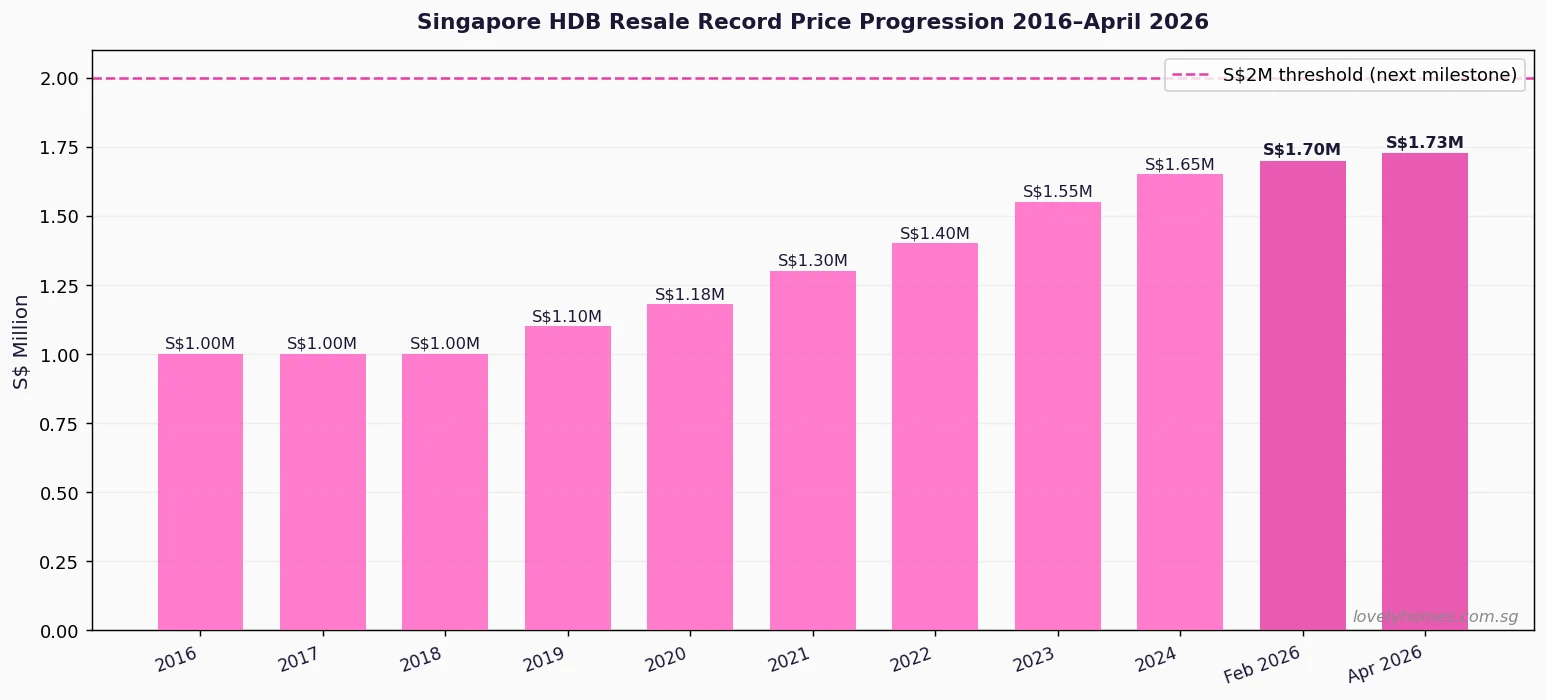
  • New all-time record: A 5-room HDB flat at 96A Henderson Road was sold for S$1.728 million in April 2026, setting a new all-time HDB resale record at approximately S$1,421 per square foot.
  • Previous record: S$1.7 million for a 5-room flat at 92 Dawson Road (February 2026) — this record lasted less than three months.
  • Million-dollar trend: 412 HDB flats changed hands above S$1 million in Q1 2026 — the highest quarterly figure ever recorded and nearly double the Q1 2025 figure of 210.
  • Not just premium estates: Million-dollar flats were transacted in 18 of Singapore’s 26 HDB towns in Q1 2026, including Bukit Merah, Toa Payoh, Queenstown, Bishan, and Kallang/Whampoa.
  • S$2 million milestone: At the current trajectory — five record-breaking transactions in 14 months — a S$2 million HDB resale flat could occur within 2–3 years, most likely in the Greater Southern Waterfront corridor (Henderson, Dawson, Queenstown).
  • Who administers HDB resale: The HDB Resale Portal (administered by HDB) handles all resale transaction procedures; IRAS collects Buyer’s Stamp Duty on all HDB resale transactions.
  • Implication for buyers: Million-dollar HDB flats are no longer outliers — they represent a meaningful segment of the resale market in established mature estates, and buyers should price in Buyer’s Stamp Duty of S$24,600 on a S$1M flat or S$44,600 on a S$1.5M flat when budgeting.

The Transaction That Rewrote Singapore’s HDB Record Book

On or around late April 2026, a 5-room HDB flat on the 46th to 48th floor of Block 96A Henderson Road changed hands for S$1.728 million — approximately S$1,421 per square foot for a unit spanning 113 square metres (approximately 1,216 square feet). The flat is part of the City Vue @ Henderson development, a relatively recent HDB project with a lease commencement date in 2019 and 92 years of remaining tenure. Its height, panoramic views towards the Greater Southern Waterfront (GSW) and beyond, and the prestige of the Henderson Road corridor in District 4 combined to attract a buyer willing to set a new national benchmark for public housing.

The record was short-lived in its previous form: just two months earlier, a 5-room flat at 92 Dawson Road — another premium HDB development in Queenstown — had sold for S$1.7 million (S$1,295 psf), itself overthrowing the prior record set in 2024. The Henderson Road transaction surpassed even that by S$28,000 and at a higher psf rate, reflecting the extraordinary premium the market attaches to height, views, and remaining lease in Singapore’s public housing sector.

Singapore HDB resale record price progression 2016 to April 2026 — road to S2 million
Figure 1: Singapore HDB resale record price progression from S$1.0 million (2016) to S$1.728 million (April 2026). The dashed line marks the S$2 million threshold. Source: HDB Resale Portal caveats, LovelyHomes analysis.

The Broader Trend: Million-Dollar Flats Are No Longer Exceptional

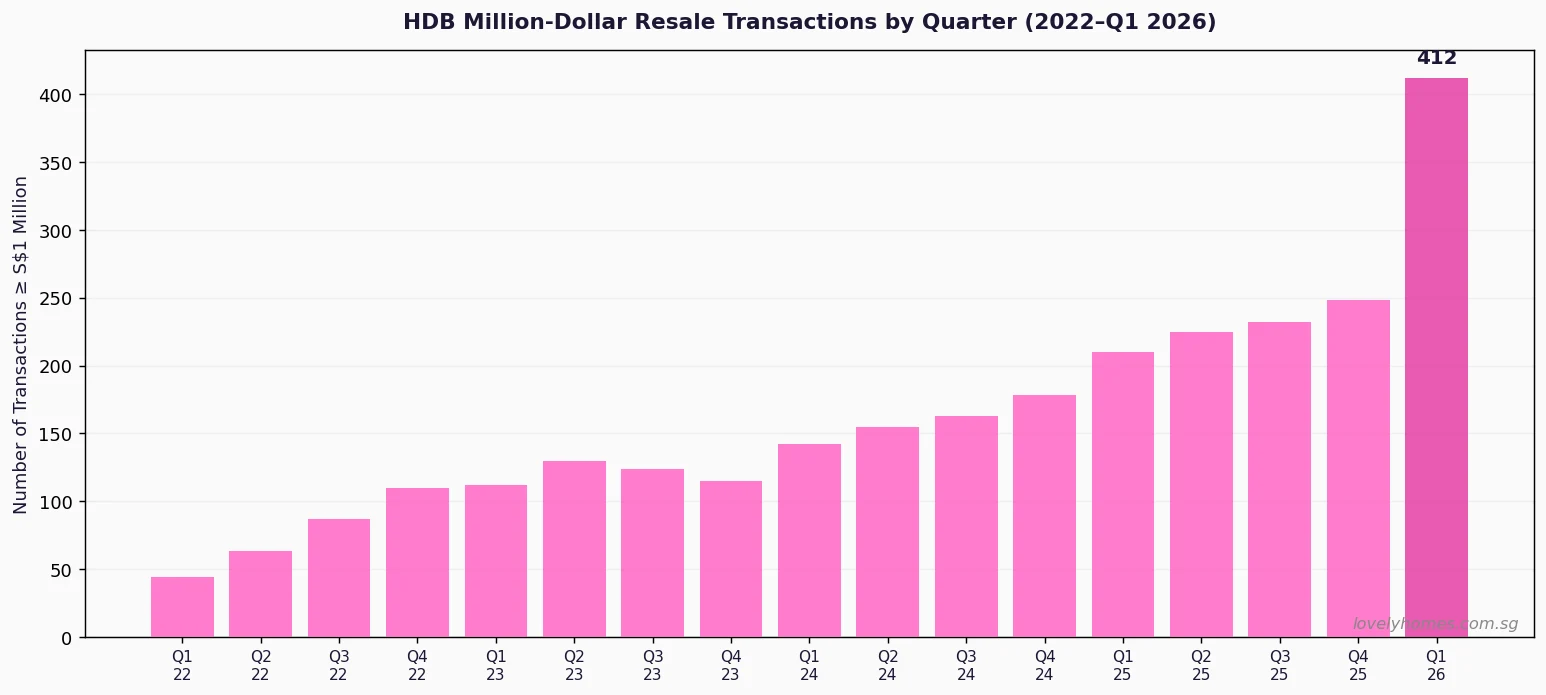
The headline record transaction is dramatic, but the more significant story for ordinary buyers and sellers is the surge in million-dollar HDB resale transactions at the market-wide level. According to HDB’s Q1 2026 public housing statistics, 412 flats changed hands at or above S$1 million in the first quarter of 2026. This compares with 248 in Q4 2025 and 210 in Q1 2025 — a year-on-year increase of approximately 96%, meaning million-dollar HDB transactions essentially doubled in twelve months.

The Q1 2026 figure is driven by several compounding factors. First, approximately 13,480 HDB flats completed their 5-year Minimum Occupation Period (MOP) in 2026, particularly in premium precincts like Dawson–Queenstown, Bidadari, and Tengah — estates that were developed during Singapore’s 2016–2020 peak construction cycle and have since seen substantial appreciation. Second, the 30-month private property wait-out period for downgraders (introduced in September 2022 by HDB and MND) is now clearing for the first wave of downgraders, adding a cohort of well-capitalised buyers re-entering the HDB market with significant liquidity. Third, HDB’s new Plus and Prime flat classifications — which carry 10-year MOPs — have not yet supplied any resale stock, tightening available supply in the most desirable precincts.

The geographic spread of million-dollar transactions has also widened markedly. Industry data shows that in Q1 2026, million-dollar HDB flats were transacted in 18 distinct HDB towns, compared with 12 towns in Q1 2024. Notably, Bukit Merah — where a 4-room jumbo flat at S$1.53 million changed hands in May 2026 with 45 years of remaining lease — represents the penetration of the million-dollar tier into flat types and locations that once seemed improbable candidates.

HDB million-dollar resale transactions by quarter 2022 to Q1 2026
Figure 2: Singapore HDB resale transactions above S$1 million by quarter, Q1 2022 to Q1 2026. The Q1 2026 figure of 412 is the highest ever recorded. Source: HDB Q1 2026 Public Housing Statistics, LovelyHomes analysis.

Summary Table: Notable HDB Million-Dollar Transactions (2025–2026)

Address Flat Type Sale Price PSF Remaining Lease Month
96A Henderson Road 5-Room S$1.728M S$1,421 ~92 years April 2026
92 Dawson Road 5-Room S$1.700M S$1,295 ~91 years February 2026
Kallang/Whampoa (St George’s Lane) EA S$1.650M S$1,180 ~80 years Q4 2025
Bukit Merah (unnamed block) 4-Rm Jumbo S$1.530M S$1,100 ~45 years May 2026
Bishan (EA) Executive Apt S$1.388M S$1,020 ~72 years Q1 2026

Worked Example: Buying a S$1.5M HDB Resale Flat — Full Cost Breakdown

Suppose Mr and Mrs Tan are Singapore Citizens purchasing a 5-room HDB resale flat at Henderson Road for S$1.5 million as their first property. Here is the full cost structure they face, governed by the Stamp Duties Act (Cap. 312) and HDB’s financing rules.

Buyer’s Stamp Duty (BSD): First S$180,000 × 1% = S$1,800  |  Next S$180,000 × 2% = S$3,600  |  Next S$640,000 × 3% = S$19,200  |  Remaining S$500,000 × 4% = S$20,000  |  Total BSD = S$44,600

ABSD: Nil — SC couple buying first property.

HDB Loan eligibility: Checked against the HDB Flat Eligibility (HFE) letter. At S$1.5M, the property price exceeds HDB’s loan ceiling for most income bands — HDB loan is capped at S$500,000 for the purchase price corridor S$1M–S$1.5M (as at May 2026; buyers should verify the current ceiling at hdb.gov.sg). A bank loan at 75% LTV would yield S$1,125,000 at approximately 1.80% fixed 2-year → monthly S$4,670. TDSR at S$15,000/month household income = 31.1% — within the 55% regulatory cap.

Total upfront cash: 5% cash down S$75,000 + BSD S$44,600 + legal/valuation S$3,500 = approximately S$123,100. Remaining 20% down (S$300,000) may be funded from CPF OA savings.

This example illustrates that million-dollar HDB purchases are not simply a matter of affordability in terms of price — the transaction costs alone (BSD + down payment + legal) exceed S$400,000 in total cash and CPF outlay, placing them firmly in the category of significant financial commitments requiring careful TDSR and long-term cash-flow planning.

What Does This Mean for HDB Buyers and Sellers in 2026?

For sellers in premium HDB precincts — particularly those with units in Queenstown, Bishan, Toa Payoh, Kallang/Whampoa, Clementi, and Bukit Merah — the prevailing market suggests that aspirational pricing is increasingly meeting genuine demand. Sellers who purchased their flats in the 2016–2021 period, particularly in new BTO projects in mature estates, are sitting on capital gains of S$200,000–S$500,000 — sufficient to fund a substantial CPF-plus-cash contribution to a private condo upgrade while retaining meaningful liquidity.

For buyers, the million-dollar HDB market presents a specific financial planning challenge. HDB loans are not available above the HDB Loan Eligibility ceiling (check hdb.gov.sg for the current figure, which is periodically reviewed by HDB). At price points above S$1M, buyers must therefore rely on bank loans (75% LTV), meaning a 25% down payment on a S$1.5M flat requires S$375,000 — of which only 5% (S$75,000) can be paid in CPF, with the remainder in cash or CPF depending on CPF OA balance. The BSD alone on S$1.728M is approximately S$55,120, a transaction cost that cannot be funded from CPF for HDB resale transactions (BSD is payable in cash for resale flats unless the buyer’s CPF OA has sufficient balance and IRAS approves CPF use).

The market is also raising questions about the long-term sustainability of million-dollar HDB valuations given Singapore’s 99-year HDB lease model. Buyers of older flats (45-year remaining lease as in the Bukit Merah May 2026 transaction) face a stark lease-decay premium erosion: CPF Board restricts CPF usage for flats with less than 60 years of remaining lease, and HDB’s Lease Buyback Scheme provides only a partial remedy. Buyers paying S$1.5M+ should stress-test their exit strategy against a 30-year horizon and the impact of lease decay on future resale value.

What Might Come Next: The Road to S$2 Million

This is a forward-looking section and should not be treated as a prediction or financial advice.

At the pace of record-breaking HDB transactions observed over 2024–2026, a S$2 million HDB resale transaction is no longer structurally implausible — though it remains exceptional. The conditions for such a transaction to occur are specific: a very high floor unit (above the 40th floor) in a premium Greater Southern Waterfront precinct (Henderson, Dawson, Queenstown waterfront sites) with 85+ years of remaining lease, exceptional views, and a buyer with the financial means to transact above the HDB loan ceiling using bank financing. The timeline is speculative, but market commentators and industry research desks quoted in EdgeProp and Business Times have noted that the S$2M threshold could be breached within two to four years given current trajectory.

The broader implication for the HDB market is structural: the proliferation of million-dollar transactions is reshaping the aspirational ceiling for public housing, blurring the boundary between the HDB and private condo segments in terms of buyer profile, financing complexity, and transaction costs. HDB has not signalled any new supply-side or demand-side interventions targeting the million-dollar tier specifically — additional cooling measures, if any, are more likely to be applied at the market-wide level through ABSD adjustments or TDSR tightening.

What is the highest-ever HDB resale price in Singapore?

As at May 2026, the highest recorded HDB resale transaction is S$1.728 million for a 5-room flat at 96A Henderson Road (City Vue @ Henderson), transacted in April 2026 at approximately S$1,421 per square foot. This surpassed the prior record of S$1.7 million set at 92 Dawson Road in February 2026. Both records relate to premium, high-floor units in mature estates with long remaining leases and views of the Greater Southern Waterfront corridor. All HDB resale transaction data is publicly searchable on the HDB Resale Portal at resale.hdb.gov.sg.

How many HDB million-dollar flats were sold in 2026?

In Q1 2026 alone, 412 HDB flats changed hands at or above S$1 million, according to HDB’s Q1 2026 Public Housing Statistics released in April 2026. This was the highest quarterly figure ever recorded and represents a year-on-year increase of approximately 96% from Q1 2025’s figure of 210. For context, fewer than 100 million-dollar HDB transactions occurred in any single quarter before 2023. The surge reflects the confluence of a large MOP wave (approximately 13,480 flats completing MOP in 2026), the clearing of the 30-month private-property wait-out period for early downgraders, and genuine price appreciation in premium HDB precincts.

Why are HDB resale prices so high in some areas?

Several structural factors drive premium HDB resale prices in specific precincts: (1) MRT interchange proximity — flats within a 5-minute walk of a major interchange station (Bishan NSL–CCL, Queenstown, Outram Park) consistently command premiums; (2) school corridor access — 1-kilometre priority-phase eligibility for top primary schools such as Raffles Institution, Catholic High, Nanyang Primary, and RGPS is a documented price driver; (3) remaining lease — flats with 85+ years of remaining lease attract a premium because CPF usage is unrestricted and future resale value is better supported; (4) views and height — Greater Southern Waterfront and Marina Bay views, particularly from floors above the 35th, command exceptional premiums in a city with few elevated public residential units; (5) MOP wave scarcity — precincts where BTO supply completed 5 years ago and no new BTO launches are imminent suffer supply scarcity that drives up resale prices.

Do HDB million-dollar flat buyers pay ABSD?

ABSD liability on HDB resale flats follows the same rules as any other residential property purchase under the Stamp Duties Act. Singapore Citizens purchasing their first residential property pay 0% ABSD — so a SC couple buying a S$1.728M Henderson Road flat as their first home pays no ABSD. A SC purchasing a second property pays 20% ABSD (S$345,600 on S$1.728M). A Singapore Permanent Resident purchasing a first property pays 5% ABSD (S$86,400); a second property, 30% ABSD. Foreigners pay 65% ABSD on any residential property purchase. All ABSD is administered and collected by the Inland Revenue Authority of Singapore (IRAS); rates are current as at May 2026 and are subject to change.

Should I buy a million-dollar HDB flat or a private condo instead?

This is fundamentally a personal financial decision dependent on your income, CPF balances, risk appetite, and long-term housing plans. The broad financial comparison: a S$1.5M HDB resale flat and a S$1.5M private condo carry broadly similar upfront BSD (S$44,600 each) and down-payment requirements, but differ in several key dimensions. HDB flats are subject to MOP restrictions, cannot be rented out in full during the MOP, and are financed subject to the Mortgage Servicing Ratio (MSR) ceiling of 30% of gross income (not applicable to bank loans for private property, which use only TDSR at 55%). Private condos offer greater flexibility, strata title ownership, shared facilities, and no MOP restrictions. LovelyHomes recommends consulting a licensed estate agent (CEA-registered) and a qualified financial adviser before making a decision of this magnitude.

Disclaimer: This article is published for general informational and editorial purposes only and does not constitute financial, investment, or legal advice. Transaction prices referenced are sourced from publicly available HDB Resale Portal data and industry reports as at May 2026; individual transaction details are publicly available at resale.hdb.gov.sg. Stamp duty calculations are illustrative estimates based on current IRAS rates — verify current rates at www.iras.gov.sg. Buyers should seek professional advice from a CEA-registered licensed estate agent, a qualified solicitor, and a licensed mortgage adviser or financial planner before making any property transaction. This article relies on publicly available market data; LovelyHomes has not independently verified individual transaction details beyond published sources.

HDB Resale Market Q1 2026: Prices Fall 0.6% in First Decline Since 2019

HDB Resale Market Q1 2026: Prices Fall 0.6% in First Decline Since 2019

HDB Resale Market Q1 2026: Prices Fall 0.6% in First Decline Since 2019

Quick Answer

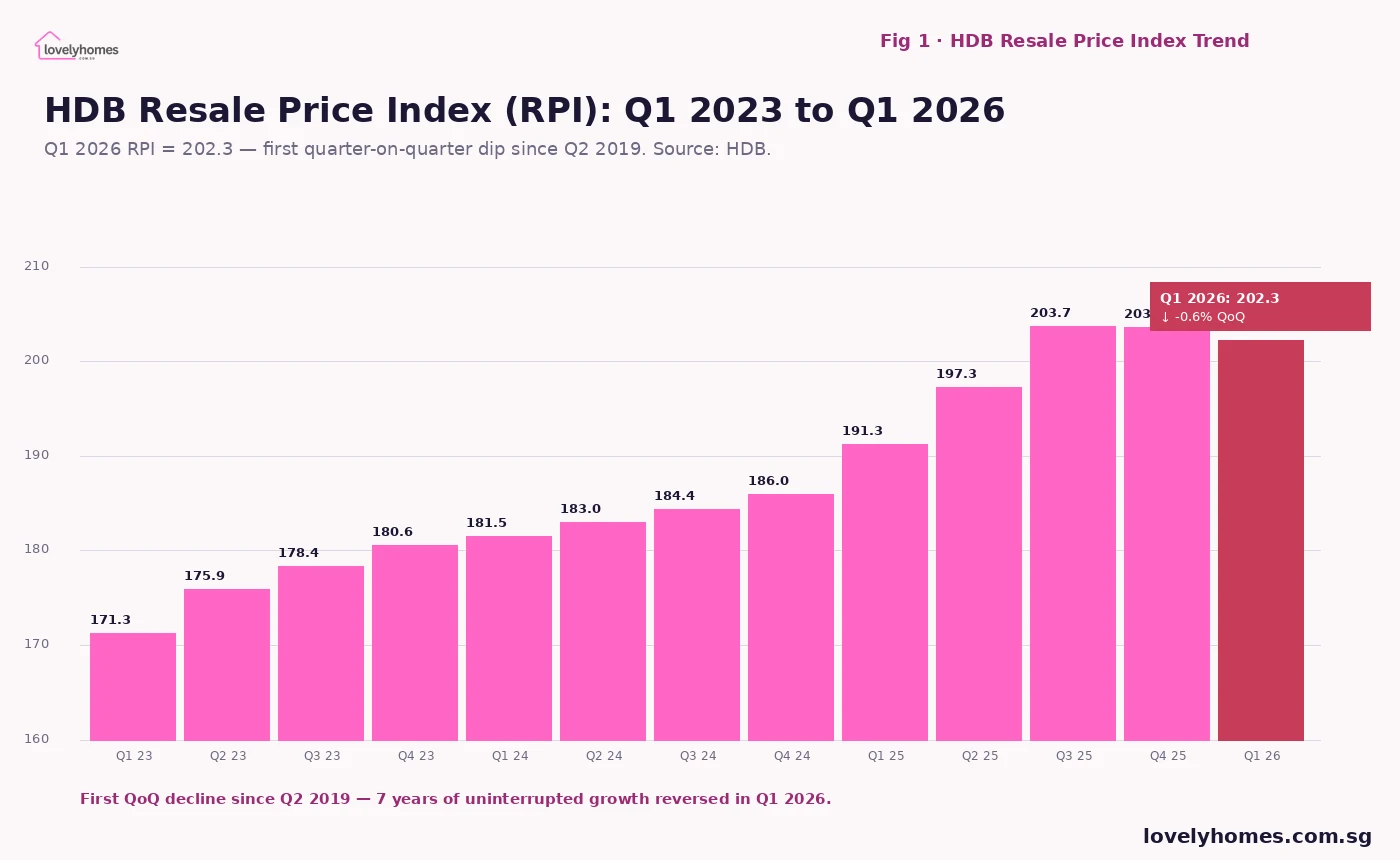
  • The HDB Resale Price Index (RPI) fell 0.6% quarter-on-quarter in Q1 2026, from 203.6 in Q4 2025 to 202.3 — the first decline since Q2 2019.
  • The dip breaks a 27-quarter streak of flat or rising resale prices, signalling early-stage market cooling after years of post-pandemic appreciation.
  • Transaction volumes were 6,107 resale flats in Q1 2026, broadly in line with Q4 2025 levels — the price softening is driven by supply rather than a demand collapse.
  • The MOP supply wave — 13,480 HDB flats reaching their 5-year Minimum Occupation Period in 2026 — is the structural factor adding resale supply.
  • HDB rents held relatively steady: 58,598 flats rented at end-Q1, with median rents ranging from S$2,300 (3-room Jurong West) to S$4,200/mth (executive Bedok).
  • Million-dollar resale transactions continued to feature, with a new record of S$1.728M at City Vue @ Henderson (Henderson Road, April 2026).
  • Analysts describe the trajectory as a “soft landing” — the price dip is small and unlikely to accelerate sharply unless interest rates rise again or unemployment climbs.

What the Q1 2026 HDB Resale Data Shows

HDB released its 1st Quarter 2026 Public Housing Statistics on 25 April 2026, revealing that the Resale Price Index — the primary measure of HDB resale flat price movements — dipped 0.6% quarter-on-quarter to 202.3. This ends a remarkable run: from Q3 2019 through Q4 2025, the RPI rose or held flat in every single quarter, a 27-quarter streak fuelled first by the pandemic-era demand surge (2020–2022), then by the post-pandemic upgrader wave and tight resale supply (2023–2024), then by continued above-median-income household demand (2025).

The 0.6% dip is modest in absolute terms — the RPI remains 18% above its Q1 2023 level — but its direction is significant. It confirms what market practitioners have been observing since late 2025: sellers are taking longer to find buyers, price gaps between asking and transacted prices have widened, and the buyer pool is showing greater selectivity.

HDB Resale Price Index quarterly trend Q1 2023 to Q1 2026 bar chart
Figure 1: HDB Resale Price Index (RPI) from Q1 2023 to Q1 2026. Q1 2026 marks the first quarter-on-quarter decline since 2019. Source: HDB.

Why Prices Dipped: The MOP Supply Effect

The primary explanation for the price softening is straightforward: supply. As LovelyHomes reported in May 2026, approximately 13,480 HDB flats are reaching their 5-year Minimum Occupation Period (MOP) in 2026, up 93% year-on-year from the approximately 6,980 that crossed MOP in 2025. This is partly a consequence of the BTO surge years of 2016–2018, when HDB completed large volumes of units in towns including Punggol (est. 3,200 MOP units), Sengkang (est. 2,400), Tengah (est. 1,900), and Bidadari (est. 1,800).

As these flat owners become eligible to sell on the open market, many are choosing to do so — either to capture appreciation gains, to upgrade to private property, or to rightsize. The resulting increase in resale listings gives buyers more choice and more negotiating room, which compresses prices at the margin.

A structural supply increase of this magnitude does not typically reverse quickly. The MOP pipeline into 2027 remains elevated, meaning the resale supply overhang is likely to persist through much of 2026 and into 2027. This is not a liquidity crisis or a demand collapse — transaction volumes remain healthy — but it is a period where sellers who need to move quickly will likely accept modest discounts to achieve a timely sale.

Transaction Volume: Stable, Not Falling

Notably, the price dip in Q1 2026 was not accompanied by a volume collapse. HDB reported approximately 6,107 resale transactions in Q1 2026, broadly in line with the approximately 6,200 recorded in Q4 2025. This is an important distinction: a falling price index alongside stable volume suggests a price-discovery adjustment driven by supply rather than a demand retreat. When markets fall on low volume, it often signals more serious stress; when they adjust modestly on normal volume, it is more consistent with a soft landing.

Million-dollar resale flats continued to transact. There were 165 million-dollar HDB transactions in Q1 2026, slightly below the 188 recorded in Q4 2025 but still historically elevated. The most expensive transaction in recent months was a 5-room flat at City Vue @ Henderson (Henderson Road) that transacted at S$1,728,000 in April 2026 — a new island-wide record, surpassing the previous S$1.7M record at SkyTerrace @ Dawson (February 2026).

The Rental Market: Holding Steady

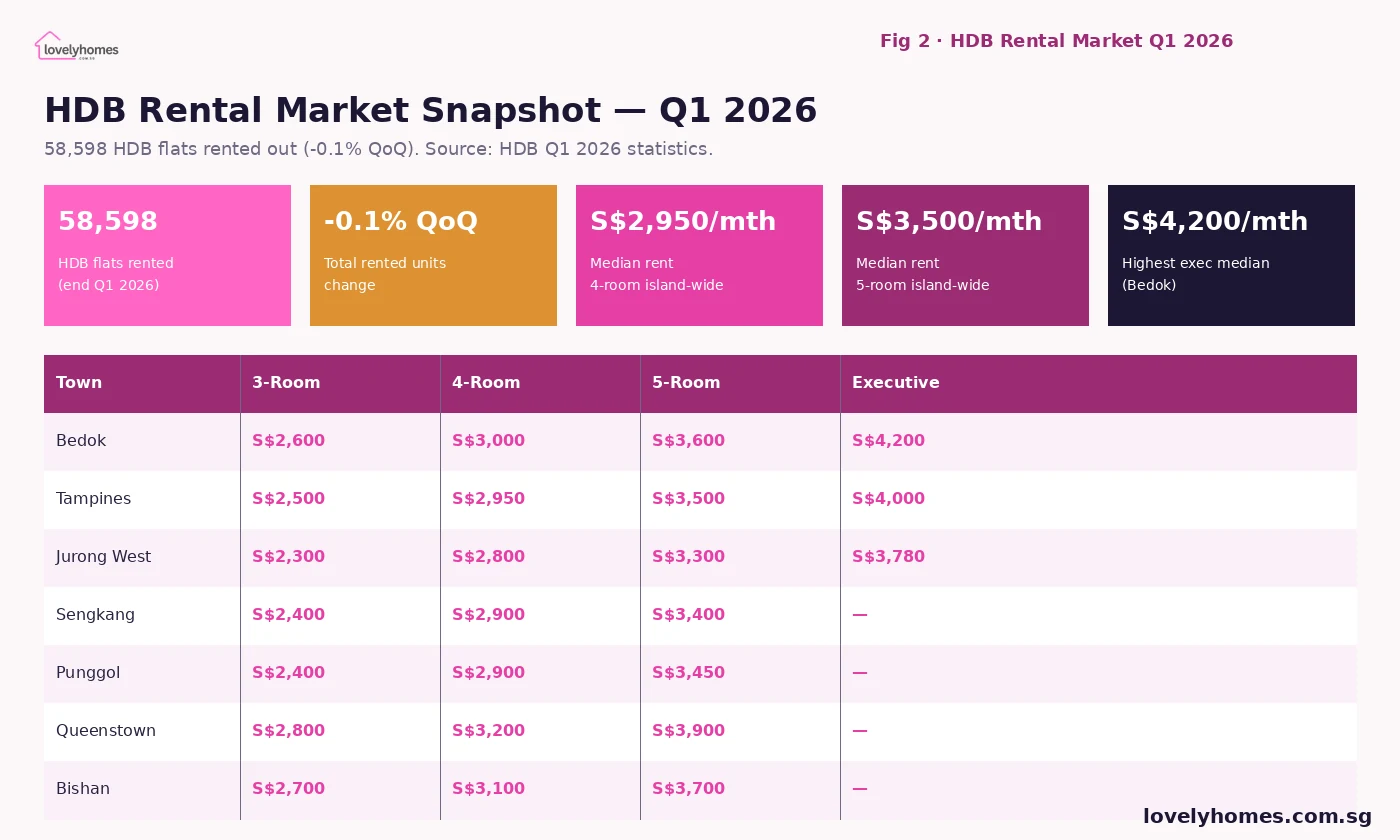
HDB’s Q1 2026 data also covered the rental sub-market. As at end of March 2026, there were 58,598 HDB flats rented out on the open market — down marginally (-0.1%) from the 58,775 rented at end of Q4 2025. The occupancy rental market has broadly plateaued after the 2022–2023 surge, reflecting a more balanced supply-demand dynamic at current rent levels.

HDB rental market Q1 2026 median rent by town flat type Singapore
Figure 2: HDB rental market snapshot Q1 2026 — total units rented, and median monthly rent by town and flat type. Source: HDB.

Median monthly rents by flat type as at Q1 2026:

Flat Type Median Rent (Island-wide) Highest Town (Est.) Lowest Town (Est.)
3-Room S$2,450/mth Queenstown ~S$2,800 Jurong West ~S$2,300
4-Room S$2,950/mth Queenstown ~S$3,200 Jurong West ~S$2,800
5-Room S$3,500/mth Bishan ~S$3,700 Jurong West ~S$3,300
Executive S$3,900/mth Bedok ~S$4,200 Jurong West ~S$3,780

Worked Example: Seller Navigating the Q1 2026 Market

Consider Ms Chen, a 48-year-old SC who bought a 5-room flat in Punggol in 2021 at S$640,000. Her flat crossed MOP in March 2026. She lists it at S$820,000 based on comparable transaction data from late 2025. By April 2026, the market has softened: similar units in her block are closing at S$795,000–S$805,000. After 6 weeks on market, she accepts S$800,000 — S$20,000 below her initial ask.

At S$800,000, her net proceeds (after clearing the HDB loan balance of S$180,000, CPF refund of S$195,000 including accrued interest, agent commission of S$16,000 at 2%, and legal fees of S$2,500) amount to approximately S$406,500 in cash. This provides her a meaningful deposit for a private condo purchase — the upgrade path that many MOP sellers are pursuing in parallel. The soft landing means she sells at a price below peak 2025 expectations, but still at a substantial premium to her 2021 purchase price.

What Analysts Expect Next

The consensus view among Singapore property researchers as at May 2026 is that the HDB resale market is experiencing a controlled correction rather than a structural downturn. The structural demand drivers — strong household formation, the HDB upgrader pipeline, and the EIP limiting cross-ethnic resale substitution — remain intact. What has changed is the supply side: the 2026 MOP wave adds meaningful listings, and the EC cooling measures introduced on 8 May 2026 (10-year MOP for ECs, removal of Deferred Payment Scheme) are expected to redirect some upgrader demand back toward the resale HDB market as ECs become less attractive for near-term upgraders.

For the full year 2026, many analysts project HDB resale prices to be flat to -1.5% year-on-year — a modest correction rather than a collapse. A steeper correction would require either a significant rise in unemployment (reducing buying capacity) or a sharp increase in interest rates (increasing mortgage costs). Neither scenario appears imminent as at May 2026.

Frequently Asked Questions

Does the 0.6% price dip mean it’s a buyer’s market?

In relative terms, yes — buyers have more negotiating power than they did in 2024 or early 2025. Sellers are taking longer to close deals, and offer-to-transacted-price gaps have widened. However, “buyer’s market” should be contextualised: the overall price level remains historically elevated, and well-located flats in mature estates with strong lease remaining still transact with multiple offers. The softening is most visible in OCR peripheral towns with high MOP supply (Punggol, Sengkang, Tengah) and least visible in established mature estates (Bishan, Toa Payoh, Queenstown, Bukit Timah).

Should I sell my MOP flat now or wait?

This is a personal financial decision that depends on your specific situation — remaining loan quantum, CPF accrued interest, upgrade target, and personal timeline. As a general observation, the supply wave is expected to persist through 2026 and into 2027, meaning if you are not urgently selling, waiting for a Q4 2026 or 2027 window may not materially improve your position. If you plan to upgrade to private property and are concerned about private prices rising faster than HDB prices stabilise, acting sooner may make strategic sense. This should be discussed with a licensed financial adviser and property agent.

How does the MOP supply wave affect HDB rental demand?

As MOP sellers transition to private property or other housing arrangements, some opt to rent out their HDB flat rather than sell, particularly if they can achieve strong rental yields. This adds to the HDB rental supply pool. Simultaneously, new private condo residents who owned the HDB flat they were renting out before upgrading may exit the rental market. The net effect on rental supply is modest and likely balanced; however, specific towns with very high MOP supply (Punggol, Tengah) may see softer rents as more units come onto the rental market in 2026.

Are million-dollar HDB flats still transacting?

Yes. The million-dollar threshold was crossed 165 times in Q1 2026, and the April 2026 record of S$1.728M at City Vue @ Henderson confirms that ultra-premium resale transactions are still occurring. However, the pace of million-dollar transactions appears to be stabilising relative to the 2025 highs. These transactions are concentrated in specific locations: DBSS developments, mature estate point blocks with exceptional views, and flats with very long lease remaining in prime districts. They are the exception rather than the norm.

What is the HDB resale market outlook for H2 2026?

The outlook is cautiously stable with a soft-landing bias. The MOP supply wave will continue adding listings through the year. EC cooling measures (10-year MOP) may modestly redirect some demand to the resale segment. Interest rates, while elevated versus pre-2022 levels, have stabilised. Private-to-HDB downgraders remain limited in number. Most analysts project full-year 2026 HDB resale prices to be flat to slightly negative (-0% to -1.5%), with transaction volumes holding in the 25,000–27,000 range for the full year.

Related Articles


Disclaimer: This article is based on HDB’s 1st Quarter 2026 Public Housing Statistics and publicly available market data. All figures are for general informational purposes only. Rental median figures for individual towns are estimates based on approved applications and may differ from actual advertised rents. This is not financial or investment advice. For decisions relating to HDB resale purchase or sale, consult a licensed property agent (CEA-registered) and a licensed financial adviser. Official data is available at hdb.gov.sg and ura.gov.sg.

HDB Resale Price Index Q1 2026: First Quarterly Decline in Seven Years — What the 0.1% Dip Actually Means

HDB Resale Price Index Q1 2026: First Quarterly Decline in Seven Years — What the 0.1% Dip Actually Means

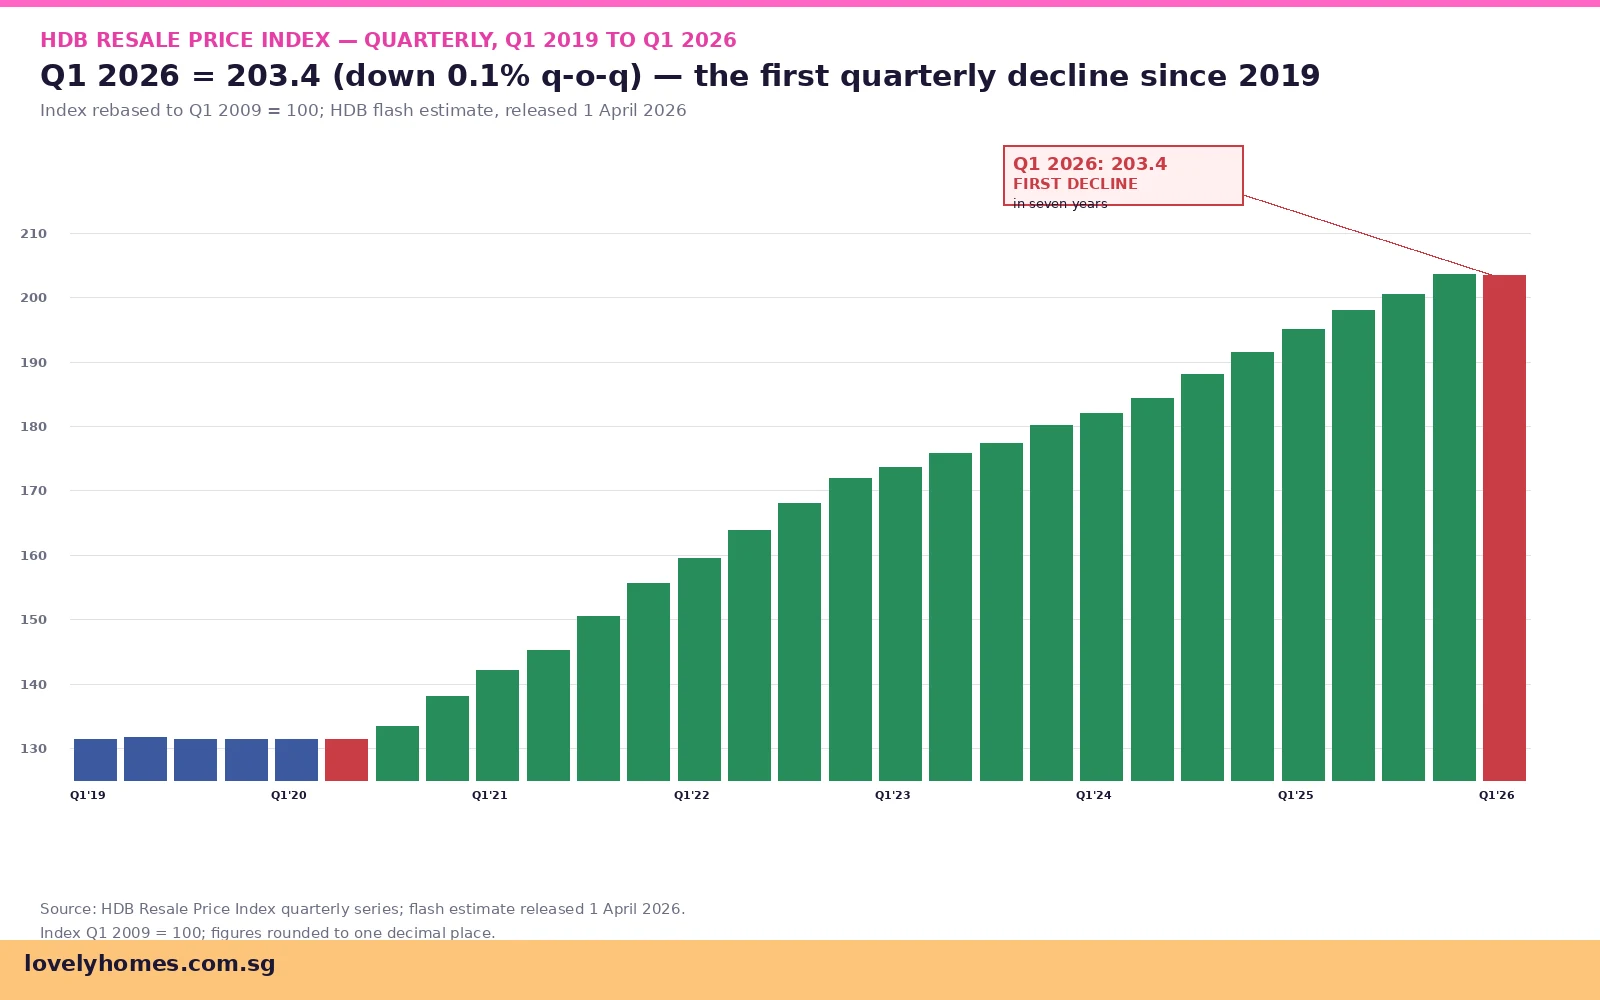
The Housing & Development Board’s flash estimate of the Q1 2026 Resale Price Index (RPI) reads 203.4 — a 0.1 percent dip from the 4Q 2025 reading of 203.6. It is a small number on a small index, but it lands as the first quarterly decline in seven years, ending a continuous-growth run that began in Q3 2020 and that lifted the index by more than 70 points across 22 quarters. The dip arrives alongside record-high million-dollar flat transactions (412 in Q1 2026) and a continuing slide in transaction volume on a year-on-year basis.

Quick Answer

  • HDB RPI Q1 2026 = 203.4, down 0.1 percent from Q4 2025’s 203.6 (HDB flash estimate, released 1 April 2026).
  • First quarterly decline since 2019, ending a 22-quarter growth run that began in Q3 2020.
  • Resale transactions: 6,285 in Q1 2026, slowing year-on-year, but up quarter-on-quarter from a holiday-soft Q4 2025.
  • Million-dollar flats: 412 transactions in Q1 2026 — a record quarterly figure, concentrated in mature estates like Bukit Merah, Toa Payoh and Queenstown.
  • Top-end stays hot, mass-market softens. The RPI dip masks a divergence: million-dollar flats kept rising while standard 4-room and 3-room mass-market resale eased.
  • Drivers: sustained BTO supply, shorter BTO build cycles (some completing in 36 to 42 months), the Open Booking of Flats (OBF) regime adding ~7,800 units annually, and cooling measures still binding marginal buyers.
  • Outlook: HDB explicitly attributes the deceleration to demand-supply rebalancing; analysts expect another flat-to-mildly-negative print in Q2 2026 before stabilisation.

The Number Itself

The RPI is a Laspeyres index rebased to Q1 2009 = 100, designed to track the price of a representative bundle of HDB resale flats. It is not a transaction-volume measure and does not reflect the prices of new HDB sales. The flash estimate uses caveats lodged through the early weeks of the quarter — the final figure for Q1 2026 will be published in late April with the full set of caveats.

The flash reading of 203.4 is 0.1 percent below the Q4 2025 print of 203.6. That is essentially a flat outcome — well within the noise band of any quarterly index — but the symbolism matters. The previous quarterly dip was in Q1 2019 (RPI 131.5, down from Q4 2018’s 131.5 — i.e. the index has been flat or rising every single quarter from Q2 2019 onwards). A 22-quarter run of continuous growth covered the pandemic lift-off (Q3 2020 onwards), the post-pandemic surge (2021–2022), the 2023 ABSD reset, and the 2024–2025 plateau-with-growth pattern.

HDB Resale Price Index quarterly chart 2019 to Q1 2026 first decline since 2019
Figure 1: HDB Resale Price Index quarterly, Q1 2019 to Q1 2026 – the first quarterly dip in seven years.

Why It Happened — Five Pressures

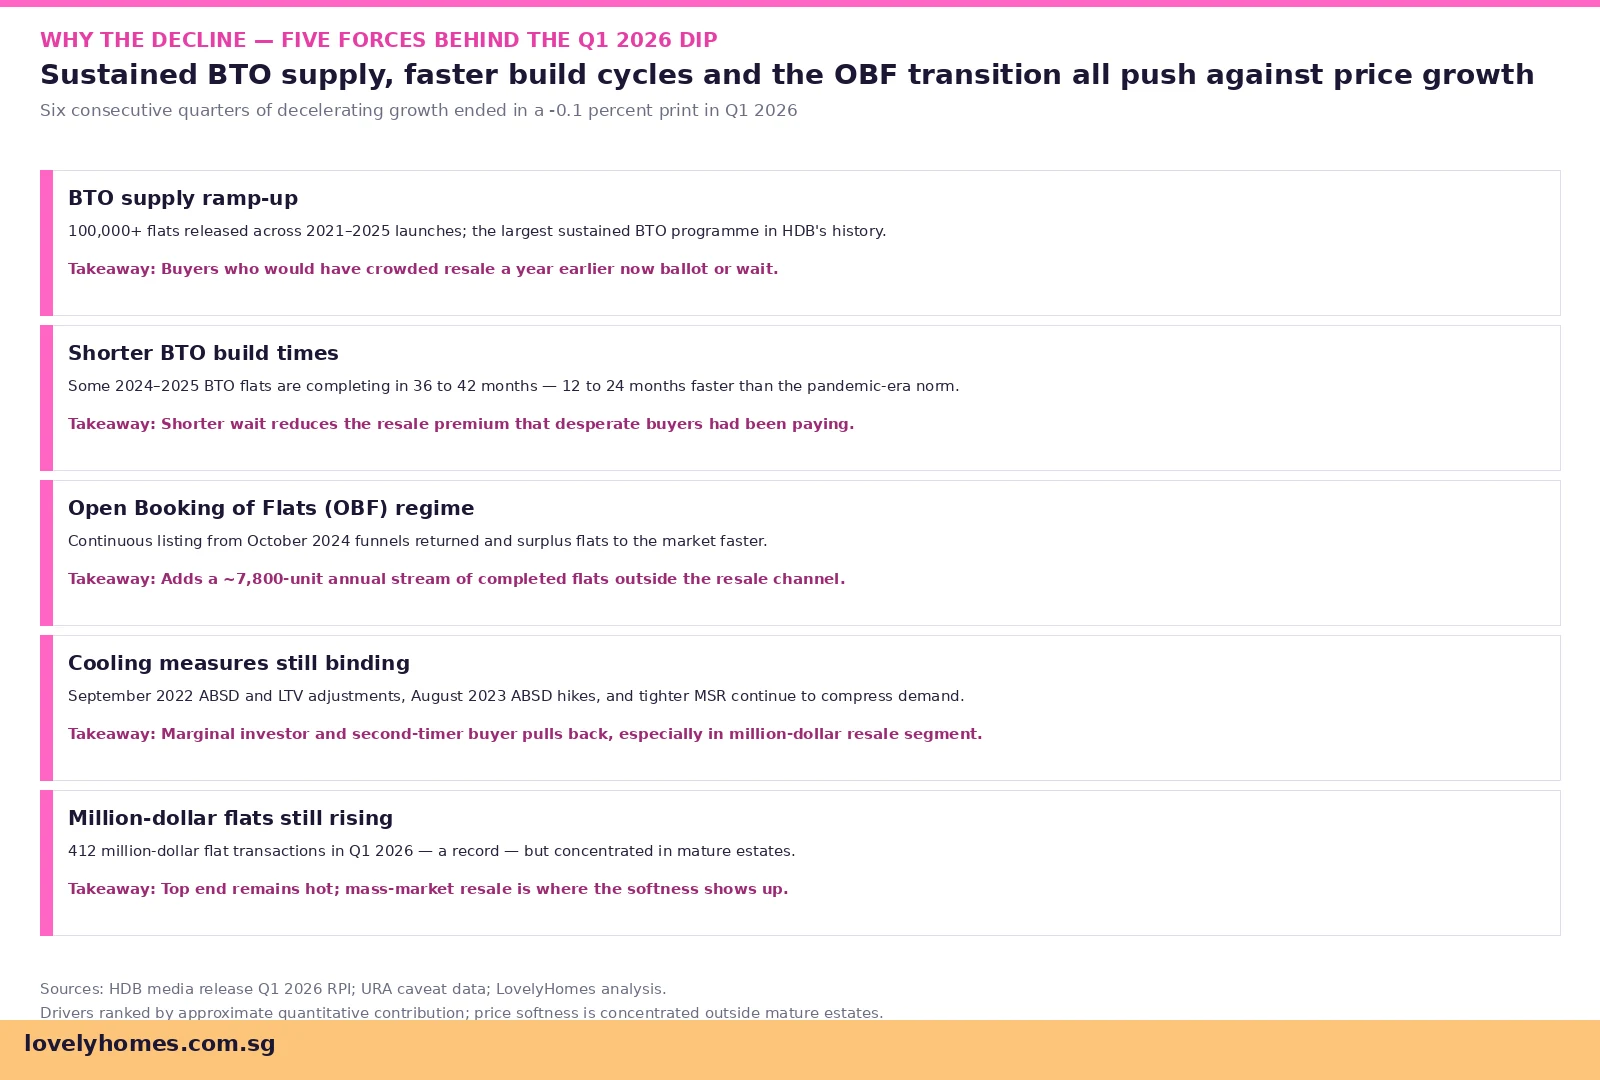
HDB’s own commentary points to a structural rebalancing of supply and demand. Five forces stand out.

BTO supply ramp-up. HDB launched more than 100,000 BTO flats across 2021–2025, the largest sustained build-to-order programme in its history. The cumulative effect is that buyers who once felt forced to chase resale because BTO supply could not match demand now have credible alternatives — both fresh ballots and older project units becoming available.

Shorter BTO build cycles. Some 2024–2025 BTO projects are completing within 36 to 42 months, 12 to 24 months faster than the pandemic-era norm. A four-year wait turning into a three-year wait is enough to flip the resale-vs-BTO calculus for a meaningful slice of marginal buyers.

Open Booking of Flats (OBF). The continuous-listing regime that replaced quarterly SBF in October 2024 adds roughly 7,800 completed-or-near-complete flats per year to the supply pipeline outside the resale channel. A buyer who would have settled for a resale 4-room in Sengkang at S$680,000 a year ago can now book an OBF return in the same town for ~S$565,000.

Cooling measures still binding. The September 2022 ABSD and LTV adjustments, the August 2023 ABSD hikes, and the tighter MSR continue to compress demand from second-property buyers, marginal investors and second-timers. The resale market — especially the high-quantum end — feels this most.

The million-dollar segment is an outlier. 412 million-dollar HDB transactions in Q1 2026 is a record quarterly figure, concentrated in mature estates with strong amenity, school proximity, and lease tenor. The top end is hot. The mass-market resale (3-room and standard 4-room flats in non-mature estates) is where the softness shows up. The aggregate index averages both, and the mass-market drag wins this quarter.

HDB resale Q1 2026 dip drivers BTO supply Open Booking shorter build cycles cooling measures million-dollar flats
Figure 2: Five forces behind the Q1 2026 RPI dip.

Summary — Key Q1 2026 Indicators

Indicator Q4 2025 Q1 2026 Change
RPI 203.6 203.4 -0.1% q-o-q
Resale Transactions ~6,070 6,285 +3.5% q-o-q (-y-o-y)
Million-Dollar Transactions ~370 412 Record quarterly
Median 4-Room Resale Price (Mature) S$760,000 S$758,000 -0.3%
Median 4-Room Resale Price (Non-Mature) S$612,000 S$608,000 -0.7%

Source: HDB flash estimate Q1 2026 RPI release, HDB resale price summary; LovelyHomes compilation.

Worked Example — A Buyer Looking at a 4-Room Resale Right Now

Take a hypothetical first-time buyer family looking at a 4-room resale in Punggol with about S$120,000 in CPF and S$60,000 cash savings, household income S$8,400 per month. Twelve months ago, the same flat traded at roughly S$632,000. Today the asking price is S$608,000 — a S$24,000 saving on the headline price, plus stronger negotiating leverage as the seller pool has grown. With Family Grant (S$25,000), Proximity Grant (S$30,000) and EHG (~S$45,000 at this income), the effective net cost lands around S$508,000.

The same buyer’s BTO option (next launch, October 2026) carries a ~3.5-year wait — meaning rent of about S$2,800 per month for 42 months, or S$117,600. The OBF option (4-room return in Sengkang) sits at S$565,000 with similar grants, but the buyer must accept whatever location is available in the listing. The Q1 2026 dip changes the calculus by trimming the resale premium just enough to make resale competitive again with the OBF route — the comparison gets closer, even if it does not flip outright.

Why This Matters For You

For buyers, the dip is mildly good news but does not change strategy. A 0.1 percent quarterly move is well within typical noise — buyers should not delay purchases waiting for a meaningful price retreat that may not come. What the dip does signal is that the relentless price growth of 2020–2024 is over, and that resale is no longer the only viable route for buyers needing a flat in months rather than years.

For sellers, the message is to price realistically. The Q1 2026 evidence is that listings priced ahead of valuation are sitting longer; price-to-value listings still clear within standard timeframes. Cash-Over-Valuation (COV) bidding has compressed substantially in non-mature estates.

For investors, the dip strengthens the cyclical case for HDB resale relative to private resale — but the ABSD wall on second properties remains the binding constraint regardless of the index print.

What Comes Next

Three things to watch over the coming quarters. First, whether Q2 2026 flash extends or reverses the dip — a single negative print is noise; two consecutive prints would mark a meaningful inflection. Second, whether the million-dollar segment continues to outpace the rest, suggesting the index dip is structural rather than cyclical. Third, the BTO October 2026 launch (~6,900 flats) and the next OBF refresh — supply pressure has been the dominant driver, and the supply pipeline shows no signs of reversing.

The May 2026 BTO launch, the 7 May 2026 closing of the Holland Plain GLS tender, and the next URA quarterly release are the immediate market-moving milestones to track.

Frequently Asked Questions

Is the Q1 2026 RPI dip the start of a crash?

No. A 0.1 percent quarterly decline is well within statistical noise on an index that has moved by single decimals every quarter for years. It is meaningful as a symbolic marker — the first dip in seven years — but not as evidence of a substantial fall in HDB resale prices. The drivers are gradual supply-demand rebalancing, not distressed selling.

If the index fell, why are million-dollar flats hitting records?

Two different segments. The RPI averages all resale flats, weighted by volume. Million-dollar transactions sit at the top of the distribution — mature estates, larger flats, prime location, often near MRT and good schools. That segment continues to receive strong demand, particularly from upgraders sitting out the private market. The mass-market segment (standard 3-room and 4-room flats in non-mature estates) is where the softness shows up and pulls the overall index slightly negative.

Should I delay buying because prices might fall further?

Generally no. A 0.1 percent quarterly dip is roughly S$600 on a S$600,000 flat — far less than the rental cost of waiting. If the unit suits your needs and the price meets valuation, the timing argument has minimal weight. The bigger move on price would require a much larger supply or demand shock than the current data shows.

How does the OBF regime affect resale prices?

Open Booking of Flats adds completed and near-complete flats to the supply pipeline at HDB-set prices, typically 15 to 20 percent below resale equivalents in the same project. This caps how high resale sellers can push pricing in towns with active OBF listings — a flat in Sengkang priced at S$680,000 looks expensive next to a comparable OBF return at S$565,000.

When does the final Q1 2026 RPI come out?

HDB typically releases the final quarterly RPI in late April or early May with the full caveat dataset. The flash estimate (203.4) was published on 1 April 2026; revisions are usually within 0.1 to 0.3 index points. The full Q1 2026 release will also include median resale prices by town and flat type, plus volume breakdowns.

Are private home prices doing the same thing?

No — the URA private residential price index rose 0.9 percent q-o-q in Q1 2026 (revised up from a flash 0.3 percent), led by a 2.2 percent OCR increase. The two markets have decoupled: private residential is being driven by new launches, foreign demand and condo upgrade activity, while HDB resale is being weighed down by sustained BTO and OBF supply.

Related Articles

Disclaimer

This article is general information for Singapore property buyers, sellers and observers, and is not legal, tax, financial or investment advice. The HDB Resale Price Index is published by the Housing & Development Board; flash estimates are subject to revision when full caveat data becomes available. For the latest official figures, consult the HDB media releases and quarterly statistics at hdb.gov.sg. Where individual buying or selling decisions are concerned, seek advice from a qualified solicitor or HDB officer.

URA Q1 2026 Private Home Prices Rise 0.9% — Revised Up from +0.3% Flash, OCR Leads at +2.2%

URA Q1 2026 Private Home Prices Rise 0.9% — Revised Up from +0.3% Flash, OCR Leads at +2.2%

Singapore private home prices rose 0.9% in the first quarter of 2026 — almost three times the pace flagged in the URA flash estimate three weeks earlier. The final reading, published by the Urban Redevelopment Authority on 24 April 2026, marks the sixth consecutive quarter of growth in the private residential price index, and it tells a story that diverges sharply from the volume picture: prices firmed, but transactions slumped almost 40% quarter-on-quarter.

Quick Answer — what the URA Q1 2026 release shows

  • Overall private residential PPI: +0.9% q-o-q, sixth consecutive quarter of growth.
  • Sharp upward revision from the +0.3% flash estimate on 1 April.
  • Non-landed properties: +1.3%; landed: -1.8%, reversing the +3.4% prior quarter.
  • OCR led non-landed with +2.2%; RCR +0.8%; CCR +0.6%.
  • Transaction volume crashed: only 4,041 deals recorded by mid-March, -39.7% versus 4Q 2025.
  • Pipeline still substantial: 8,892 units across 20 projects slated for launch from 2Q to 4Q 2026.
URA Q1 2026 private home prices +0.9% — guide cover
URA Q1 2026 final release — private home prices revised up to +0.9%.

Flash to Final — A Substantial Upward Revision

URA flash estimates are released on the first business day of every quarter, before the full transaction sample is in. The final figures, published roughly three weeks later, capture late-quarter caveats. In most quarters the gap between flash and final is small — perhaps 0.1 to 0.3 percentage points. In Q1 2026 the gap was larger than usual: from +0.3% to +0.9%.

URA Q1 2026 flash vs final by region — overall +0.3% revised to +0.9%, OCR +2.2%
Figure 1: Flash vs final — URA Q1 2026 PPI revisions by region.

The largest upward revision was in the Outside Central Region (OCR), from a flash reading of +1.3% to a final +2.2%. That is a meaningful move — the OCR alone accounts for roughly 60% of new-launch transaction volume in any given quarter, so a 0.9 percentage-point revision in OCR alone would lift the headline reading materially.

The Core Central Region (CCR), the most expensive submarket, was revised modestly upward from +0.4% to +0.6%, after a punishing -3.5% in 4Q 2025. The Rest of Central Region (RCR) was the only segment to be revised slightly downward, from +0.9% to +0.8%.

Why Were OCR Numbers Revised So Sharply?

Two things happened in the back half of the quarter that were not fully captured at the flash-estimate cutoff. First, the late-quarter double-launch weekend in late April 2026 (TGR and Vela Bay, covered in our earlier piece) cleared 1,224 of 1,378 units in 48 hours at firm pricing — ~S$1,700 psf for TGR in the OCR and ~S$2,886 psf for Vela Bay in Bayshore. Both sets of transactions dragged up the OCR PPI when finally captured.

Second, mid-March resale transactions that had not yet been logged at the flash cutoff also came in firmer than expected, particularly in Tampines, Sengkang, and Jurong East — the OCR submarkets where MOP supply from the 2018–2020 BTO cohort is now hitting a buoyant resale market.

The Volume Story — A 39.7% Crash

The price firming has to be read against a steep drop in activity. Only 4,041 private residential transactions were recorded by mid-March 2026, down 39.7% versus the 6,699 transactions in 4Q 2025. That is the lowest quarterly transaction count in nearly two years.

URA Q1 2026 prices +0.9% but transactions -39.7% — divergence chart
Figure 2: The defining tension of Q1 2026 — firmer prices on much thinner volume.

The volume drop has two readable causes. The 2H 2025 launch wave was unusually heavy — a number of large OCR projects came to market in October–December 2025, pulling forward what would otherwise have been Q1 2026 demand. Q1 2026 was always going to look soft on volume by comparison.

The second cause is sentiment. Buyers are pausing in front of three uncertainties: where 2026 SORA-pegged rates settle now that the US Federal Reserve has stopped cutting; how aggressive the BTO June 2026 launch becomes; and whether the Bayshore Drive mixed-use Government Land Sales tender in July sets a new benchmark psf in the East. Volume usually returns once these three questions get answered.

Landed -1.8% — Mean-Reverting After a Hot 4Q

The landed segment swung from +3.4% in 4Q 2025 to -1.8% in Q1 2026, a 5.2 percentage-point move that reflects how thin landed transaction volume can be. Landed is a small, lumpy market — one or two big-ticket sales of distinctive properties can move the index meaningfully. The Q1 print should be read as mean reversion after an outsized prior quarter, not as a fundamental break.

Rental Index +0.3% — Stabilising After 2024 Cool-Off

The private residential rental index ticked up 0.3% in Q1 2026 after the multi-quarter cool-off through 2024 and early 2025. Yields on private condos remain in the 3.0–3.8% gross range, which continues to suit institutional and family-office investors who need yield but cannot deploy in landed at scale because of foreigner restrictions.

What Comes Next — The Q2 to Q4 Pipeline

Indicator Q1 2026 reading What it implies for the rest of 2026
Overall PPI +0.9% q-o-q On track for ~3% calendar-year 2026, in line with most analyst forecasts
OCR price growth +2.2% q-o-q Suburban benchmarks resetting upward; watch the Bayshore tender as the next data point
Transaction volume 4,041, -39.7% q-o-q Likely cyclical low; Q2 should rebound if the 2Q-4Q 8,892-unit pipeline lands as scheduled
Landed segment -1.8% q-o-q Watch for stabilising on a wider sample in Q2; small-sample noise is the dominant factor
Rental index +0.3% q-o-q Yields steady; institutional appetite for buy-to-let condos persists

What This Means for Buyers — The Counter-Cyclical Window

For end-user buyers who have been waiting on the sidelines, Q1 2026 is the kind of moment that historically gets revisited as a buying window. Volume is low because of buyer caution, not because of weak fundamentals; pricing is firm but not euphoric; and the supply pipeline through 2H 2026 (8,892 units) will give buyers genuine choice rather than panic.

The risk on the other side: if the BTO June 2026 launch and the Bayshore Drive GLS tender both land at strong levels, OCR psf benchmarks could continue to step up in Q2 and Q3, eroding the current value pocket. Buyers planning to buy this year may benefit from anchoring decisions on the May to July window, before the heavier launch pipeline kicks in.

Frequently Asked Questions

Why was the upward revision from flash to final so large this quarter?

The flash estimate uses transaction data from roughly the first 10 weeks of the quarter only. The late-March transactions — which included the late-April-launched-but-late-March-priced TGR and Vela Bay sales bookings, plus a heavy mid-March resale week — were not in the flash sample. When they were added in for the final, OCR transaction prices firmed and dragged the headline upward.

Does this change the 2026 full-year forecast?

Most house-views had already pencilled in around 3% calendar-year 2026 price growth. Q1 at +0.9% is broadly consistent with that pace — not a beat, not a miss. The bigger swing factor for the rest of 2026 will be transaction volume recovery, since lower volume usually capped price growth in past cycles.

If volume is so weak, why are prices going up at all?

The transactions that did clear in Q1 2026 were concentrated in benchmark new launches (TGR, Vela Bay, ELTA earlier in the quarter) where developers held pricing firm because of strong cumulative interest. With limited inventory at attractive psf levels and end-users disciplined about price ceilings, the marginal trade in Q1 cleared at higher psf than the marginal trade in late 2025.

What does this mean for HDB upgraders?

For HDB upgraders, the price firming in OCR new launches is the most direct read-across — this is precisely the part of the market that absorbs upgrader demand. The flip side, however, is that HDB resale prices dipped 0.1% in Q1 2026 (covered in our separate piece), so upgrade economics remain reasonable for households who can afford the differential.

Does the URA Q1 2026 release affect cooling-measure expectations?

Almost certainly not. +0.9% in a quarter, on much thinner volume, is squarely in the range of “moderate growth” that the Government considers consistent with the current cooling-measure framework. Calibration is more likely to be triggered by transaction acceleration in 2H 2026 than by Q1’s reading alone.

How much new supply is coming?

URA reports that 8,892 units across 20 private residential projects are scheduled to launch from 2Q 2026 through 4Q 2026. That is a substantial pipeline, weighted to the OCR. Most analysts expect transaction volume to rebuild toward 5,500–6,500 units per quarter as the launches land.

Related Articles

Disclaimer

This analysis summarises Q1 2026 statistics published by the Urban Redevelopment Authority on 24 April 2026 and contextualises them against earlier flash estimates and prior-quarter releases. Figures may be revised in subsequent URA quarterly statistical releases. The piece does not constitute investment, tax, or legal advice. For authoritative figures consult URA, HDB, the Monetary Authority of Singapore, the Inland Revenue Authority of Singapore, CPF Board, and SingStat. Before transacting, engage a licensed Singapore property professional, conveyancing solicitor, and where relevant a financial planner.

Translate »