URA Q2 2026 Flash Estimates: Singapore Private Home Prices Rise +0.5%, CCR Leads as RCR and OCR Soften
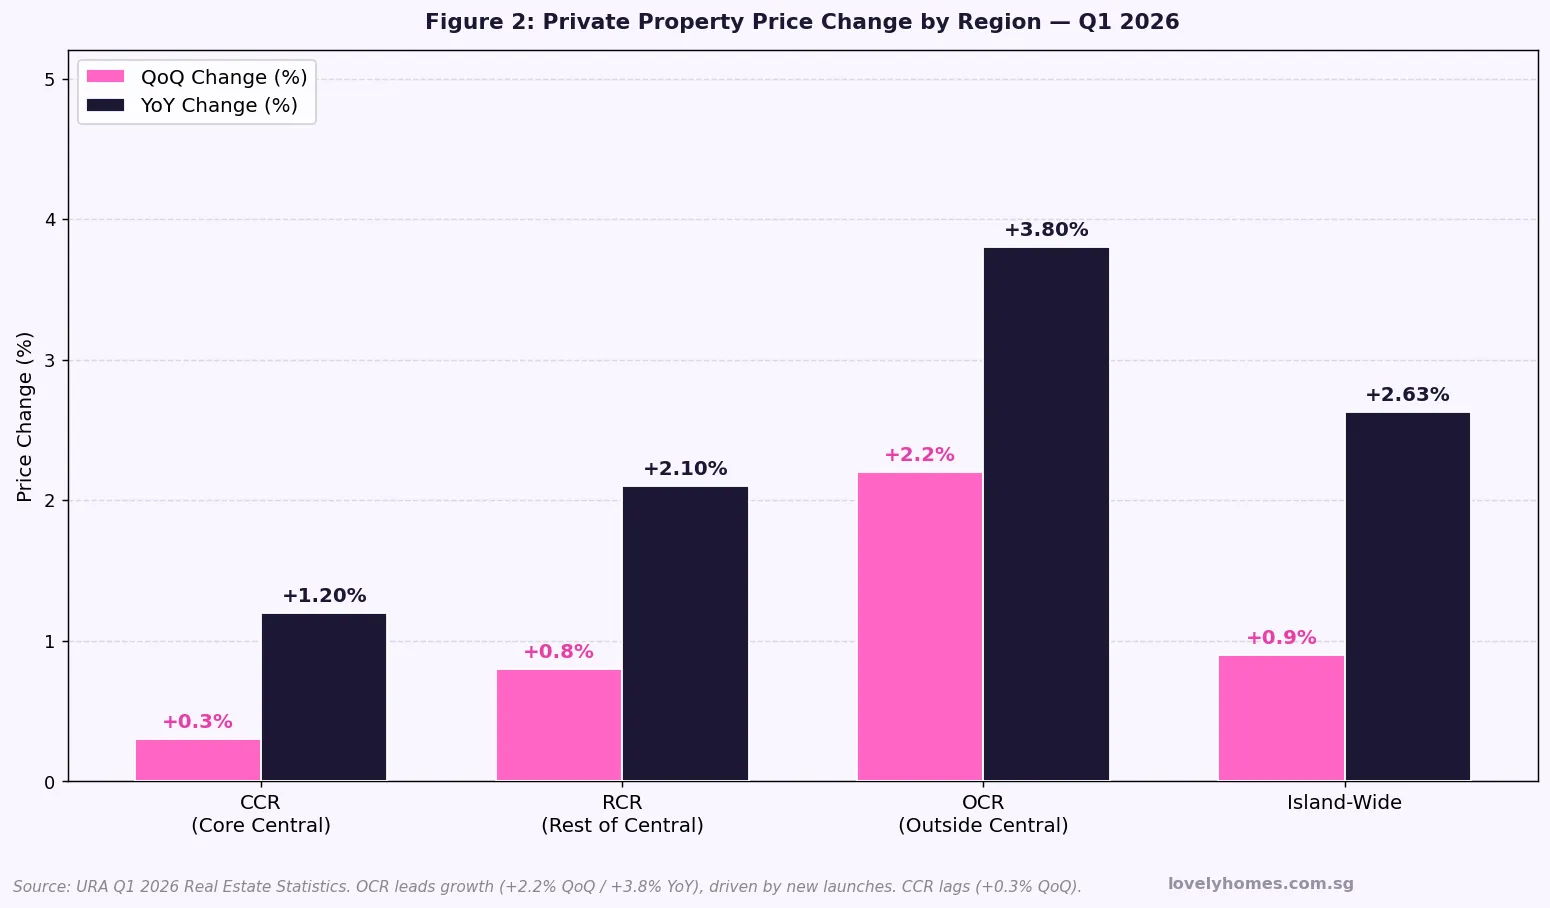
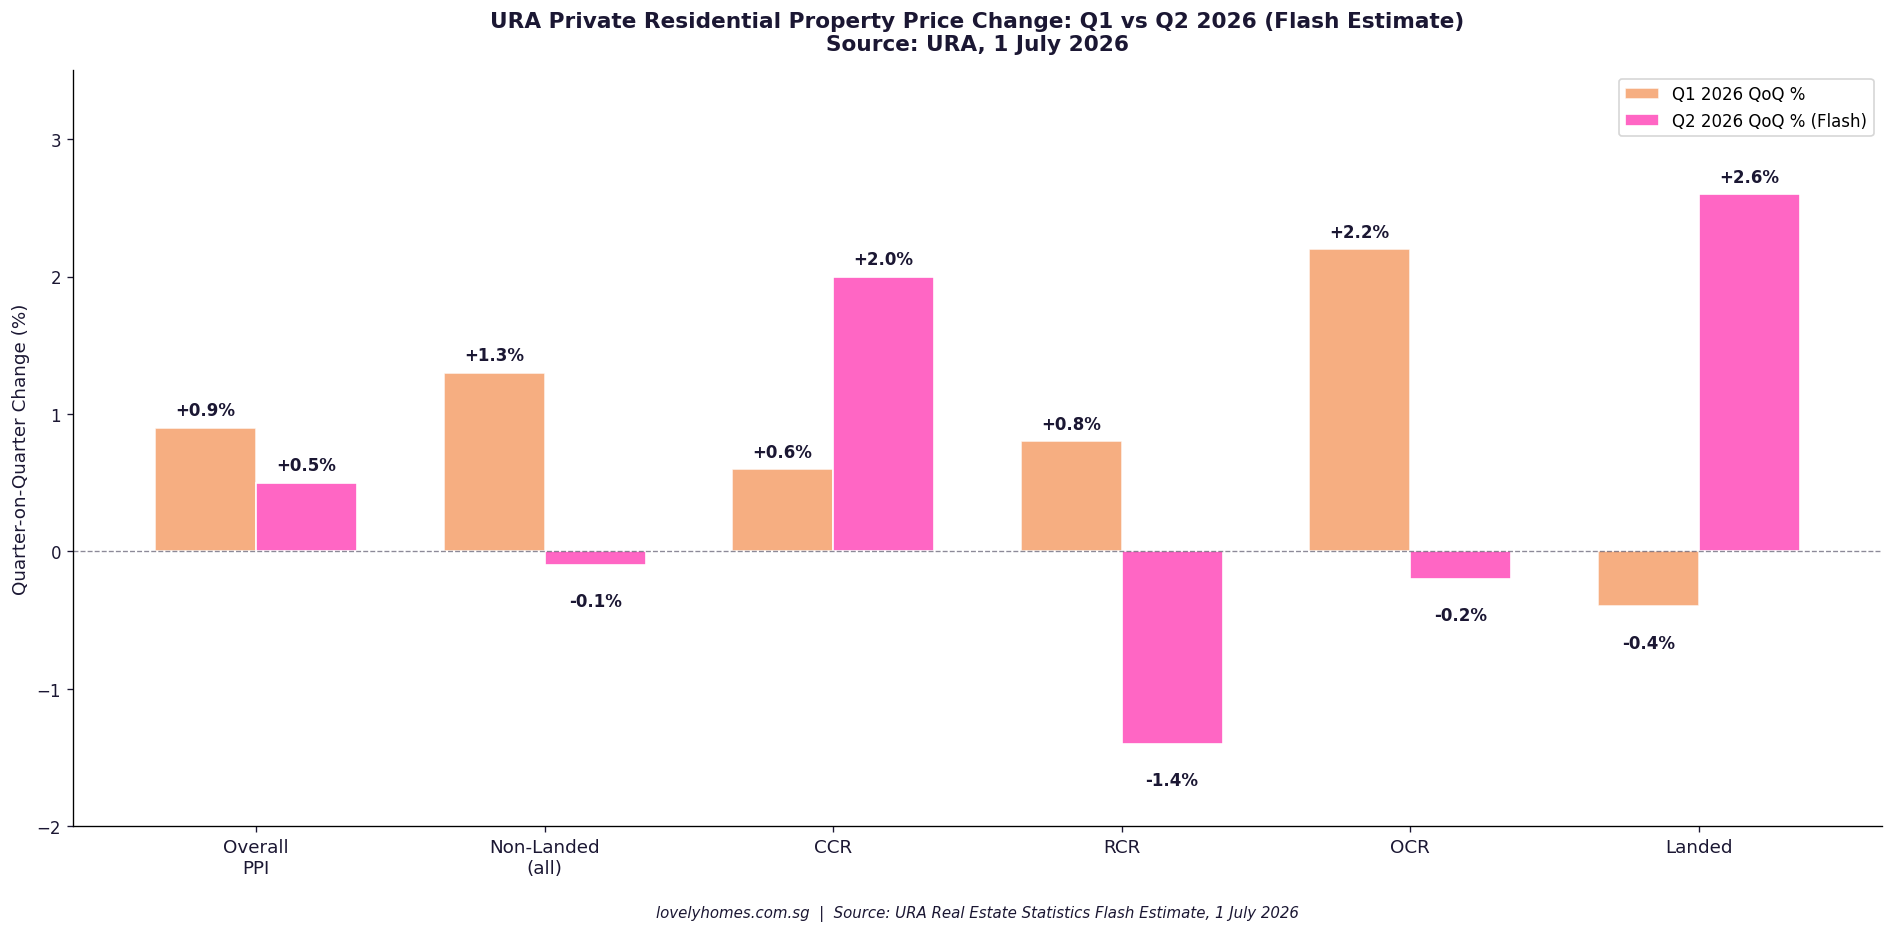
The Urban Redevelopment Authority (URA) released the flash estimate for the private residential property price index for 2nd Quarter 2026 on 1 July 2026. The headline number — a +0.5% quarter-on-quarter (QoQ) increase — represents a notable deceleration from the +0.9% recorded in Q1 2026, and is driven by diverging performances across market segments: the Core Central Region (CCR) surging, while the Rest of Central Region (RCR) and the Outside Central Region (OCR) softened on a quarterly basis.
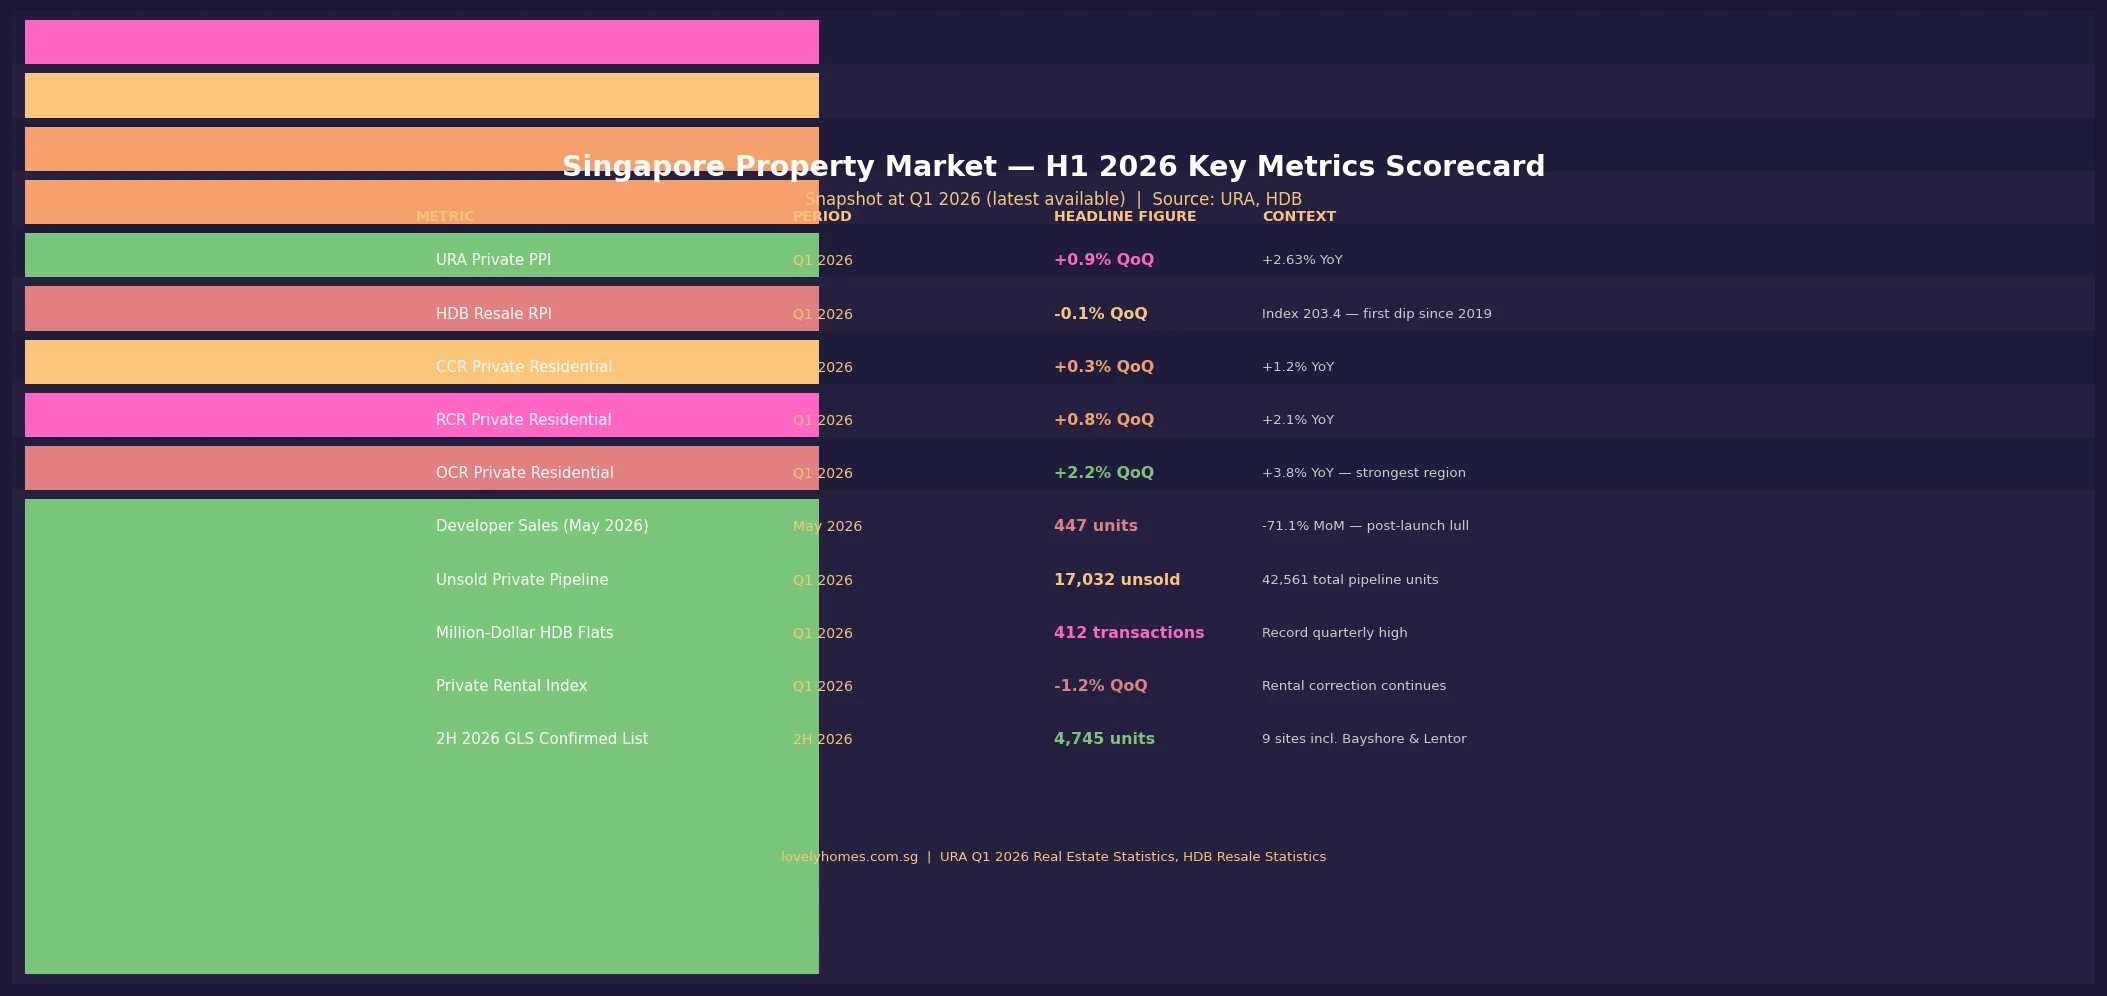
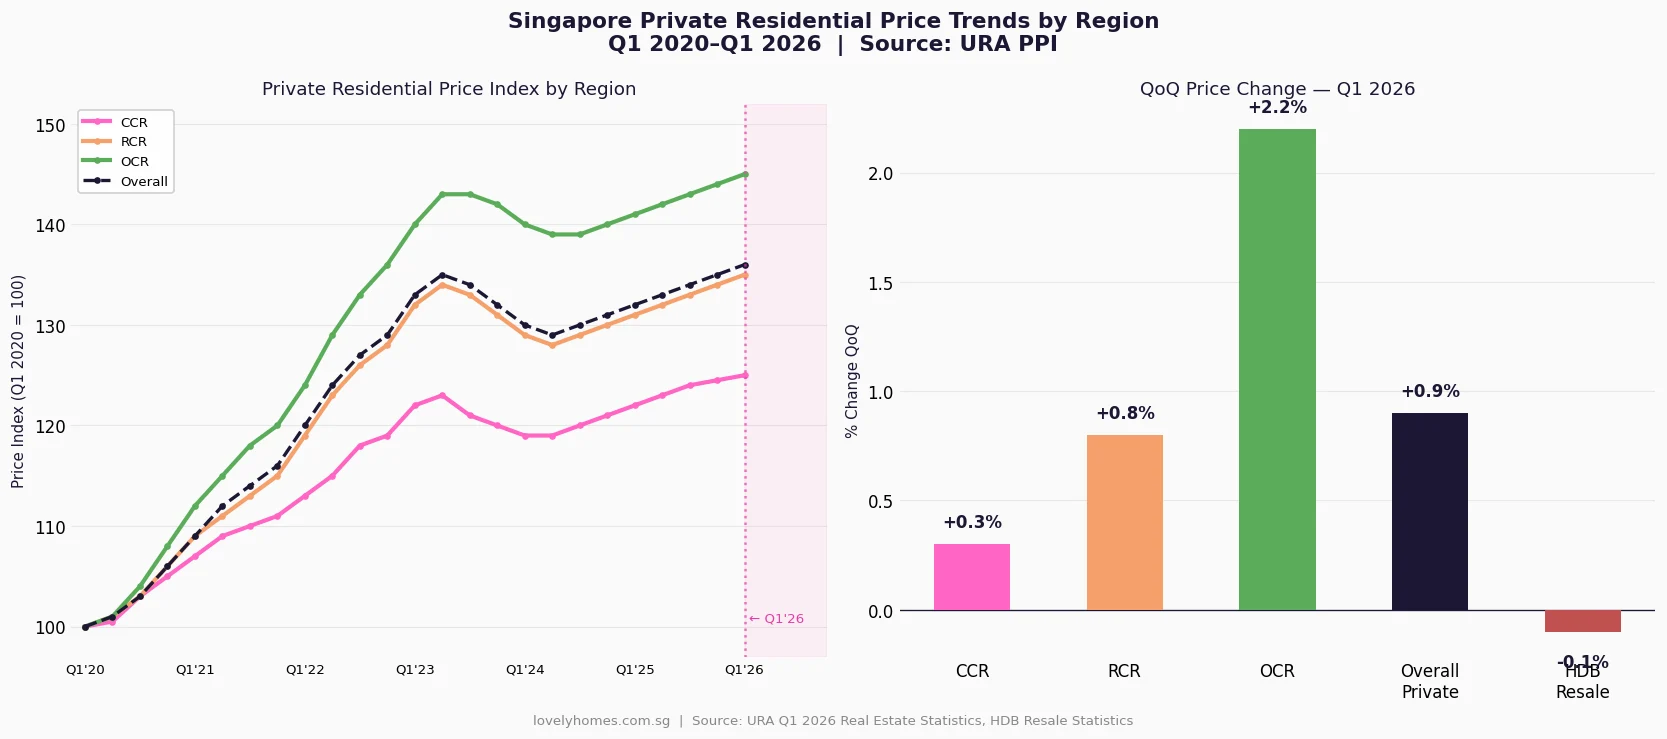
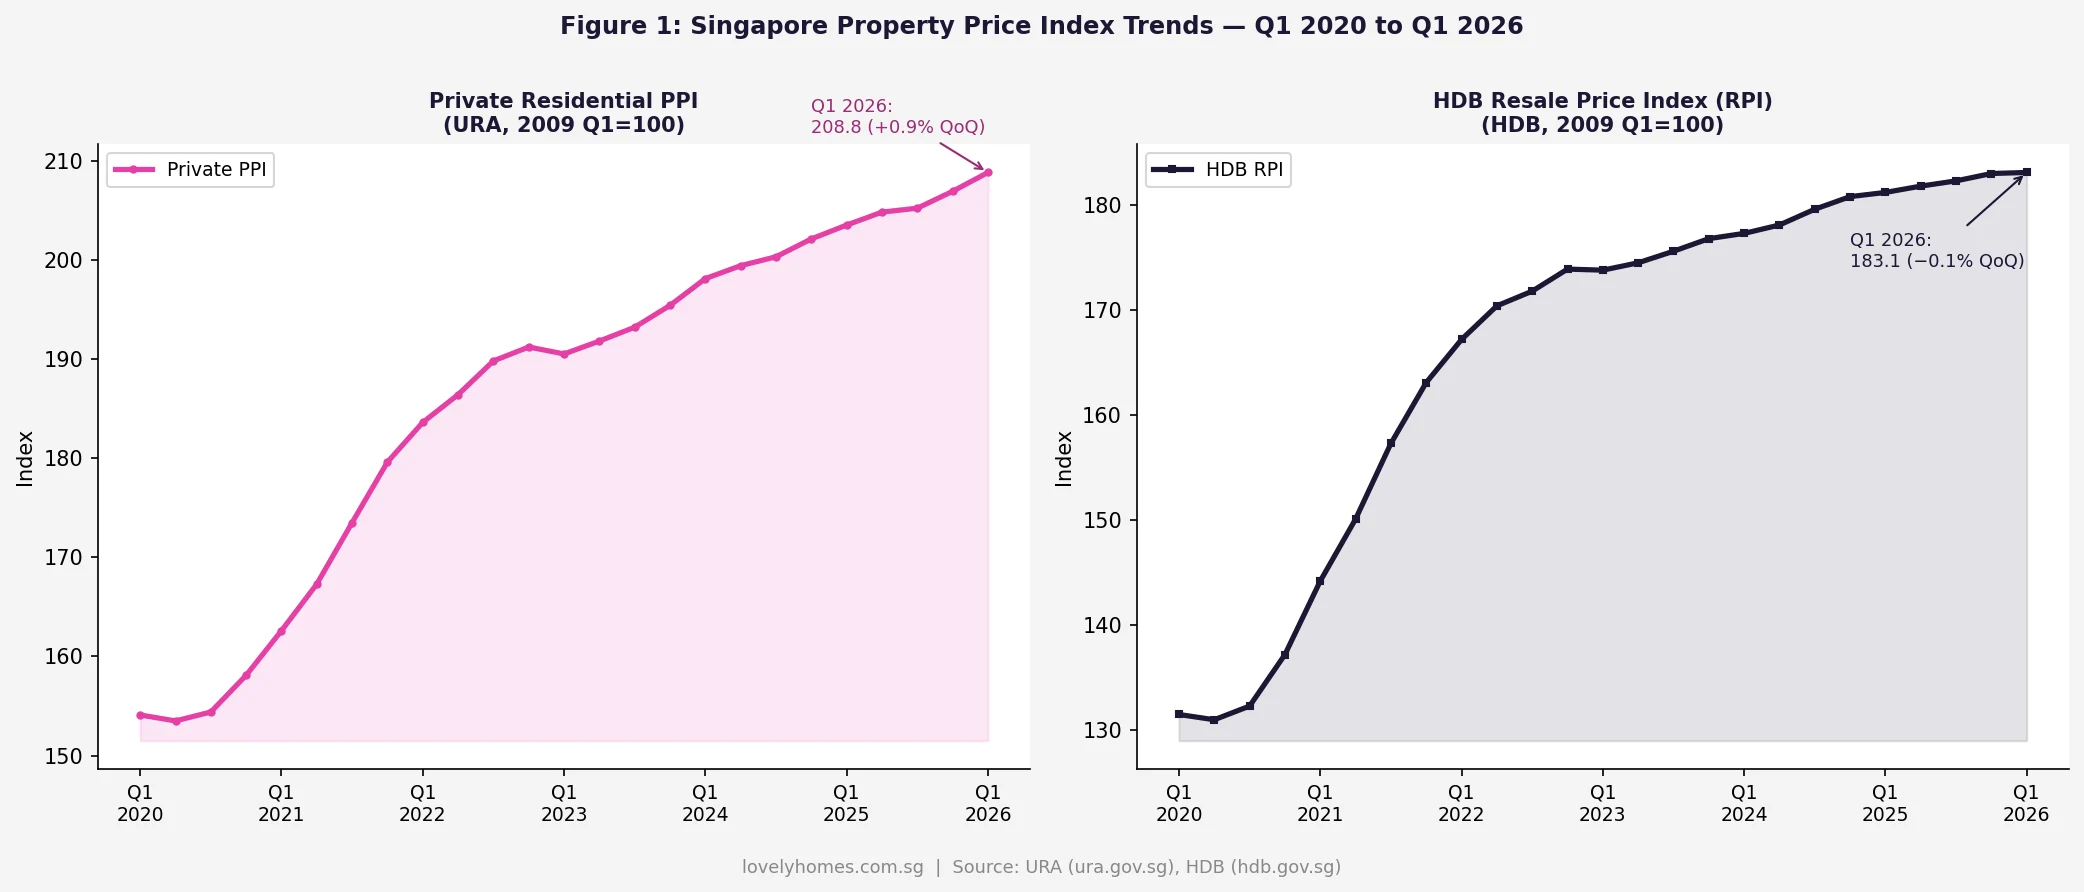
- Overall PPI: +0.5% QoQ in Q2 2026 (vs +0.9% in Q1 2026).
- Non-landed (overall): -0.1% QoQ (vs +1.3% in Q1 2026).
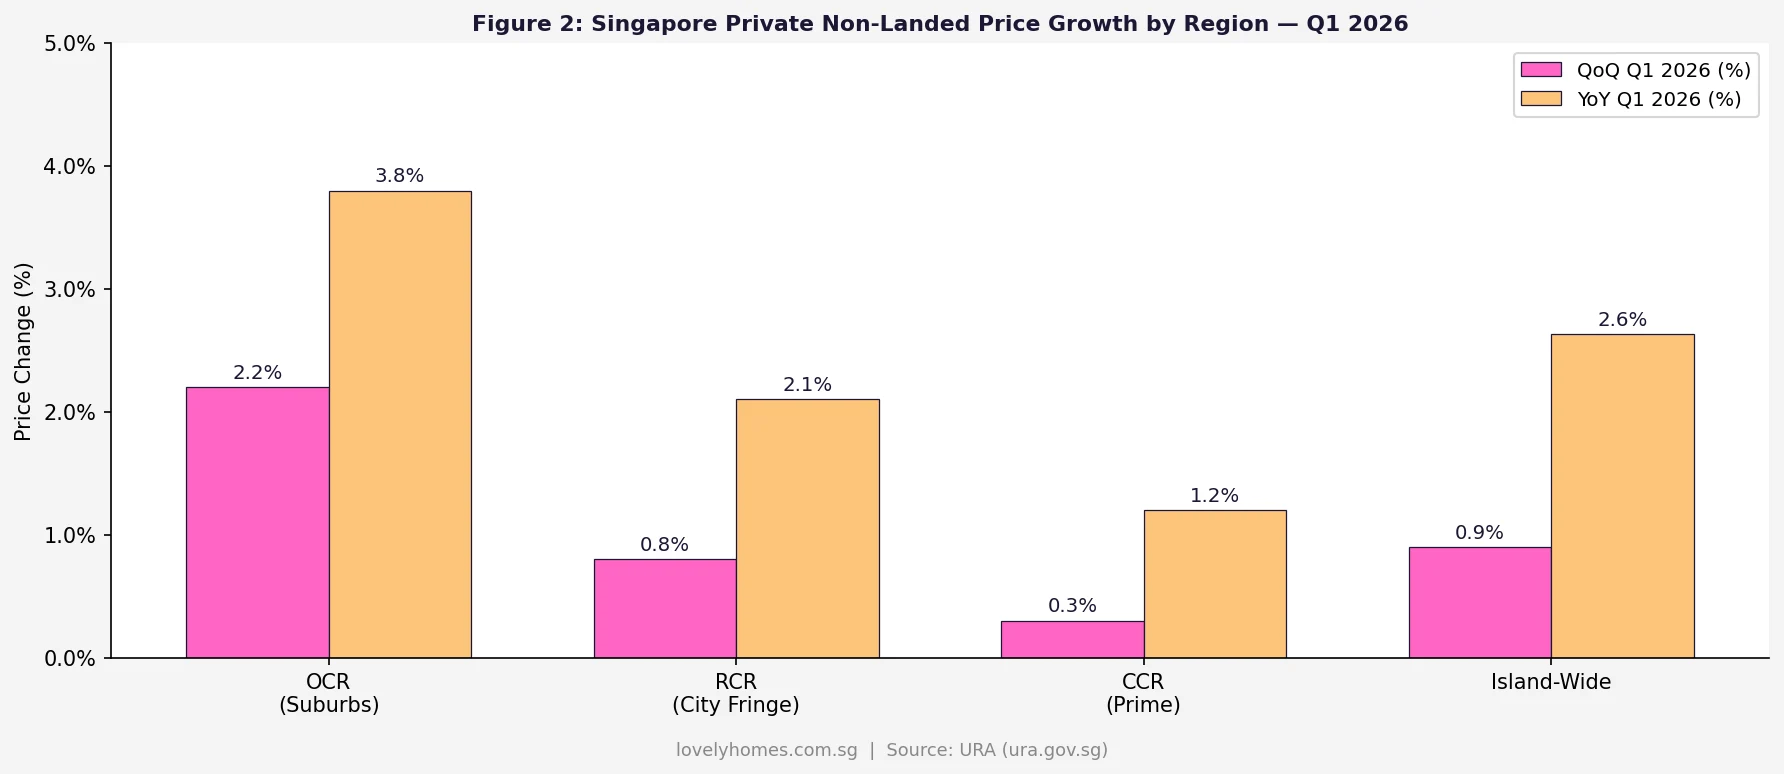
- Core Central Region (CCR): +2.0% QoQ — the strongest performing segment.
- Rest of Central Region (RCR): -1.4% QoQ — the weakest performing segment.
- Outside Central Region (OCR): -0.2% QoQ (vs +2.2% in Q1 2026).
- Landed properties: +2.6% QoQ — a sharp reversal from -0.4% in Q1 2026.
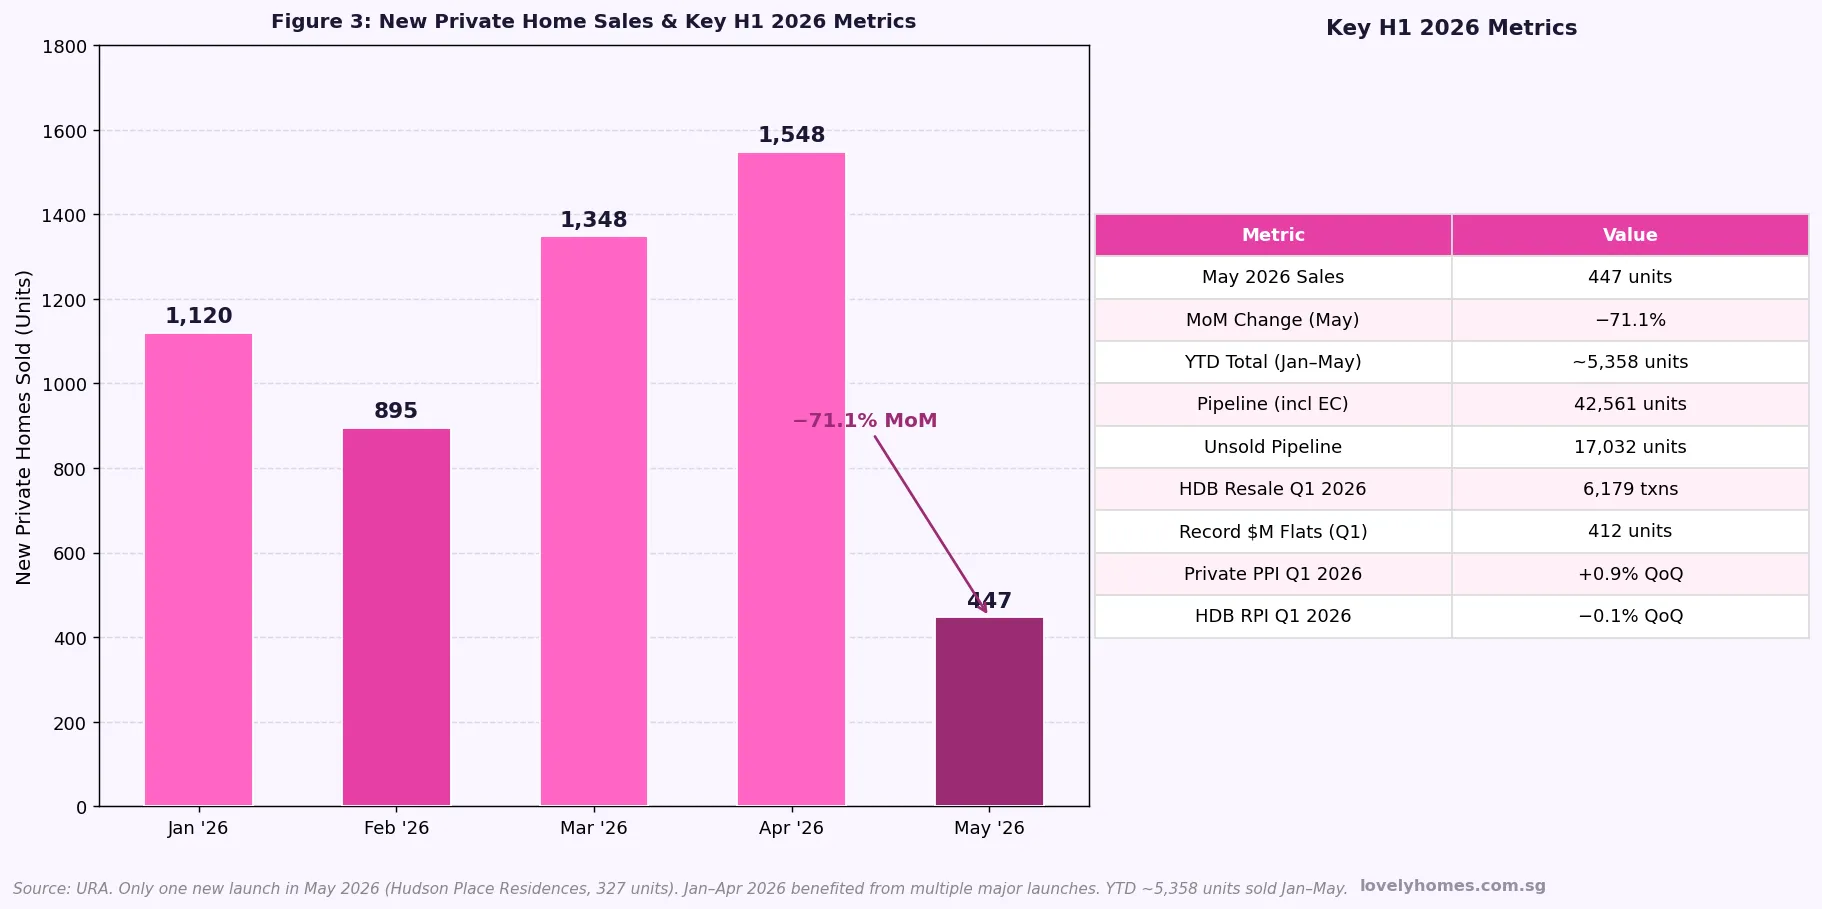
- Transaction volume: 5,420 units (up to mid-June 2026) — broadly comparable to 5,413 in Q1 2026.
- Full-year 2026 GLS Confirmed List: 9,320 units — over 50% above the 10-year annual average.
- Full Q2 2026 real estate statistics are due from URA on 24 July 2026.
The Q2 2026 Flash Estimate in Context
Flash estimates are preliminary figures compiled by URA based on stamp duty data and developer sales data from 1 April 2026 to mid-June 2026. They are inherently incomplete — the final figures released on 24 July 2026 will incorporate the full quarter’s transactions and typically differ by a modest margin from the flash estimate. URA cautions that “the public is advised to interpret the flash estimates with caution.”
With that caveat noted, the Q2 2026 flash estimate signals a meaningful shift in the composition of price growth. After a broad-based Q1 2026 rally — where OCR non-landed prices surged +2.2% and the overall index rose +0.9% — Q2 2026 shows the market rotating: luxury and landed properties strengthened, while mass-market and mid-tier segments gave back some of Q1’s gains.
Segment-by-Segment Analysis
Core Central Region (CCR) — +2.0% QoQ: The prime districts (Districts 1–4 and 9–11) outperformed all other segments in Q2 2026. The CCR had been relatively subdued in Q1 2026 (+0.6% QoQ) as the 60% ABSD for foreigners continued to dampen overseas buyer interest. The Q2 2026 rebound suggests domestic high-net-worth and upgrader demand — supported by declining SORA rates from their 2023–2024 peaks — is reasserting itself. The CCR also benefits from limited new supply relative to other segments. This is consistent with the observed trend of luxury landed and GCB (Good Class Bungalow) transactions picking up in the first half of 2026.
Rest of Central Region (RCR) — -1.4% QoQ: The RCR — covering areas such as Toa Payoh, Bishan, Tiong Bahru, and Queenstown — recorded the sharpest quarterly decline. This is likely a partial correction after strong new launch activity in prior quarters pushed RCR prices higher. As developers digested existing inventory and new launch momentum slowed, transacted prices softened. The RCR remains well above its Q1 2025 levels on a year-on-year basis.
Outside Central Region (OCR) — -0.2% QoQ: The OCR, which includes suburban regions such as Jurong, Tampines, Sengkang, and Punggol, saw a modest dip after its strong Q1 2026 performance (+2.2% QoQ). This retreat is consistent with the broader pattern of HDB upgrader demand normalising as the pool of HDB households completing the five-year MOP works through the system. Developer sales volumes in the OCR remained healthy, but headline prices moderated.
Landed properties — +2.6% QoQ: Landed homes (terraced houses, semi-detached, bungalows, and Good Class Bungalows) posted the strongest quarterly gain and reversed the -0.4% QoQ decline recorded in Q1 2026. Landed supply is structurally limited — only Singapore Citizens can purchase most landed property — and demand from citizens seeking generational family homes has remained firm. The combination of limited new landed supply, declining mortgage rates, and resilient household wealth among long-tenured Singapore Citizens supported this rebound.
| Segment | Q1 2026 QoQ | Q2 2026 QoQ (Flash) | Key Driver |
|---|---|---|---|
| Overall PPI | +0.9% | +0.5% | Deceleration; landed and CCR offset OCR/RCR softening |
| Non-landed (all) | +1.3% | -0.1% | RCR and OCR drag outweigh CCR gain |
| CCR (Core Central) | +0.6% | +2.0% | Luxury demand, declining rates, domestic upgrader activity |
| RCR (Rest of Central) | +0.8% | -1.4% | Post-launch correction; new supply absorption |
| OCR (Outside Central) | +2.2% | -0.2% | HDB upgrader normalisation; MOP pipeline moderating |
| Landed | -0.4% | +2.6% | Structural scarcity, SC-only demand, rate environment |
Transaction Volume: Stable Demand
Sale transaction volume in Q2 2026 stood at approximately 5,420 units (up to mid-June 2026), compared to 5,413 in Q1 2026. URA describes this as “broadly comparable,” indicating that buyer activity has not meaningfully contracted despite the overall price deceleration. This stable transaction count, combined with decelerating prices, is consistent with a market that is finding equilibrium rather than declining.
Supply Pipeline: Government Accelerating Delivery
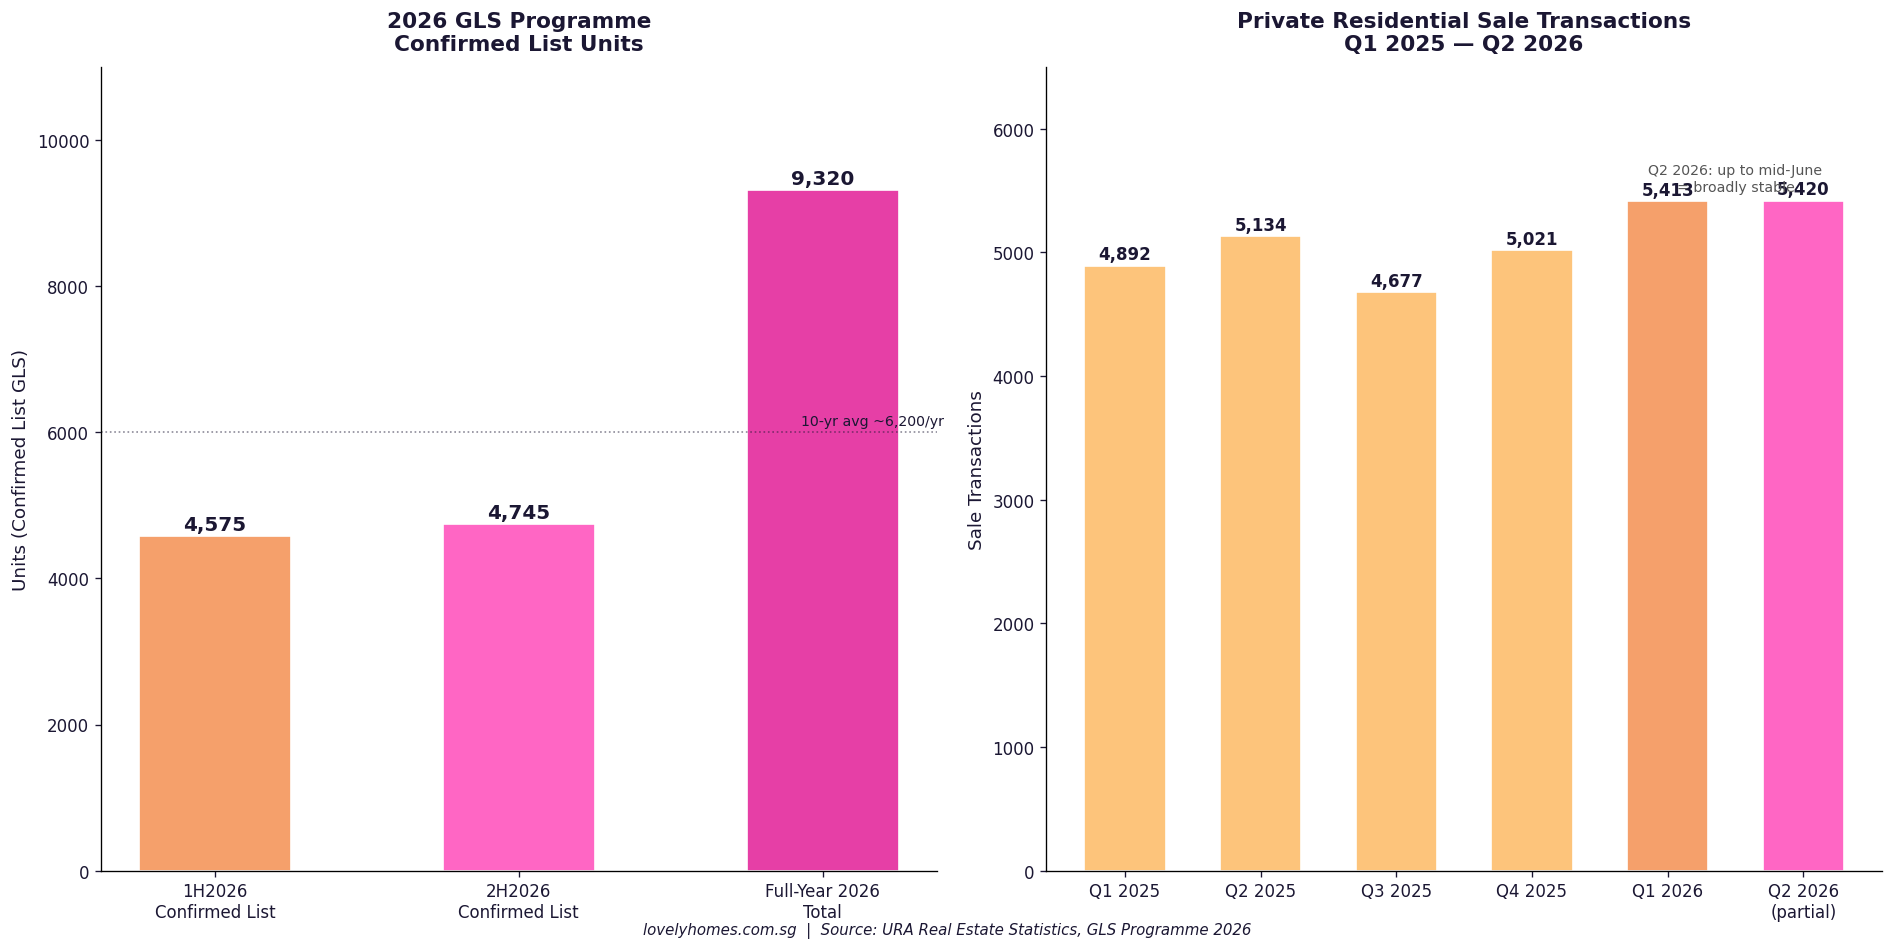
The government is maintaining a deliberate high supply stance. In 2H2026, a further 4,745 private residential units will be launched under the Confirmed List, bringing the full-year 2026 Confirmed List total to 9,320 units — over 50% higher than the past 10-year annual average of approximately 6,200 units per year. Including Executive Condominiums, approximately 61,000 private residential units are expected to be completed over the coming years, a significant pipeline that URA believes will ensure housing demand is met and price stability is maintained.
This supply commitment is a significant policy signal. It suggests the government does not intend to ease supply constraints even as price growth moderates, reinforcing the view that the cooling measures and ABSD framework are working as intended — slowing speculation without triggering price declines.
What This Means for Buyers, Sellers, and Investors
For buyers, the Q2 2026 data offers a nuanced picture. The mass market (OCR) and mid-tier (RCR) segments are showing mild softening — suggesting that patient buyers may find slightly better negotiating conditions in these segments than they did in Q1 2026. The CCR and landed markets, however, are moving in the opposite direction: buyers in these segments should not expect discounts. The high supply pipeline is a medium-term comfort: completions over the next few years should provide genuine choice and prevent runaway price inflation. However, the pipeline has not yet translated into meaningful price softening, suggesting underlying demand remains robust.
For sellers, the Q2 data does not indicate a price collapse. Year-on-year growth remains positive across all segments, and the overall PPI is still trending upward, albeit modestly. Sellers in well-positioned OCR and RCR projects who have held for several years remain in a strong position. The SSD framework (12%/8%/4%/NIL for years 1–4) means that sellers who purchased in 2024 or later face significant exit costs if selling within the SSD window.
For investors, the data reinforces the divergence between segments. CCR and landed are the standout performers in Q2 2026. The 60% foreigner ABSD remains a barrier for non-resident investors, but for Singapore Citizens with the means to invest in CCR or landed property, Q2 2026 shows meaningful appreciation. For OCR investors, the combination of high supply, modest price growth, and stable rental yields suggests a more measured outlook for capital appreciation over the near term.
What Might Come Next: Full Q2 Data on 24 July 2026
The flash estimate is compiled on approximately 75% of the full quarter’s transactions. The final figures, due 24 July 2026, will incorporate the complete Q2 2026 transaction set and may revise the initial numbers upward or downward. Historically, flash-to-final revisions for the Singapore private residential PPI have been small (typically within 0.2–0.4 percentage points). Analysts and market participants will also be watching for the detailed breakdown by property type, floor area, and specific district — context that flash estimates do not provide.
Beyond the Q3 2026 data, the key macro variables are: MAS exchange rate management and global trade uncertainty (the July 2026 economic environment remains “highly uncertain” per URA’s own framing), Federal Reserve policy direction, the HDB resale market trajectory (which feeds upgrader demand for OCR private condos), and developer launch volumes in 2H2026. The 2H2026 GLS Confirmed List launches, if absorbed at decent pricing, will provide a fresh read on developer confidence and buyer appetite going into 2027.
Frequently Asked Questions
What is the URA Private Residential Property Price Index (PPI)?
The URA PPI is a quarterly index compiled by the Urban Redevelopment Authority tracking changes in private residential property prices in Singapore. It covers all non-landed private residential transactions (apartments and condominiums) across the CCR, RCR, and OCR, as well as landed residential properties (terraced houses, semi-detached, bungalows). The index uses a hedonic regression methodology to control for changes in the quality mix of transactions, so a change in the PPI reflects a genuine price change rather than a change in the type of units sold. The full methodology is available on the URA website.
Why did CCR outperform while RCR and OCR declined in Q2 2026?
The divergence reflects two distinct demand drivers. CCR demand is primarily driven by domestic high-net-worth buyers, ultra-high-net-worth families, and some foreign buyers (despite the 60% ABSD). This cohort is less interest-rate sensitive and more influenced by portfolio diversification and lifestyle considerations. The CCR has also had limited new supply recently. RCR and OCR demand, by contrast, is driven more by the upgrader segment — HDB families completing their MOP and seeking private homes. This segment is more price-sensitive, and after a strong Q1 2026 driven by several new launch openings, some cooling was natural as those launches digested inventory.
Does the +0.5% QoQ increase mean property prices are still rising?
On a quarter-on-quarter basis, yes — the overall index still increased by 0.5% in Q2 2026. The PPI has not declined. Year-on-year growth (Q2 2025 vs Q2 2026) will be clearer when the full Q2 2025 data is confirmed as the base. The deceleration from +0.9% in Q1 2026 to +0.5% in Q2 2026 is meaningful but not alarming in the context of Singapore’s historical property cycle. As context: the index fell sharply in 2022 after cooling measures were introduced, and the recovery from 2023 onward has been gradual and measured.
What impact does the 9,320-unit GLS pipeline have on prices?
Supply additions work with a lag — land sold today typically enters the market as completed units two to four years later. The 9,320-unit 2026 GLS Confirmed List, together with the broader 61,000-unit pipeline of completions expected over the coming years, should exert a moderating influence on prices over the medium term. However, if economic conditions remain supportive and demand is sustained, large supply additions may simply be absorbed without sharp price declines. Singapore’s housing demand is underpinned by population growth, household formation, and the continued desire for private homeownership among its relatively affluent resident population.
When will the full Q2 2026 real estate statistics be released?
URA will release the full set of Q2 2026 real estate statistics, including the finalised PPI, rental index, number of units in the pipeline, and detailed transaction data by district and property type, on 24 July 2026. This release will also cover the private rental market, development pipeline, and unsold inventory. LovelyHomes will update this article and publish additional analysis once the full data is available.
Related Articles
- Singapore Property Market Forecast 2H 2026
- ABSD Singapore 2026: Complete Guide
- Singapore Property Cooling Measures Timeline 2009–2026
- Singapore Seller’s Stamp Duty (SSD) Guide 2026
- Singapore Home Mortgage Guide 2026
- HDB Resale Price Records June 2026
Disclaimer: This article is produced for general informational and editorial commentary purposes only and does not constitute financial, investment, or property advice. Property market statistics, index values, and GLS programme details are sourced from URA’s official releases. Flash estimates are preliminary and subject to revision on 24 July 2026. LovelyHomes is not responsible for investment decisions made on the basis of this commentary. Always consult licensed financial advisers and CEA-registered property salespersons before making property purchase or investment decisions. Primary source: URA press release, 1 July 2026.