Quick Answer — Q1 2026 Key Findings
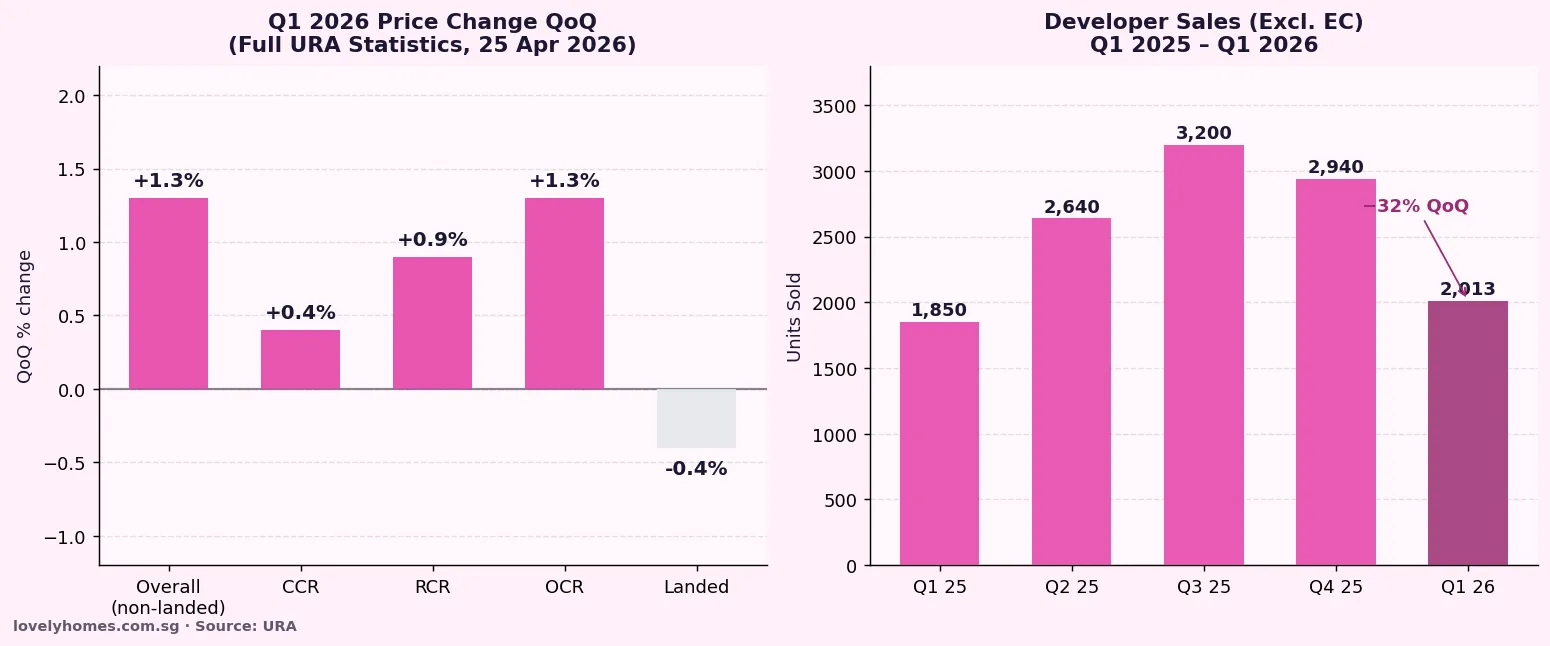
- Overall private residential prices rose +0.9% QoQ in Q1 2026 — a significant upward revision from the +0.3% flash estimate issued 1 April
- Non-landed segment led with +1.3% QoQ; landed homes fell −0.4% (first decline since Q1 2025)
- Developer sales (excl. EC): 2,013 units — down 32% QoQ from 2,940 in Q4 2025; new launches: 1,844 units
- Total private home sales (incl. resale & sub-sale): 5,413 units — down 19% QoQ
- Rental prices reversed: +0.3% QoQ after −0.5% in Q4 2025; leasing volume +4% to 20,861 contracts
- OCR led price growth at +1.3%; RCR +0.9%; CCR +0.4% — a reversal of the prior quarter’s CCR outperformance
- Source: URA Full Q1 2026 Real Estate Statistics, released 25 April 2026 (pr26-31)
The Headline: Prices Firmer Than Expected, but Activity Cools
Singapore’s private residential property market ended the first quarter of 2026 on a note that confounded earlier market caution. The Urban Redevelopment Authority’s (URA) full Q1 2026 real estate statistics — released on 25 April 2026 — confirmed a price increase of 0.9% quarter-on-quarter, a significant upward revision from the flash estimate of +0.3% published on 1 April. The upward revision reflects the inclusion of transactions that settled late in the quarter and the complete dataset across all market segments.
This marks the sixth consecutive quarter of overall price appreciation, and comes despite a sharp slowdown in transaction volumes. Developer sales of new private homes (excluding executive condominiums) fell 32% quarter-on-quarter to 2,013 units in Q1 2026, compared with 2,940 in Q4 2025 — the lowest quarterly developer sales figure since Q1 2025. The divergence between resilient prices and declining volumes reflects constrained new supply, selective buyer behaviour, and the legacy of affordability compression from 2023–2025 price appreciation.
Price Performance by Segment
| Segment | Q1 2026 QoQ Change | Q4 2025 QoQ Change | Commentary |
|---|---|---|---|
| Non-Landed (Overall) | +1.3% | −0.1% | Strongest QoQ in 5 quarters; reversal of Q4 dip |
| OCR (Outside Central) | +1.3% | +1.2% | Mass market continues to outperform; HDB upgrader demand |
| RCR (Rest of Central) | +0.9% | +0.5% | Strong; reflects demand for city-fringe new launches |
| CCR (Core Central) | +0.4% | +1.1% | Moderated from prior quarter; luxury demand more selective |
| Landed (Overall) | −0.4% | +3.4% | First decline since Q1 2025; mean-reversion after strong 2025 |
The OCR’s continued leadership at +1.3% QoQ reflects the powerful structural driver of HDB upgraders — households completing their 5-year MOP on government flats and redeploying equity into mass-market private condominiums in districts 18, 19, 20, 23, and 27. This demographic pipeline is well-documented and shows no signs of abating through 2027.
The CCR’s moderation from +1.1% in Q4 2025 to +0.4% is consistent with a market where luxury buyers are more selective in an environment of elevated global uncertainty — including the US-China trade tensions and the spill-over effects of US tariff regimes on Singapore’s export-oriented economy. That said, +0.4% still represents appreciation, and the CCR has not seen negative quarterly price movement since Q3 2023.
The landed segment’s −0.4% retreat follows a very strong Q4 2025 (+3.4%). Landed properties are thinly traded and highly volatile on a quarterly basis; the Q1 dip is best read as mean-reversion rather than trend reversal, particularly given the structural scarcity of landed housing stock in Singapore.
Developer Sales and New Launches
Developers sold 2,013 private residential units (excluding ECs) in Q1 2026 — a 32% drop from the 2,940 sold in Q4 2025, and the weakest quarterly figure since Q1 2025. New project launches totalled 1,844 units, concentrated in the OCR and CCR, reflecting the pipeline of projects that had received sales licences after significant delays in late 2024.
The pull-back in volumes should be contextualised: Q4 2025 was exceptionally strong, driven by the simultaneous launch of multiple large-scale projects (THE ORIE, Promenade Peak, Elta, Parktown Residence) that collectively captured pent-up demand. Q1 2026’s normalisation is partly seasonal and partly a function of the reduced number of new projects in the pipeline following the Q4 burst.
Resale and sub-sale transactions also fell, with total private home sales (all categories) coming to 5,413 units — down 19% from 6,699 in Q4 2025. Industry observers note that the absolute volume remains healthy relative to the 2019–2022 baseline and that the quarter started slowly before accelerating in March 2026 following the Lunar New Year holiday period.
Rental Market Reversal — What It Means
Private residential rents reversed their recent softening trend, rising +0.3% QoQ in Q1 2026 after declining −0.5% in Q4 2025. Leasing volume also strengthened, climbing 4% quarter-on-quarter to 20,861 rental contracts. This is the first positive quarterly rental movement since Q4 2023, and may mark the end of the post-pandemic rental correction that saw prices ease from their 2022–2023 highs.
The rental recovery is supported by two converging forces: a continued influx of foreign professionals amid Singapore’s sustained tech and financial sector hiring, and a temporary tightening of rental supply as a number of large residential projects that reached TOP in 2023–2024 move past initial tenant search periods. The question for Q2 and Q3 2026 is whether this modest recovery sustains, or whether the global economic headwinds translate into reduced expatriate inflows and renewed rental softening.
What Might Come Next
The price upward revision from +0.3% (flash) to +0.9% (full) is the quarter’s most significant data surprise. It suggests that the late-quarter transactions — many of which were sub-sales and resales settled in March — carried higher psf values than the new launch transactions recorded earlier in the quarter. If this pattern holds into Q2 2026, the annual price growth trajectory for 2026 could exceed the more cautious industry forecasts of 2–4%, potentially tracking closer to 4–6%.
The key risk factors for H2 2026 remain: (a) global trade disruption and its impact on Singapore GDP growth and business confidence; (b) SORA rate movements — 3M compounded SORA remains above 2.9% as at April 2026, keeping home loan servicing costs elevated; (c) potential further ABSD measures if price momentum accelerates unexpectedly; and (d) the supply pipeline — with 17+ new project launches anticipated across Q2–Q4 2026, increased competition between developers for buyers could moderate per-unit pricing.
Note: This analysis is editorial commentary based on publicly available URA data. It is not investment advice.
Frequently Asked Questions
Why did the Q1 2026 price figure revise upward from the flash estimate?
The URA flash estimate, published 3–4 weeks into the following quarter, uses only transactions registered up to approximately mid-March. The full statistics incorporate all transactions completed through 31 March 2026, including late-settling resale and sub-sale contracts. These late transactions often involve higher-priced units (larger formats, upper floors, prime locations) that take longer to process — hence the full release tends to show a stronger price outcome than the flash.
Is the slowdown in developer sales a warning sign for the market?
Not necessarily. Developer sales of 2,013 units in Q1 2026 represent a normalisation after a bumper Q4 2025 that saw multiple large launches coincide. Historical Q1 figures often dip due to the Chinese New Year effect — reduced transaction activity during the festive period. The more telling metric is the 12-month trailing average, which remains above 8,500 units annually — a healthy pace for Singapore’s market size. Price resilience at +0.9% QoQ alongside lower volumes actually points to supply-demand balance rather than demand erosion.
What does the rental recovery mean for property investors?
The +0.3% QoQ rental increase in Q1 2026 (after −0.5% in Q4 2025) is a positive signal for landlords who have been holding property through the 2023–2025 rental correction. If rental yields stabilise or improve through H2 2026, the investment case for Singapore residential property — which was weakened during the high-ABSD, high-SORA, lower-yield environment of 2023–2024 — may recover modestly. However, with gross yields for most CCR and RCR condominiums still in the 2.5–3.2% range versus SORA-linked mortgage rates of ~3.5–3.7%, properties remain net-cash-flow negative on a leveraged basis for most investors.
Related Articles
Private up 0.3%, public down — the initial April divergence
ABSD Singapore 2026
Full ABSD rates and implications for property market pricing
SORA Mortgage Rates April 2026
Current SORA benchmarks and their effect on home loan costs
Private Condo Rents Q1 2026
Rental market quarterly breakdown and trend analysis
Rental Yield Guide 2026
Where to find 4%+ gross yields in Singapore by district
0 Comments