HDB Resale Flat Prices Singapore 2026: Complete Guide to Trends, COV and Valuations
Quick Answer: HDB Resale Flat Prices in Singapore 2026
- 4-room flats transact at a national median of S$498,000 in Q1 2026, up from S$448,000 in 2024.
- 5-room flats reached a median of S$610,000 in Q1 2026; Executive Maisonettes hit S$710,000.
- Mature estates like Bukit Timah and Queenstown command 4-room premiums above S$700,000.
- The HDB Resale Price Index (RPI) stood at 183.1 in Q1 2026, up 8.7 points from Q1 2020.
- Cash Over Valuation (COV) is the amount paid above HDB’s assessed value — it must be paid in cash, not CPF.
- HDB resale prices are moderated by the Minimum Occupation Period (MOP), lease decay, and proximity grants.
- Prices are expected to grow modestly (1–3% annually) through 2026, supported by tight BTO supply and strong household formation.
What Are HDB Resale Flat Prices and How Are They Set?
When you purchase a Housing and Development Board (HDB) resale flat, you are buying from a private seller in the open market — not directly from HDB. The price is negotiated between buyer and seller, but must reflect market conditions and is informed by HDB’s Comparable Transaction data and the official valuation commissioned by the buyer’s bank or HDB loan officer.
Unlike BTO (Build-To-Order) flats, where HDB sets the selling price with subsidies applied, resale flat prices are driven by supply and demand. Factors include the flat’s lease remaining, floor level, renovation condition, proximity to MRT stations and top primary schools, estate amenities, and recent comparable transactions in the same block or vicinity.
HDB monitors and reports resale transaction data every quarter via the HDB Resale Price Index (RPI) and releases median transaction prices by flat type and town. This transparency helps buyers and sellers negotiate from an informed position.
HDB Resale Prices by Flat Type: 2024 vs Q1 2026
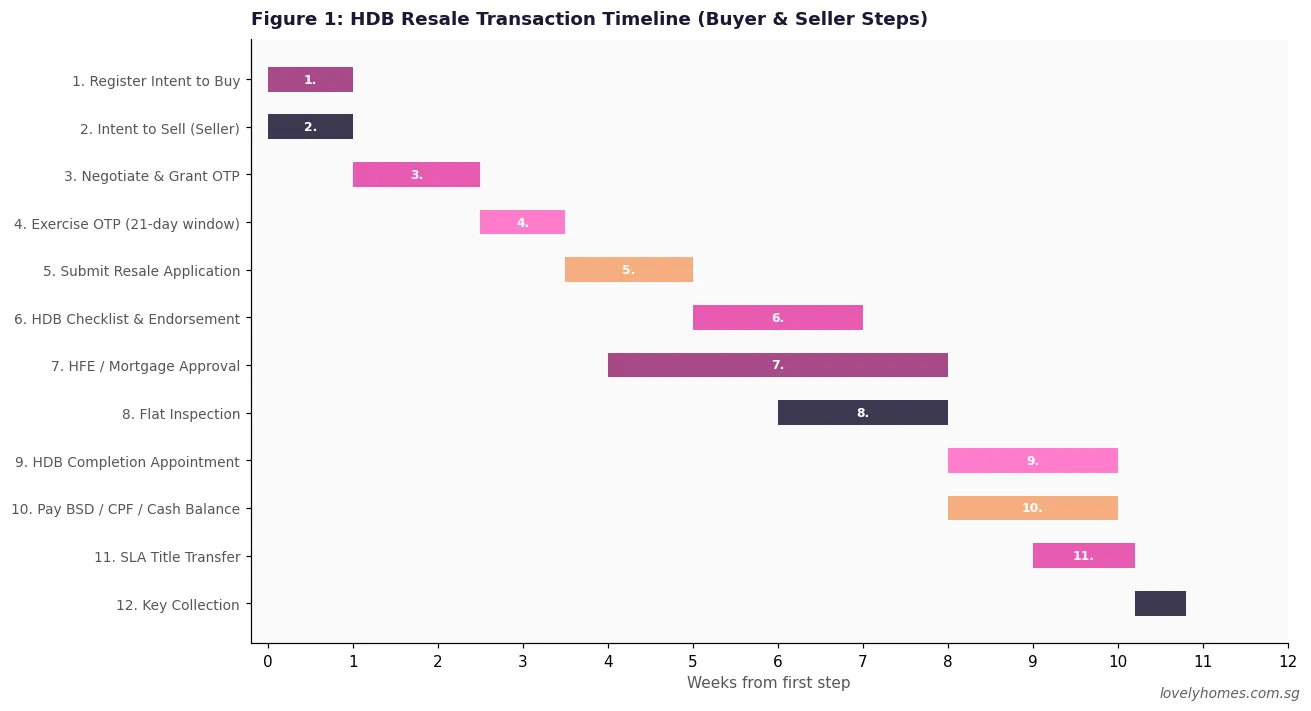
Resale prices have risen consistently across all flat types since 2020. The table below and Figure 1 compare median transacted prices in 2024 versus Q1 2026.

| Flat Type | 2024 Median | Q1 2026 Median | Change |
|---|---|---|---|
| 2-Room Flexi | S$285,000 | S$295,000 | +3.5% |
| 3-Room | S$315,000 | S$348,000 | +10.5% |
| 4-Room | S$448,000 | S$498,000 | +11.2% |
| 5-Room | S$570,000 | S$610,000 | +7.0% |
| Executive / Maisonette | S$658,000 | S$710,000 | +7.9% |
Source: HDB Resale Statistics. Figures are national medians; individual transactions vary by town, floor, and condition.
Understanding the HDB Resale Price Index (RPI)
The HDB Resale Price Index (RPI) is published by HDB every quarter. It tracks the overall movement of resale flat prices relative to a base period (Q1 2009 = 100). It is the closest equivalent to a benchmark price index for the HDB resale market — similar in concept to the URA Private Residential Property Index for the private market.
In Q1 2026, the RPI stood at 183.1, meaning resale prices are 83.1% higher in nominal terms than they were in Q1 2009. The rate of increase has slowed significantly since the sharp pandemic-era run-up of 2021–2022, when prices rose almost 25 points in two years. The market has since entered a plateau phase with modest quarterly gains of 0.2–0.4%.

The RPI is a useful trend indicator but does not tell you what any specific flat will transact at. The HDB Resale Portal’s Check Past Resale Transactions tool gives block-level data, which is far more actionable for buyers negotiating a specific unit.
HDB Resale Prices by Town: Where Are Prices Highest?
Resale prices vary enormously by location. The same flat type can fetch more than double in a mature, well-connected estate versus a young non-mature town. Figure 3 shows indicative Q1 2026 median 4-room prices for the ten most actively transacted towns.

Bukit Timah (S$810,000), Queenstown (S$720,000), and Bishan (S$660,000) lead the premium tier, driven by central location, proximity to top primary schools (Nanyang, Henry Park, Raffles Girls’), and strong upgrader demand. At the other end, Sengkang (S$495,000) and Hougang (S$510,000) remain among the most affordable mature-ish estates with good MRT coverage.
What Drives HDB Resale Prices?
Understanding the key price drivers helps buyers estimate fair value and sellers price competitively. The main factors are:
1. Location and connectivity. Proximity to MRT stations (within 500 metres) adds a meaningful premium. Flats within 1 km of top primary schools command a further uplift due to the MOE P1 registration priority system — see our guide to buying near top schools.
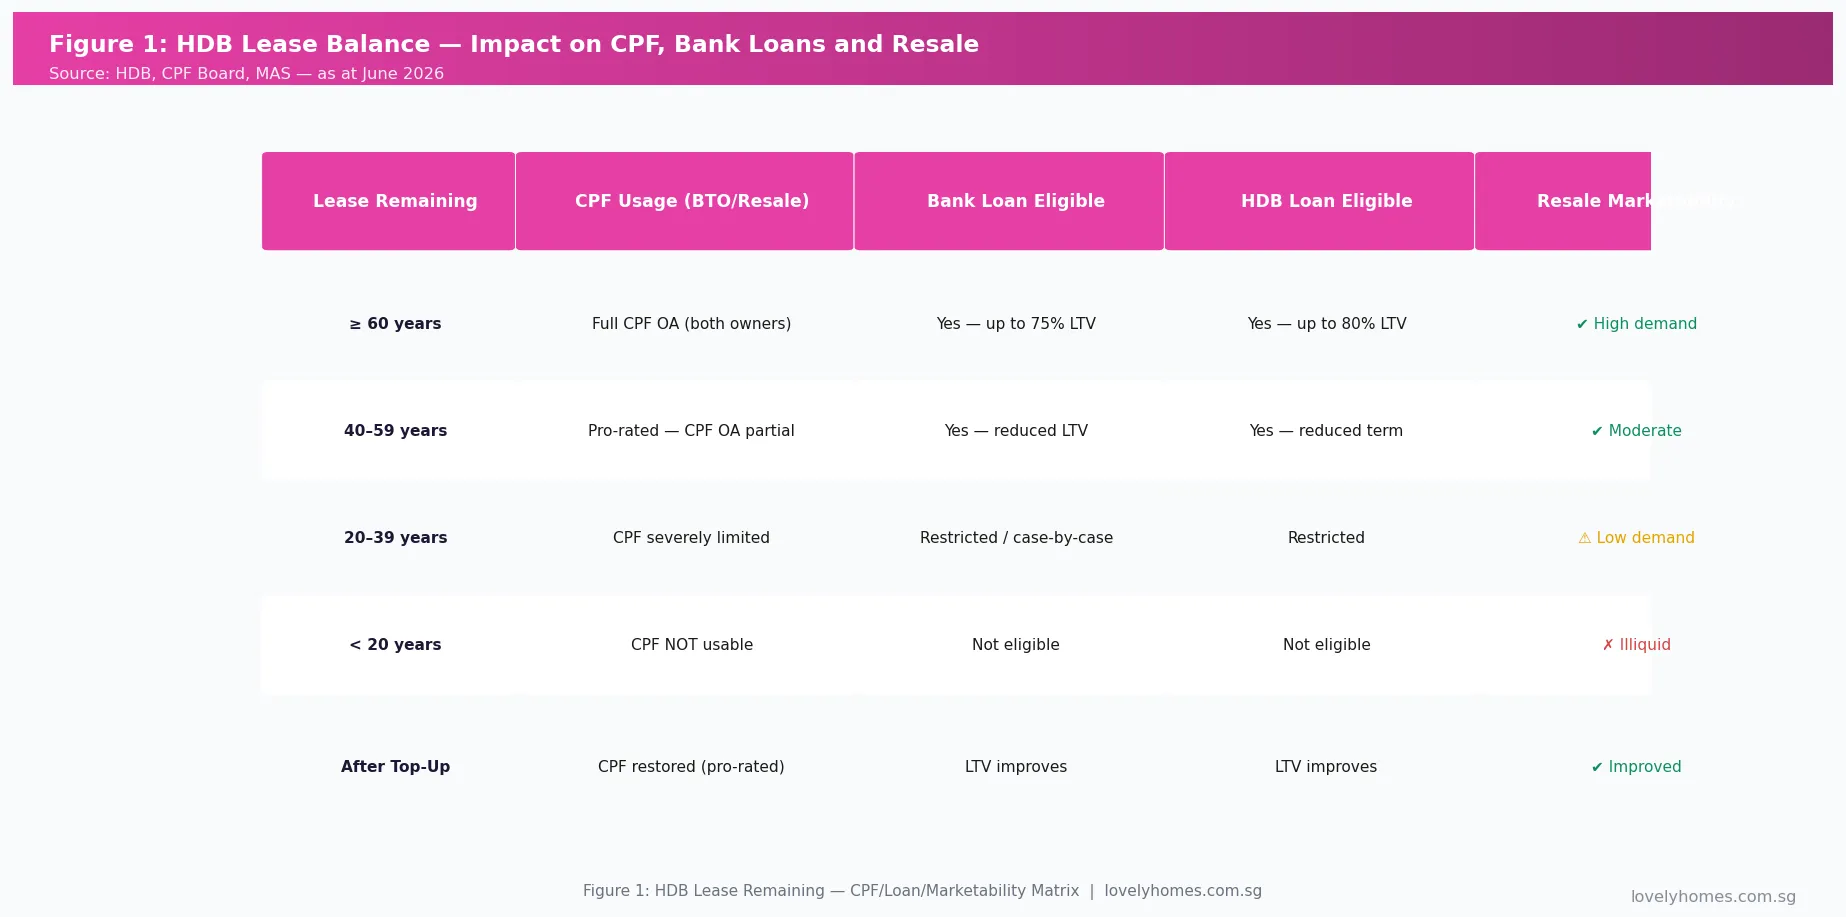
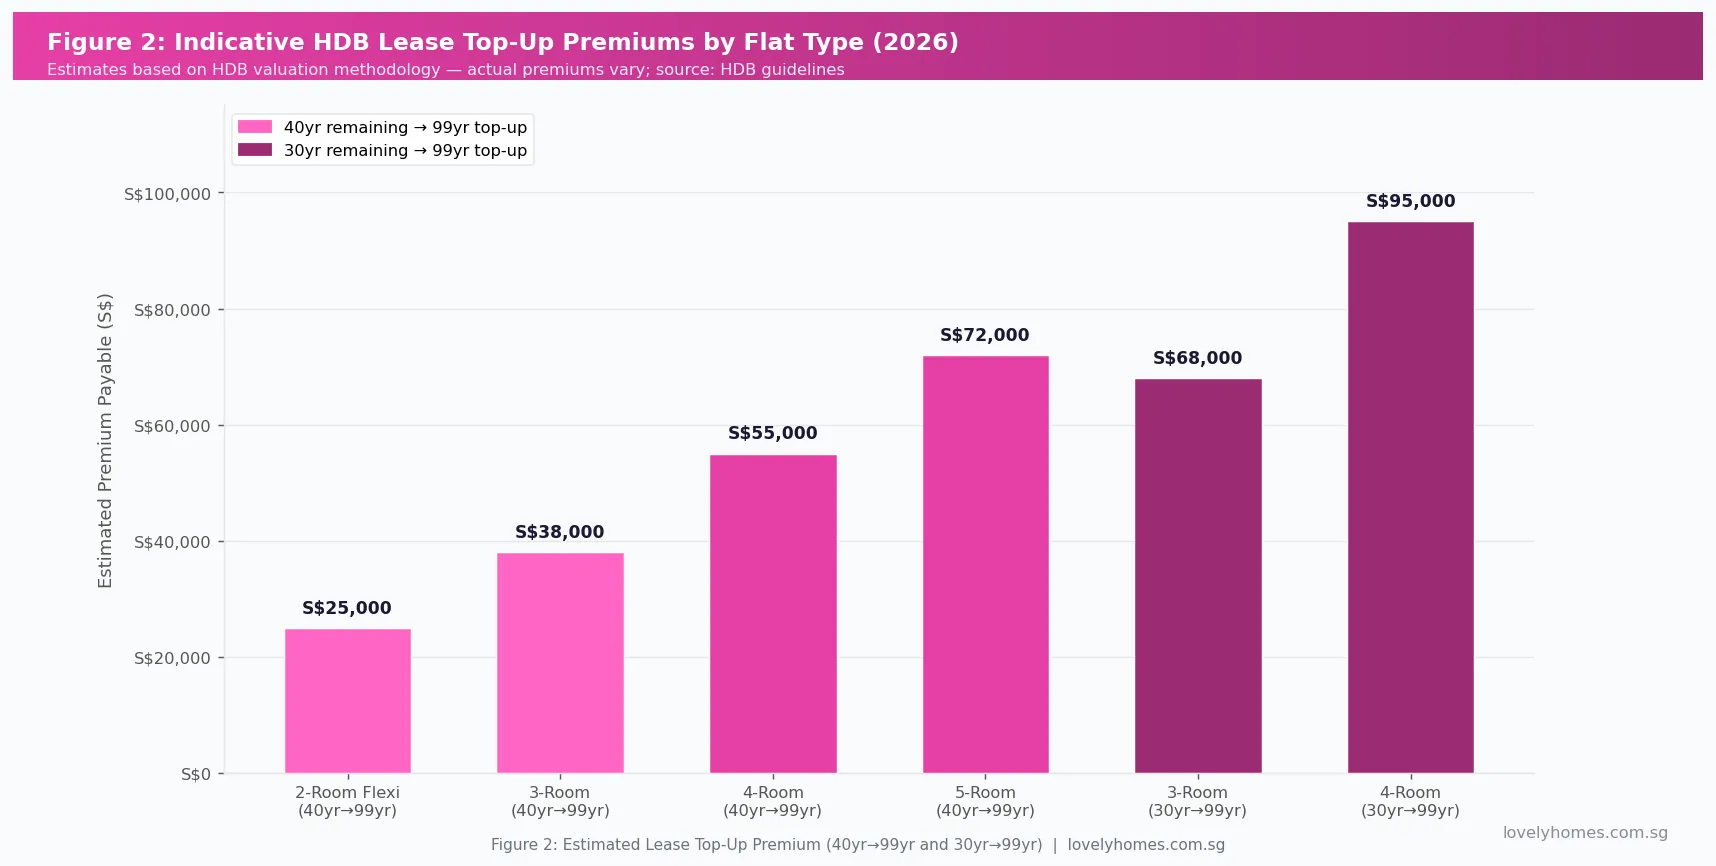
2. Remaining lease. HDB flats are sold on 99-year leases from the date of construction. A flat with 70 years remaining is worth more than one with 50 years, because CPF usage is restricted for flats with shorter leases — specifically, if the flat’s remaining lease cannot cover the youngest buyer to age 95, CPF usage is prorated. Banks also apply stricter LTV ratios on short-lease flats. The HDB Lease Buyback Scheme and Lease Top-Up programme can extend some leases, but this remains a minority option.
3. Flat condition and renovation. Buyers frequently pay a S$20,000–S$80,000 premium for freshly renovated units with quality kitchen and bathroom fittings, versus an unrennovated unit in the same block. However, overbuilt or highly customised renovations do not recover their full cost at resale.
4. Floor level and orientation. High-floor units with unobstructed views or favourable orientations (e.g., north-south facing to minimise afternoon sun) attract 5–15% premiums over low-floor equivalents in the same block.
5. Flat size (actual square footage). HDB flat-type naming covers a range of actual sizes. A “4-room” flat can be anywhere from 80 to 110 square metres depending on the development era. Buyers should always divide the asking price by the actual size in square metres to compare on a per-square-metre basis.
6. HDB upgrading works. Flats that have completed the Home Improvement Programme (HIP) or Neighbourhood Renewal Programme (NRP) typically command a S$20,000–S$40,000 premium over pre-HIP equivalents, as buyers factor in avoided costs and improved common-area aesthetics.
Cash Over Valuation (COV) Explained
One of the most misunderstood concepts in HDB resale is Cash Over Valuation (COV). When a buyer agrees to pay a price higher than the official valuation of the flat (determined by an accredited valuer appointed by HDB, the buyer’s bank, or HDB’s own valuation office), the excess is the COV — and it must be paid entirely in cash. CPF Ordinary Account funds can only be used up to the officially assessed market value.
For example, if a flat is valued at S$550,000 but the negotiated transacted price is S$575,000, the COV is S$25,000. This S$25,000 must come from cash savings, not CPF. It is paid on top of the standard cash and CPF downpayments for the loan.
COV is common in popular estates and for well-renovated flats. Buyers should check the HDB Resale Portal at resale.hdb.gov.sg for recent transactions in the target block to gauge whether COV is likely and at what level before making an offer.
Worked Example: The Chew Family
Scenario: SC Couple Buying a 5-Room Flat in Tampines
Mr and Mrs Chew are Singapore Citizens. Mr Chew (34) earns S$6,200/month; Mrs Chew (33) earns S$5,100/month. Joint monthly income: S$11,300. They have S$120,000 in CPF Ordinary Account (combined) and S$60,000 in cash savings. They are first-time buyers and have never owned any property.
- Target flat: 5-room HDB in Tampines, 92 sqm, lease commenced 2001 (remaining ~74 years), renovated 2022.
- Negotiated price: S$640,000
- Official valuation: S$618,000
- COV: S$640,000 − S$618,000 = S$22,000 (cash, not CPF)
- HDB loan (2.6% p.a., 25 years, LTV 80%): S$494,400 → monthly instalment S$2,240/month
- MSR check: S$2,240 ÷ S$11,300 = 19.8% (below 30% MSR cap — PASS)
- CPF downpayment: 20% × S$618,000 (valuation) = S$123,600 → covered by combined CPF OA of S$120,000 + S$3,600 top-up in cash
- Cash required at exercise: COV S$22,000 + BSD S$12,950 + Legal S$2,800 + HDB admin fee S$80 + CPF shortfall S$3,600 = S$41,430
- CPF Housing Grants applied: EHG S$50,000 (income S$11,300/mth, eligible) + Family Grant S$50,000 (resale 5-room) = S$100,000 total grants applied against purchase price via CPF OA
Result: The Chews’ effective net price after grants is S$540,000. Monthly instalment of S$2,240 is comfortably within the MSR. Their cash outlay of S$41,430 is manageable given their S$60,000 in savings. They retain approximately S$18,570 in liquid cash after the purchase.
Why HDB Resale Values Hold Up — and When They Don’t
Singapore’s public housing market has historically been resilient because HDB flats serve a fundamental shelter function for the majority of the population. Several structural factors support resale values:
Eligibility restrictions keep demand concentrated. Only Singapore Citizens and Permanent Residents may purchase HDB flats. This excludes the largest category of buyers (foreigners) who are entirely channelled into the private market. Within the eligible pool, demand is strong: household formation rates remain high, BTO supply takes 3–5 years to deliver, and the resale market is the only avenue for those needing a home now.
CPF integration creates a floor price. For most HDB buyers, CPF Ordinary Account savings constitute a large part of the downpayment. This effectively creates a price floor, as buyers are willing to commit CPF savings they might otherwise lose access to if they do not purchase a property. The CPF accrued interest mechanism means sellers must refund CPF usage plus accrued interest on sale, which effectively anchors the minimum sale price needed to recover the seller’s CPF commitment.
When values can soften. Short-lease flats (below 60 years remaining) face structural headwinds: CPF usage restrictions, tighter bank LTV, and lower pool of eligible buyers. Estates where residents have grown older without sufficient HIP investment, or where population resettlement has reduced catchment size, may also see below-average growth. A flat approaching 40–50 years of lease expiry may see steep valuation discounts.
What Might Come Next for HDB Resale Prices?
This section represents editorial analysis and forward-looking opinion, not a guarantee of future price performance.
The HDB resale market is likely to grow at a modest 1–3% annualised rate through 2026 and into 2027, based on the following dynamics. BTO supply delivered in 2023–2024 (from launches in 2020–2021) will start reaching MOP from 2025 onwards, gradually increasing resale supply. However, the June 2026 BTO exercise offering 6,900 flats in popular towns (Bishan, Bukit Merah, Ang Mo Kio) will only arrive on the resale market in 2031–2033 at the earliest.
Interest rate trends matter too. If the Singapore Overnight Rate Average (SORA) continues declining through 2026, bank loan attractiveness relative to the HDB loan (fixed at 2.6% p.a.) shifts. A sustained decline in SORA could bring more buyers back to the market, supporting demand for resale flats, particularly among those who prefer immediate occupation over the 3–5 year BTO wait.
Prime Location Public Housing (PLH) flats with 10-year MOPs, and any further cooling measures, could dampen speculative demand at the top end. However, the entry-level and mid-tier resale segments (3-room and 4-room in non-mature estates) appear structurally well-supported.
Summary Table: HDB Resale Prices at a Glance (Q1 2026)
| Flat Type | National Median | Premium Town Range | Affordable Town Range |
|---|---|---|---|
| 2-Room Flexi | S$295,000 | S$380,000–S$450,000 | S$220,000–S$270,000 |
| 3-Room | S$348,000 | S$480,000–S$650,000 | S$280,000–S$330,000 |
| 4-Room | S$498,000 | S$650,000–S$900,000+ | S$400,000–S$480,000 |
| 5-Room | S$610,000 | S$750,000–S$1,000,000+ | S$490,000–S$570,000 |
| Executive / Maisonette | S$710,000 | S$850,000–S$1,100,000+ | S$580,000–S$660,000 |
Frequently Asked Questions: HDB Resale Flat Prices
How do I find out the recent transacted prices for a specific HDB block?
Use the HDB Resale Flat Prices tool on the official HDB website at resale.hdb.gov.sg. You can filter by town, flat type, street name, and period. The tool shows every registered resale transaction, including the transacted price, floor area, storey range, and flat model. This is the most reliable data source for gauging fair value for a specific unit. The URA Real Estate Information System (REALIS) also contains HDB transaction data for subscribers.
Are HDB million-dollar flats common, and what drives them?
HDB resale flats transacting above S$1,000,000 (colloquially called “million-dollar flats”) have become more frequent since 2022. They are overwhelmingly concentrated in mature central estates (Queenstown, Bishan, Toa Payoh, Ang Mo Kio) for large flat types (5-room, Executive Maisonette) on high floors with long remaining leases. In Q1 2026, approximately 80–120 units per quarter transact above S$1,000,000 — this represents less than 2% of total quarterly transactions and is not representative of the broader market. Most resale flats transact between S$300,000 and S$700,000.
Can I use CPF to pay COV?
No. Cash Over Valuation must be paid entirely in cash. CPF Ordinary Account funds can only be applied towards the purchase price up to the officially assessed valuation. If you agree to pay S$560,000 for a flat valued at S$540,000, the S$20,000 COV must come from your cash savings. This is an important planning point — buyers who have substantial CPF balances but limited cash savings may be unable to purchase a flat with a high COV without additional cash top-ups.
How does the Ethnic Integration Policy (EIP) affect resale prices?
The Ethnic Integration Policy (EIP) sets racial proportion limits for each HDB block and neighbourhood. If a block has already reached its Chinese, Malay, or Indian/Other quota for a given ethnic group, buyers of that ethnicity cannot purchase in that block — effectively reducing the pool of eligible buyers. When a block is at or near quota for a popular ethnic group, this can exert downward pressure on transacted prices because fewer buyers qualify. Conversely, a block with open quota availability across all ethnic groups attracts the widest buyer pool and tends to transact at or above comparable blocks with restricted quotas.
Does a shorter lease always mean a lower price?
Generally yes, but the discount is non-linear and depends on specific thresholds. Flats with more than 60 years remaining trade relatively normally. Once a flat’s remaining lease falls below 60 years, CPF restrictions begin to phase in — the amount of CPF that can be used is prorated based on how long the flat’s lease can cover the youngest buyer to age 95. Below 30 years remaining, the flat becomes effectively cash-only, dramatically reducing the buyer pool. Short-lease flats in desirable locations (e.g., Queenstown or Toa Payoh) may still trade at substantial absolute prices due to location premium, but will not appreciate at the same rate as longer-lease counterparts.
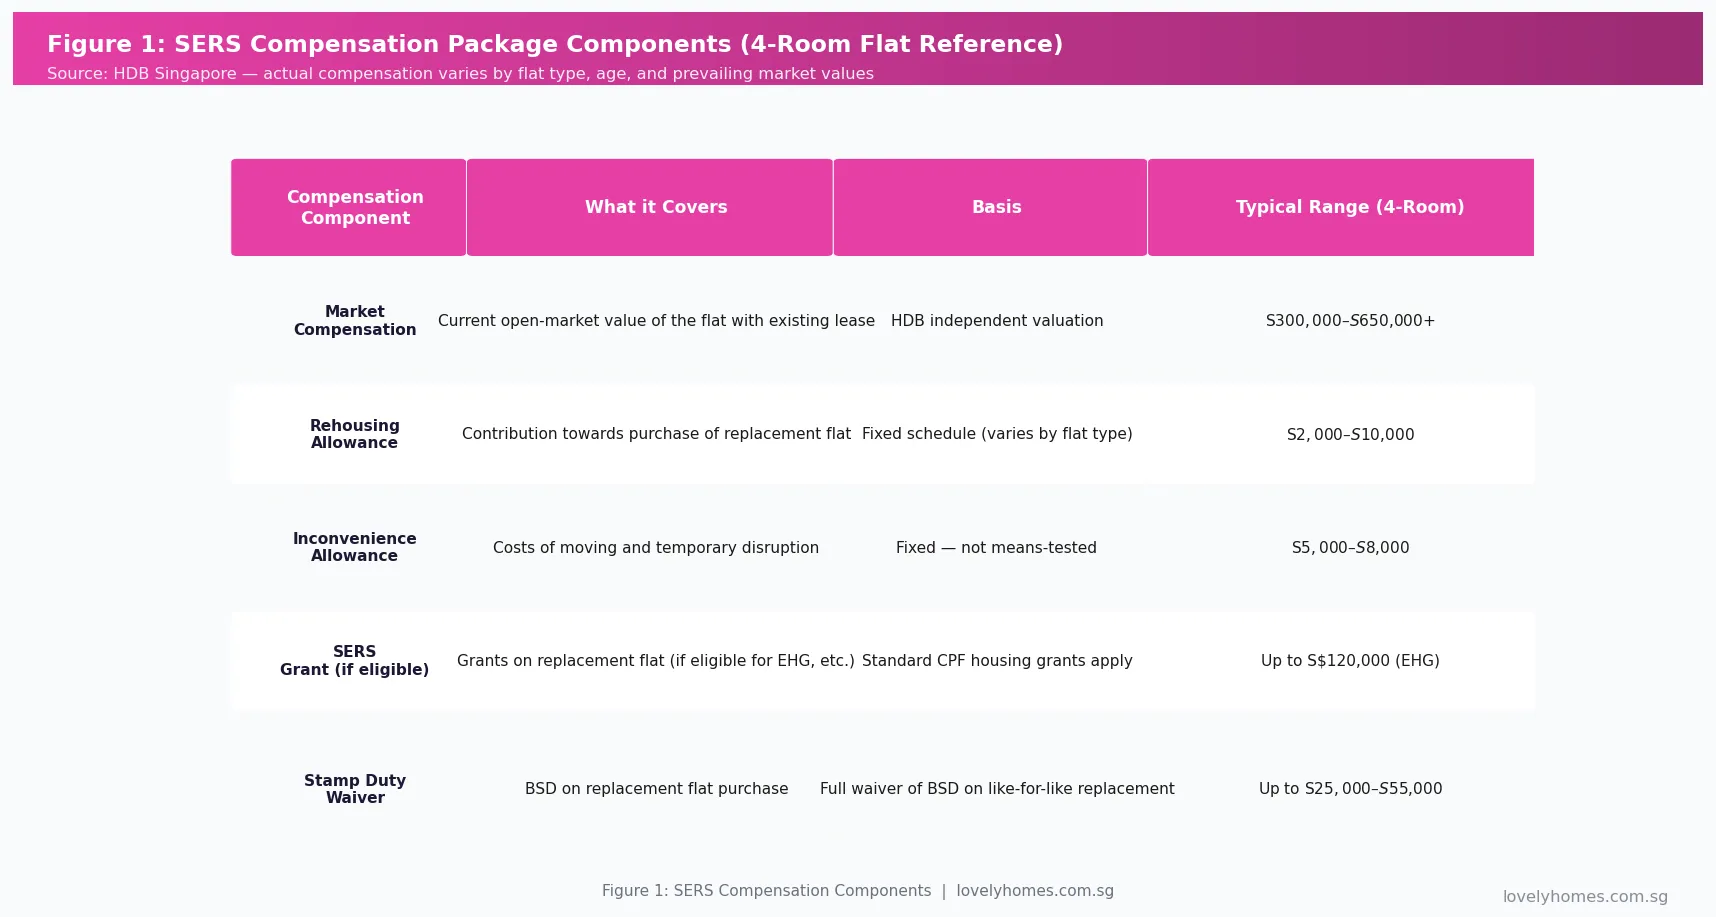
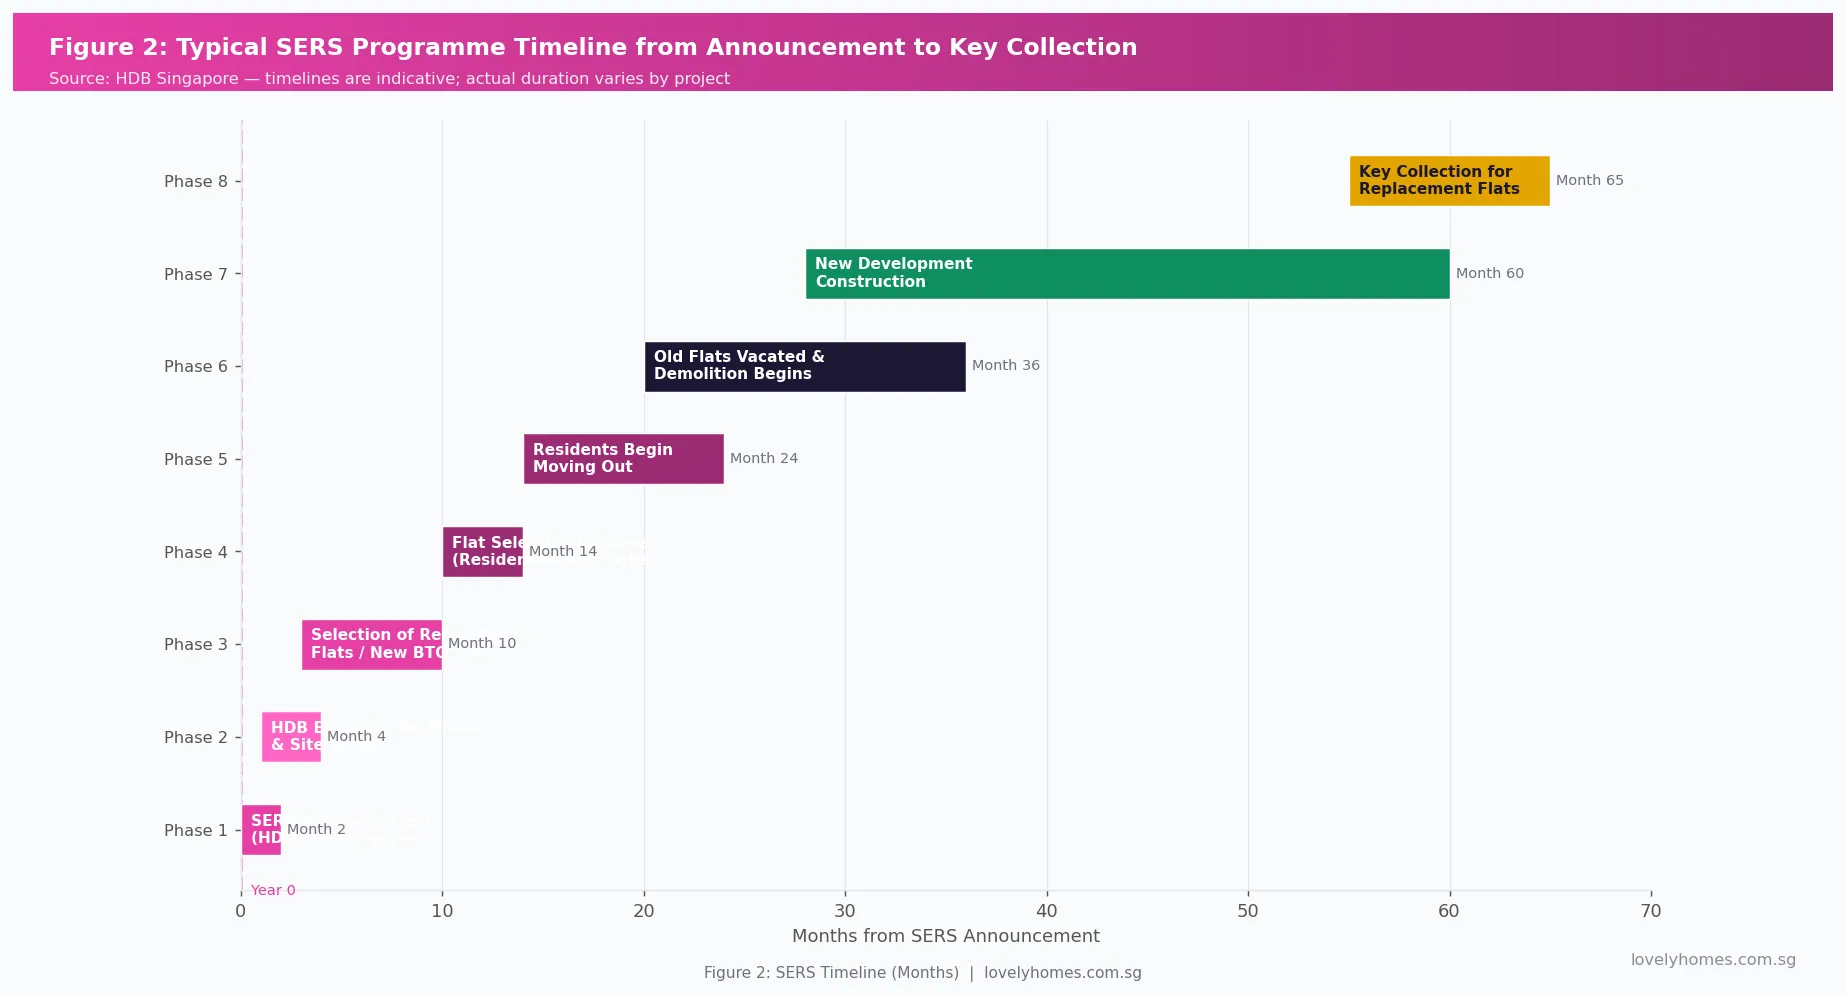
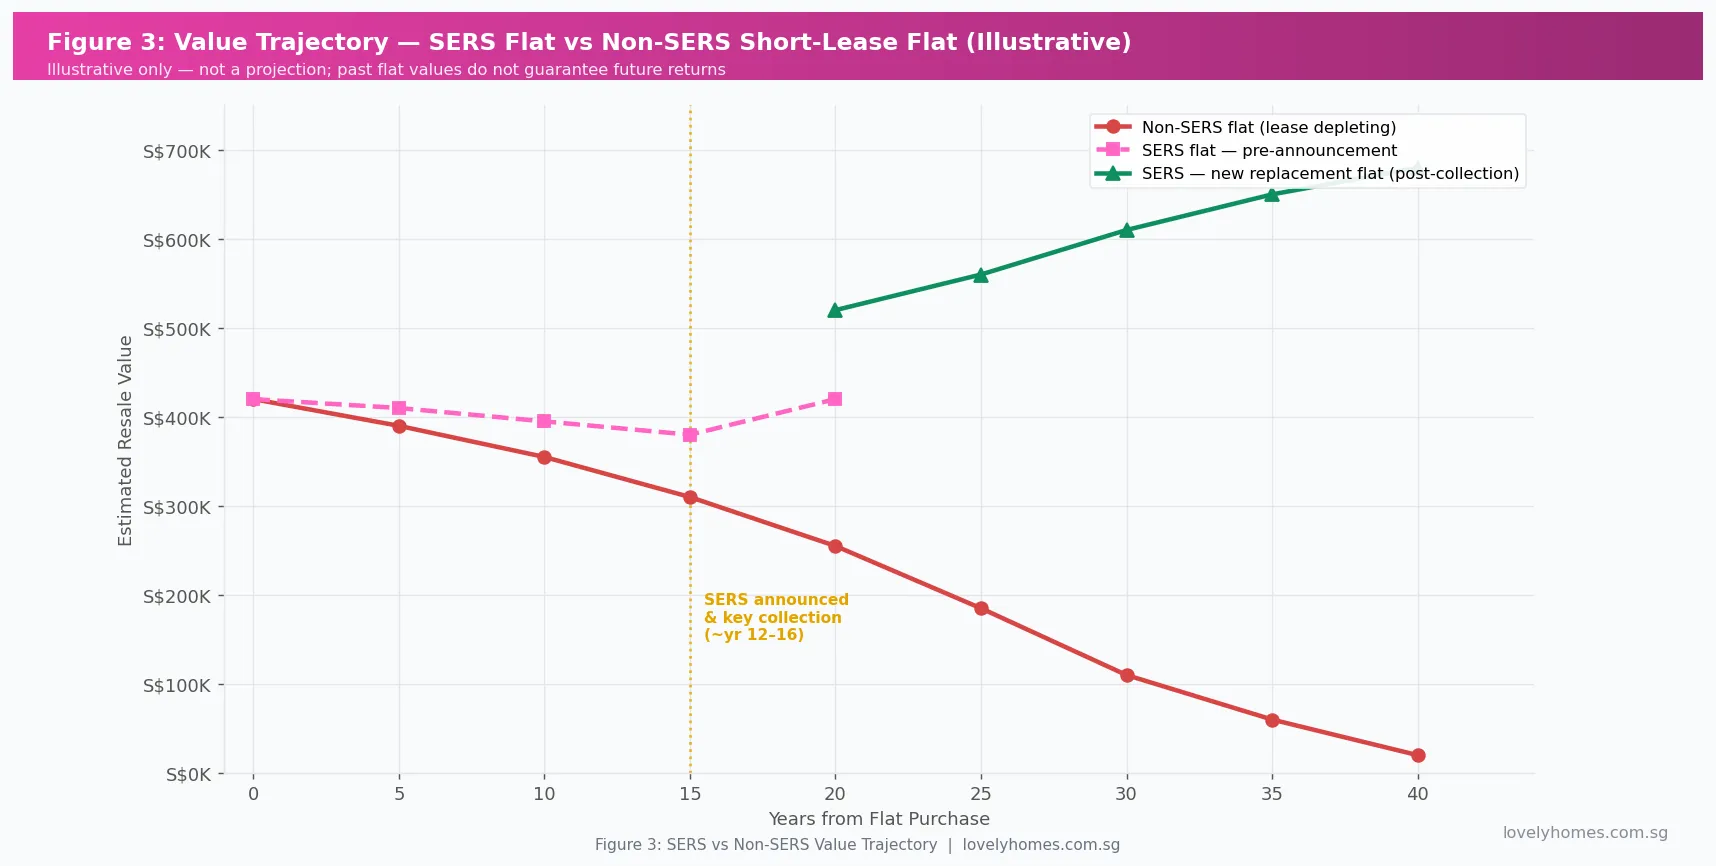
What happens to a flat’s price after HDB’s Selective En Bloc Redevelopment Scheme (SERS)?
When HDB announces a SERS for a block, the announcement itself typically causes an immediate uplift in nearby comparable flat prices as the market anticipates compensation plus new-flat allocation. However, SERS is administered selectively by HDB and cannot be applied for by residents — it is announced by HDB when redevelopment is deemed appropriate for planning reasons. Fewer than 5% of HDB estates have ever been selected for SERS, so it is not a reliable investment thesis for most buyers.
How do HDB resale prices compare internationally?
HDB resale flats remain remarkably affordable relative to comparable housing in global cities despite recent price growth. A national median 4-room flat at S$498,000 represents approximately 4–5 years of median household income for a dual-income SC couple — a price-to-income ratio that is far more favourable than Hong Kong, Sydney, or London. The key enabler is Singapore’s CPF-linked savings system, which channels mandatory pension contributions directly into housing affordability, and the Ethnic Integration Policy, which distributes demand across the island rather than concentrating it in a few prime postcodes.
Related Articles
- HDB Resale Process Singapore 2026: Step-by-Step Guide from OTP to Key Collection
- HDB Loan vs Bank Loan Singapore 2026: Rates, LTV and Which Saves You More
- Singapore CPF Housing Grant Guide 2026: EHG, PHG, Family Grant and How to Apply
- Singapore CPF Accrued Interest for Property 2026: What You Owe Your CPF When You Sell
- HDB Minimum Occupation Period (MOP) Singapore 2026: Complete Guide
- Singapore HDB Upgrading Programmes Guide 2026: HIP, NRP and What Flat Owners Pay
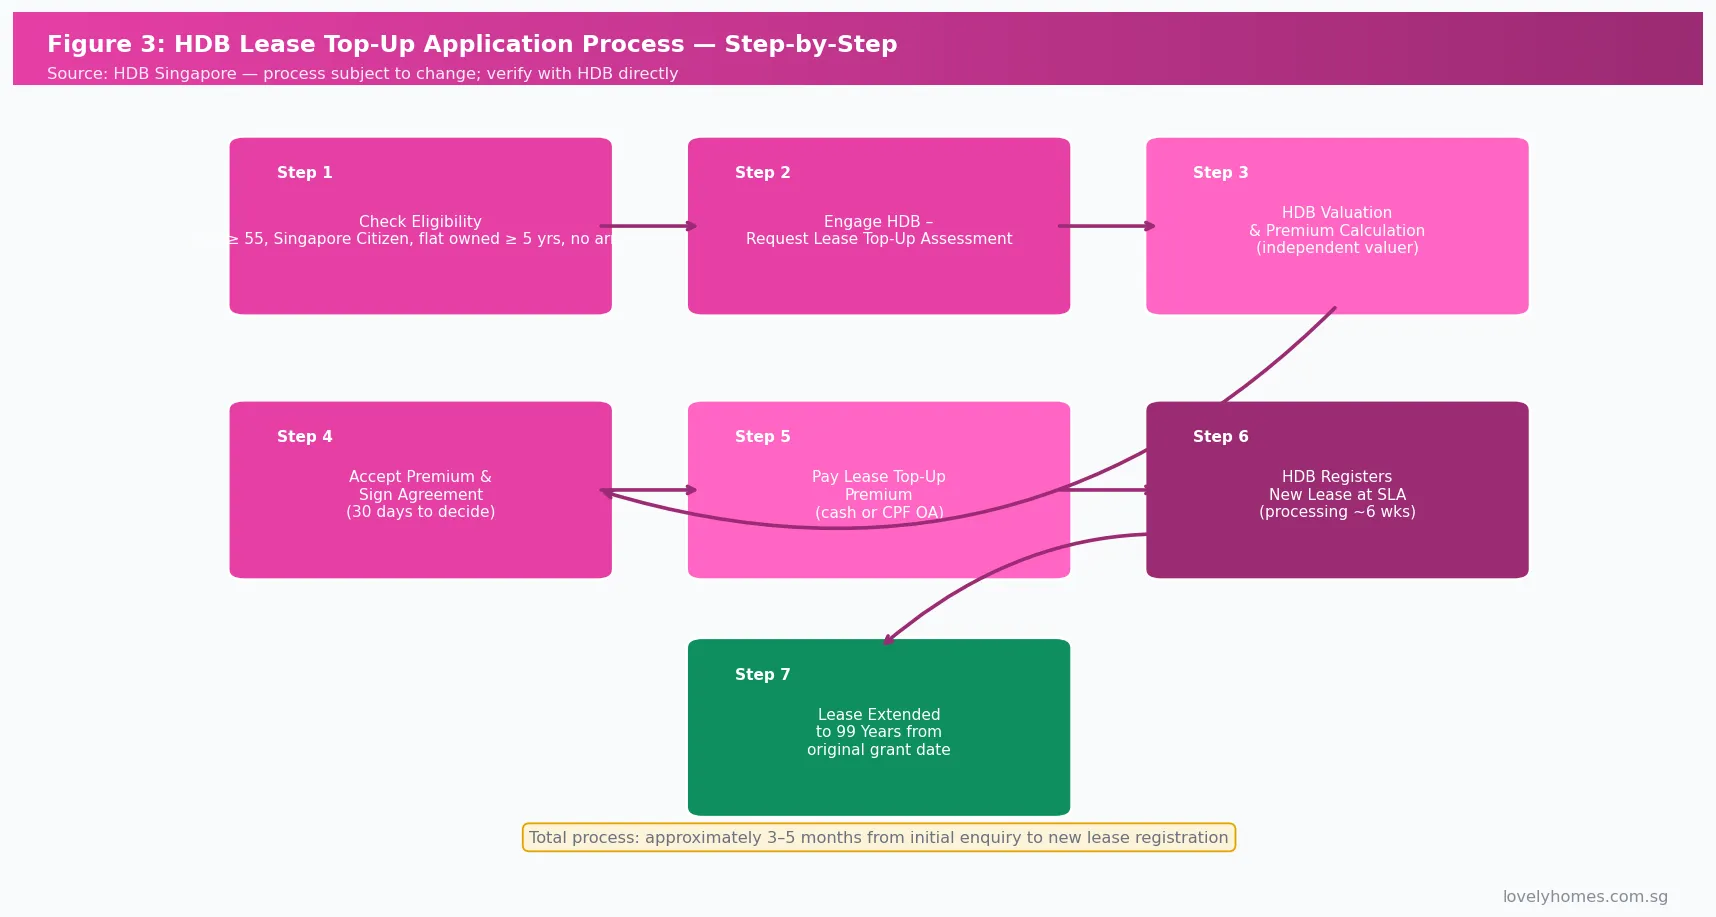
- Singapore HDB Lease Top-Up Guide 2026: Eligibility, Premium Costs and How to Apply
- Singapore HDB SERS Guide 2026: Selective En Bloc Redevelopment, Compensation Explained
Disclaimer: The information in this article is for general educational purposes only and does not constitute financial, investment, or legal advice. HDB resale flat prices, Resale Price Index figures, grant amounts, and loan parameters are subject to change. Always verify current data directly with the Housing and Development Board (hdb.gov.sg), CPF Board (cpf.gov.sg), IRAS (iras.gov.sg), and the Monetary Authority of Singapore (mas.gov.sg). Property transactions involve significant sums — engage a licensed housing agent accredited by the Council for Estate Agencies (CEA) and a solicitor for conveyancing before committing to any purchase.
Click anywhere to close