Buying a Condo in Singapore 2026: OTP, Stamp Duties, TDSR and Step-by-Step Process Explained
Click anywhere to close
- Any Singapore Citizen (SC), Permanent Resident (SPR), or foreigner may buy a private condominium — no eligibility restrictions apply beyond the owner-occupier requirement lifted for private property.
- Bank loans cover up to 75% LTV; minimum cash downpayment is 5% of purchase price; the remaining 20% may come from CPF OA.
- Total Debt Servicing Ratio (TDSR) cap: 55% of gross monthly income. No Mortgage Servicing Ratio (MSR) applies to private property.
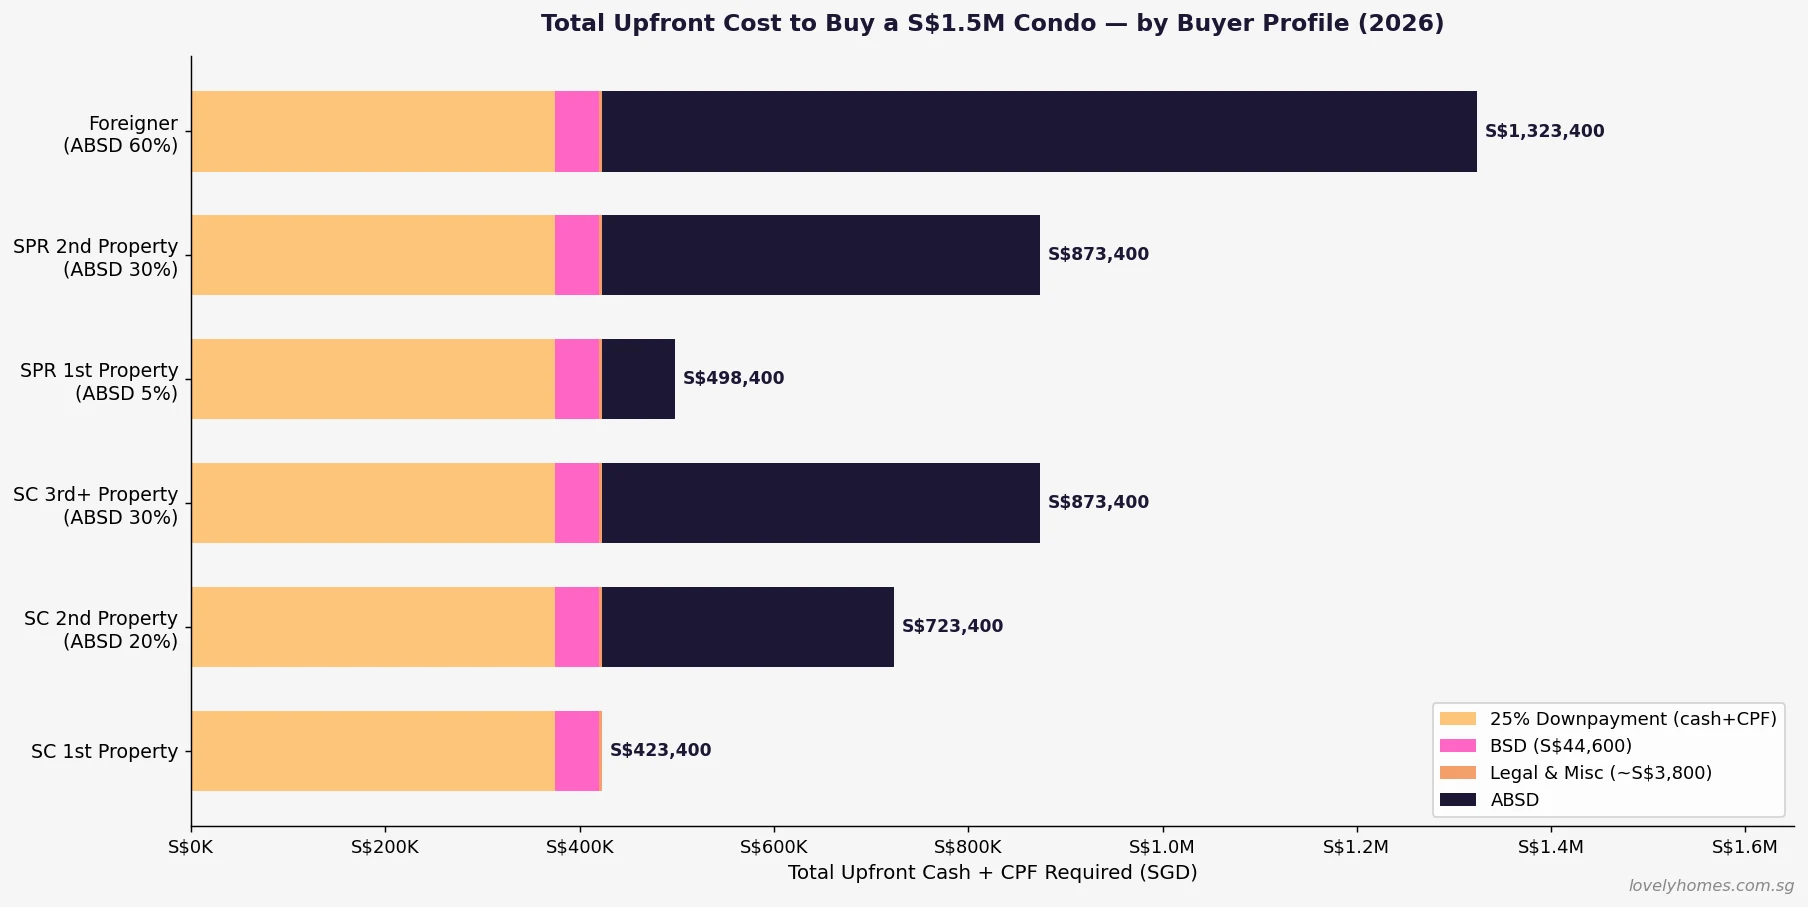
- Buyer’s Stamp Duty (BSD) is payable by everyone: S$44,600 on a S$1.5M condo; S$69,600 on S$2.0M.
- Additional Buyer’s Stamp Duty (ABSD): 0% for SC buying their first property; 20% for SC second property; 60% for foreigners.
- For resale condos, the Option to Purchase (OTP) process runs 14 days; completion typically 70–90 days. New launch condos use a booking fee/S&P process taking 8–12 weeks to first payment milestone.
- Condo prices range from roughly S$700K (OCR 1BR) to S$6.5M+ (CCR 4BR) in 2026.
- No Capital Gains Tax applies in Singapore — profits on sale are generally tax-free (Seller’s Stamp Duty applies if sold within 4 years).
A private condominium is the most aspirational stepping stone in Singapore’s property ladder. It represents the point at which a buyer exits the HDB framework — and its attendant rules — and enters the open market. Yet the process of buying a condo, especially for first-timers, involves a layer of documents, timelines, and financial calculations that can feel daunting. This guide walks through every stage: from eligibility and financing, to the Option to Purchase (OTP), stamp duties, CPF rules, and what you will actually pay before you get the keys.
All figures are current as at 11 June 2026. Regulations on loan-to-value (LTV), TDSR, and stamp duties are set by the Monetary Authority of Singapore (MAS), the Inland Revenue Authority of Singapore (IRAS), and the CPF Board respectively.
Who Can Buy a Condo in Singapore?
Private condominium units are open to all buyers regardless of citizenship or residency status — Singapore Citizens, Singapore Permanent Residents, and foreigners may all purchase. There is no income ceiling, no minimum occupation period restriction prior to purchase, and no ethnic integration quota. The key constraints are purely financial: ABSD rates, LTV limits, and TDSR/income requirements.
One constraint that often surprises first-time private buyers: if you currently own an HDB flat, you must dispose of it within six months of taking possession of the condo (if you are an SC) — failing to do so means you will have paid 20% ABSD on the condo and will face IRAS penalties. This “sell first” obligation is the operational heart of the Singapore upgrader journey and we cover it in detail in our HDB Upgrading Guide 2026.
Condo Price Ranges in Singapore 2026
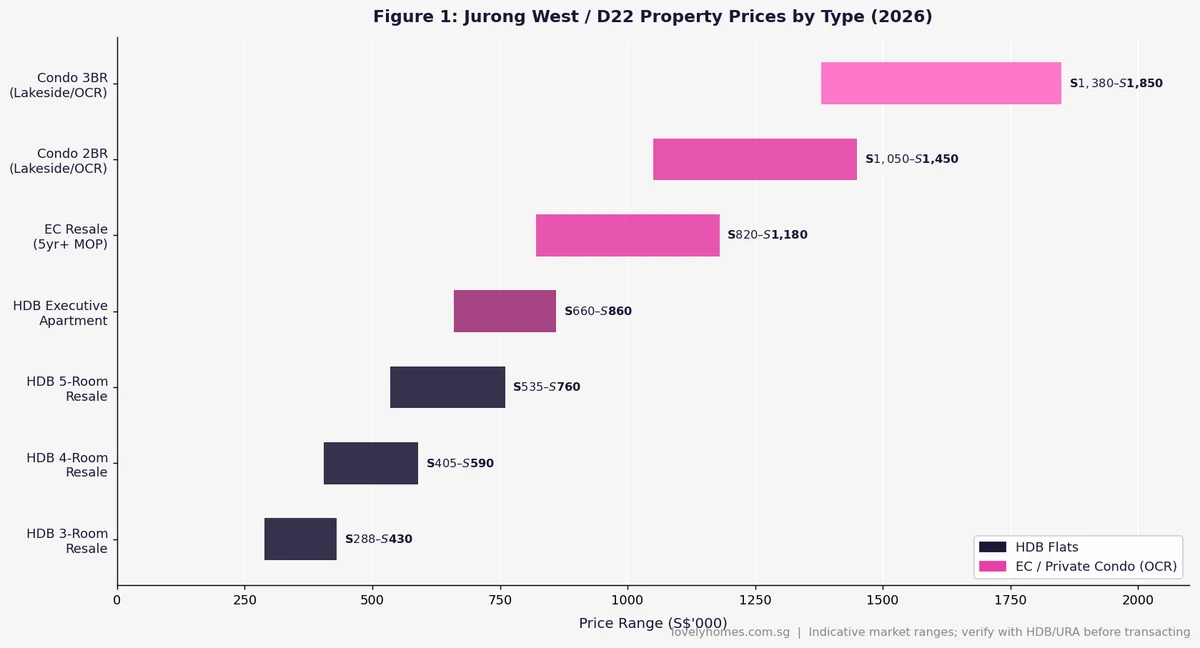
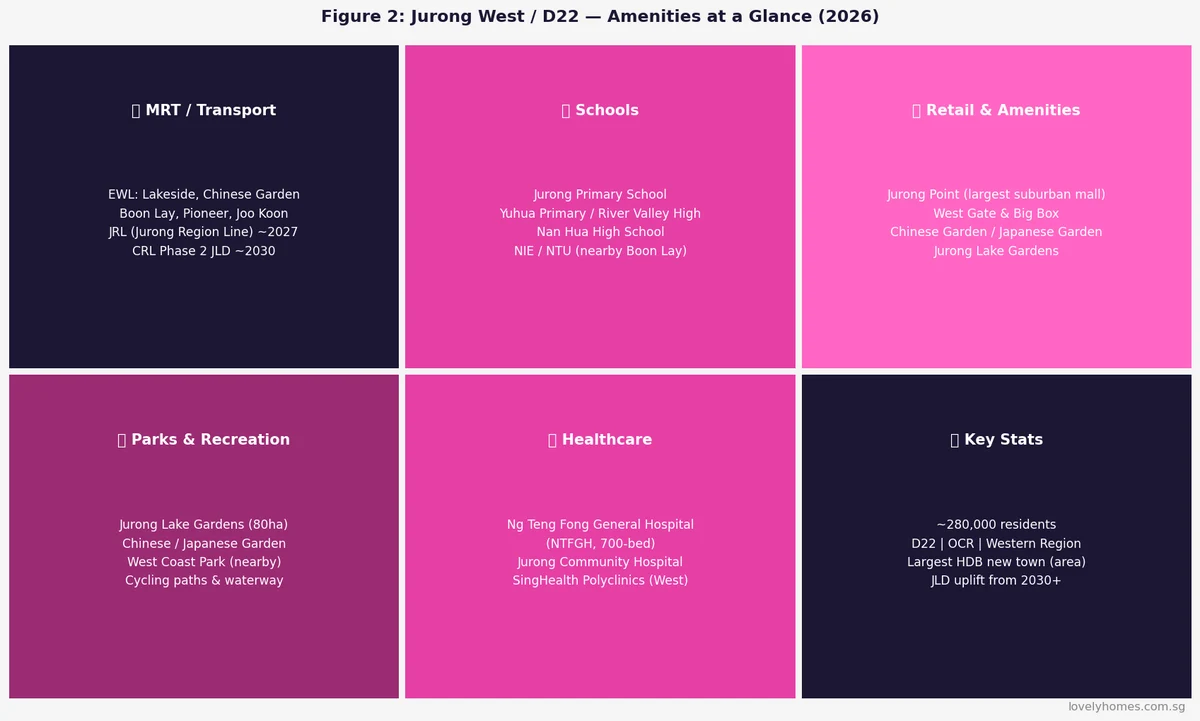
Prices vary dramatically by location. Singapore’s private residential market is segmented into three main regions: Outside Central Region (OCR), Rest of Central Region (RCR), and Core Central Region (CCR). OCR encompasses the heartland suburbs — Tampines, Sengkang, Jurong, Punggol. RCR covers the city fringe — Queenstown, Toa Payoh, Bishan, Eunos. CCR is prime — Districts 9, 10, 11, Marina Bay, Sentosa.
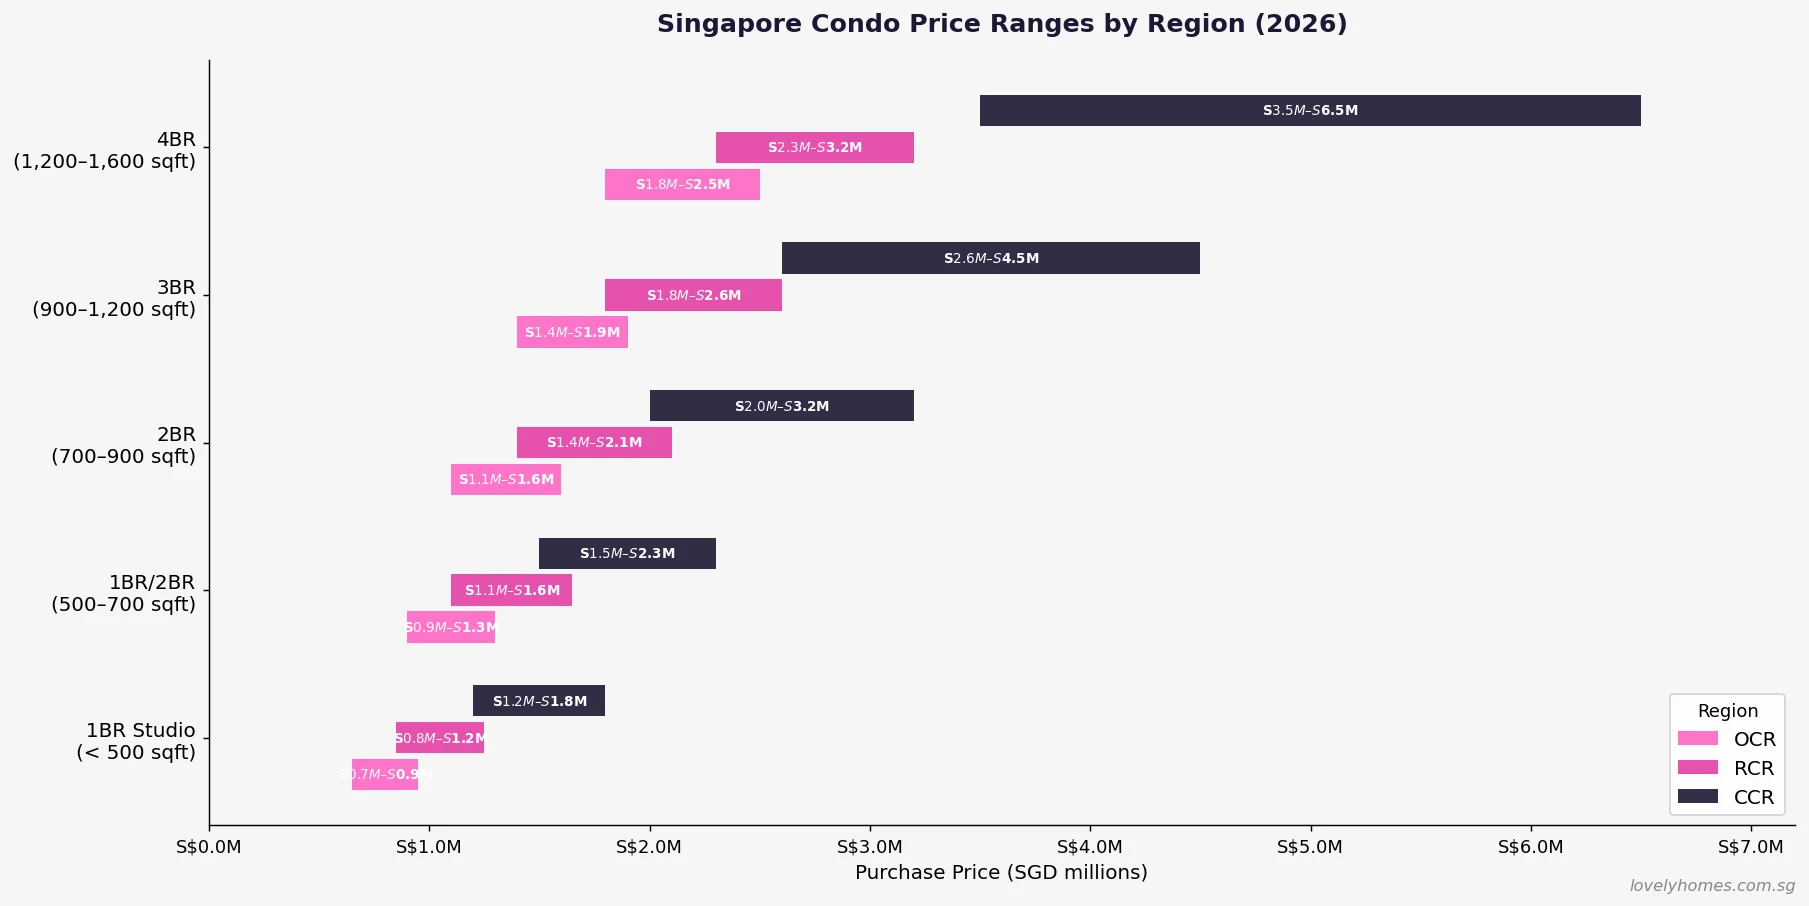
For a 3-bedroom unit in 2026, an OCR condo typically transacts at S$1.4M–S$1.9M; the same unit in the CCR can reach S$2.6M–S$4.5M or beyond for prime addresses. New launches carry a new-launch premium over resale units of roughly 5–15% in most districts.
New Launch vs Resale: Key Differences
The most fundamental decision before buying a condo is whether you are looking at a new launch (bought directly from the developer, often before the building is complete) or a resale unit (bought from a private seller on the open market).
New launches are typically launched with deferred payment: a booking fee of 5% (cash only), then 15% at S&P signing (within 8 weeks), then progressive payments tied to construction milestones. You take possession 3–5 years after booking. During that period, no rental income and no physical inspection of the unit. The upside: you lock in today’s price and CPF/mortgage cashflow spreads across years. Developers often offer stamp-duty absorption or furniture voucher promotions on slow-moving units.
Resale condos are completed units. You can inspect them, move in within 10–12 weeks of OTP exercise, and rent them out immediately. The OTP process involves a 1% option fee, followed by 14 days to decide and exercise. On exercise, you pay a further 4% (totalling 5% of purchase price), then complete within 70–90 business days.
| Feature | New Launch | Resale Condo |
|---|---|---|
| Payment structure | Progressive (booking fee → milestones) | Full 5% on OTP + balance at completion |
| Time to possession | 3–5 years (from booking) | 10–12 weeks from OTP exercise |
| Physical inspection | Show unit only (not actual unit) | Full inspection possible |
| Rental income | Only after TOP (3–5 years) | Immediately after completion |
| CPF + loan drawdown | Progressive during construction | Full drawdown at completion |
| SSD risk | Only on re-sale within 4 years of TOP | Applies if sold within 4 years of purchase |
| Price premium vs resale | Typically +5–15% for comparable location | Benchmark price |
| Renovation needed? | Bare unit; full reno required | Often move-in ready or partial reno |
The Condo Buying Process — Step by Step
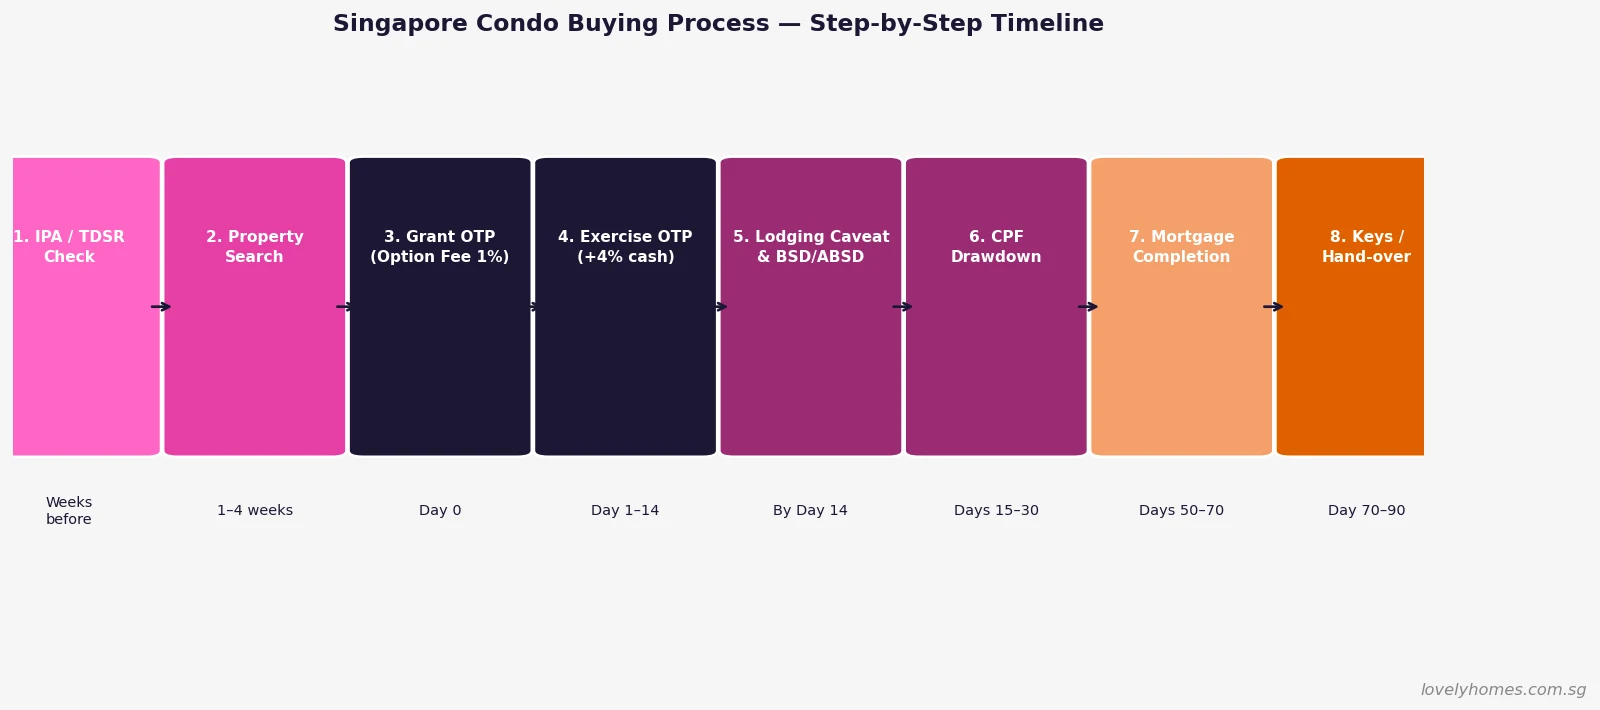
For a resale condo, the legal process is tightly choreographed:
Step 1 — Loan Pre-Approval (IPA). Before making any offer, obtain an In-Principle Approval (IPA) from your chosen bank. This confirms your borrowing capacity and signals seriousness to sellers. IPAs are valid for 30 days.
Step 2 — Property Search & Negotiation. View units, compare recent caveats on URA’s Real Estate Information System (REALIS), and negotiate the price. Once agreed, the seller’s representative issues the OTP.
Step 3 — Receive and Pay OTP Option Fee (1%). The option fee is typically 1% of the purchase price (negotiable for very high-value properties). This gives you the exclusive right to purchase for 14 days.
Step 4 — Exercise OTP (+ 4% cash). Within 14 days, your lawyers will advise you to exercise the OTP by paying the remaining 4% exercise fee (total 5% paid). At this stage, you engage a conveyancing lawyer if you haven’t already.
Step 5 — Stamp Duty: BSD + ABSD (within 14 days of OTP). Both BSD and ABSD must be stamped within 14 calendar days of signing the OTP. Late payment incurs IRAS penalties. BSD can be reimbursed from CPF post-stamping; ABSD must be paid in cash.
Step 6 — CPF Drawdown & Mortgage Disbursement. Your lawyers submit the CPF withdrawal application and lodge a caveat at the Singapore Land Authority (SLA). The bank releases the loan funds.
Step 7 — Completion (S&P / Transfer). Typically within 70–90 days of OTP exercise for a resale condo. Title transfers, keys are handed over.
Financing a Condo Purchase: LTV, TDSR and Loan Options
Private condo buyers borrow from commercial banks (not HDB). The key regulatory frameworks are:
Loan-to-Value (LTV) limits. For your first property mortgage with a bank: LTV 75%, meaning you can borrow up to 75% of the purchase price or valuation (whichever is lower). For a second property, LTV drops to 45%; third and subsequent to 35%. These MAS limits were last updated in August 2024, when the HDB loan LTV was reduced from 80% to 75%.
Total Debt Servicing Ratio (TDSR). No more than 55% of your gross monthly income may be committed to total debt obligations — home loan, car loan, credit card minimum payments, personal loans, all included. Banks apply a stress test interest rate of 4.0% (as at 2026) regardless of the actual offered rate, which is usually lower.
No MSR for private property. The Mortgage Servicing Ratio (MSR) — which caps housing loan payments at 30% of income — only applies to HDB flats and ECs bought from developers. Private condo buyers only need to satisfy TDSR.
Interest rates. Most banks in 2026 offer SORA-pegged packages (3-month SORA at approximately 2.4%) or fixed-rate packages. All-in rates for 30-year private property loans typically range 3.1%–3.8% in mid-2026. Always compare SIBOR-to-SORA transition implications with your relationship manager. More detail in our Singapore Home Loan Complete Guide 2026.
Stamp Duties: BSD and ABSD Explained
Every condo buyer pays Buyer’s Stamp Duty (BSD) — a progressive tax on purchase price. On top of that, ABSD applies for second-and-subsequent properties or non-citizens:
| Purchase Price | BSD Payable | Effective BSD Rate |
|---|---|---|
| S$800,000 | S$18,600 | 2.33% |
| S$1,200,000 | S$33,600 | 2.80% |
| S$1,500,000 | S$44,600 | 2.97% |
| S$2,000,000 | S$69,600 | 3.48% |
| S$2,500,000 | S$94,600 | 3.78% |
| S$3,000,000 | S$119,600 | 3.99% |
| S$4,000,000 | S$219,600 | 5.49% |
For ABSD, remember: SC 1st property = 0% ABSD; SC 2nd = 20%; SC 3rd+ = 30%; SPR 1st = 5%; SPR 2nd = 30%; Foreigner = 60% (all properties). Full details in our ABSD Complete Guide 2026.
Using CPF to Buy a Condo
Your CPF Ordinary Account (OA) may be used to pay the downpayment (the 20% non-cash portion) and ongoing monthly mortgage instalments for a private condo, subject to:
The Valuation Limit (VL): total CPF usage cannot exceed the lower of the purchase price or the valuation at the time of purchase — so if you pay S$1,650,000 for a condo valued at S$1,600,000, your CPF ceiling is S$1,600,000.
The Withdrawal Limit (WL): once you have drawn CPF up to the VL and still have an outstanding bank loan, you may draw a further 20% of VL provided you have set aside the applicable Basic Retirement Sum (BRS — S$106,500 in 2026) in your CPF accounts.
The 5% cash rule: the minimum 5% downpayment must be in cash. CPF may only fund the remaining 20% of the 25% total downpayment.
Critically: every dollar of CPF drawn for property accrues interest at 2.5% per annum compounding. When you eventually sell, you must refund the principal plus all accrued interest back to your CPF OA. This does not reduce your profit on paper, but it does reduce the cash you take home from the sale. Read the full analysis in our CPF Private Property Guide 2026.
Choosing Between OCR, RCR and CCR
The three-region framework is more than a price guide — it reflects fundamentally different buyer profiles, rental markets, and investment theses:
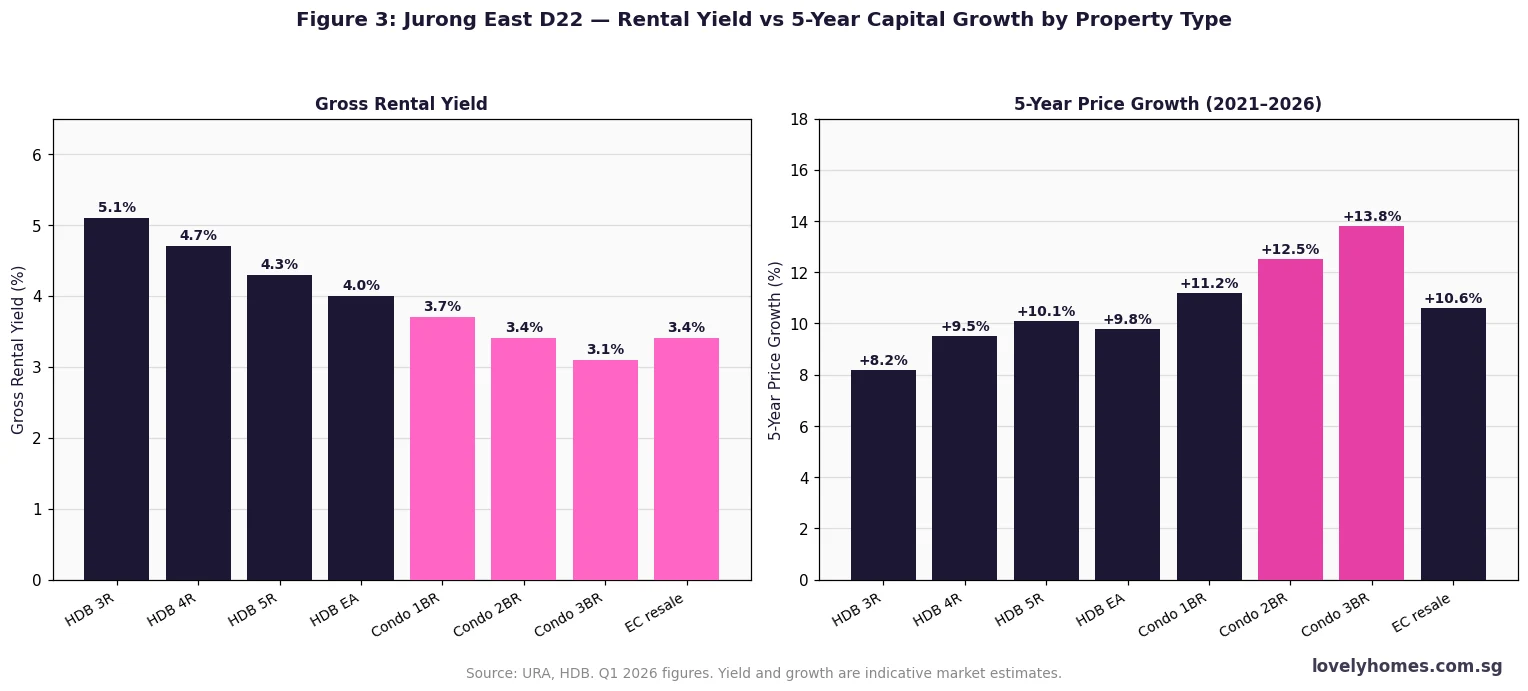
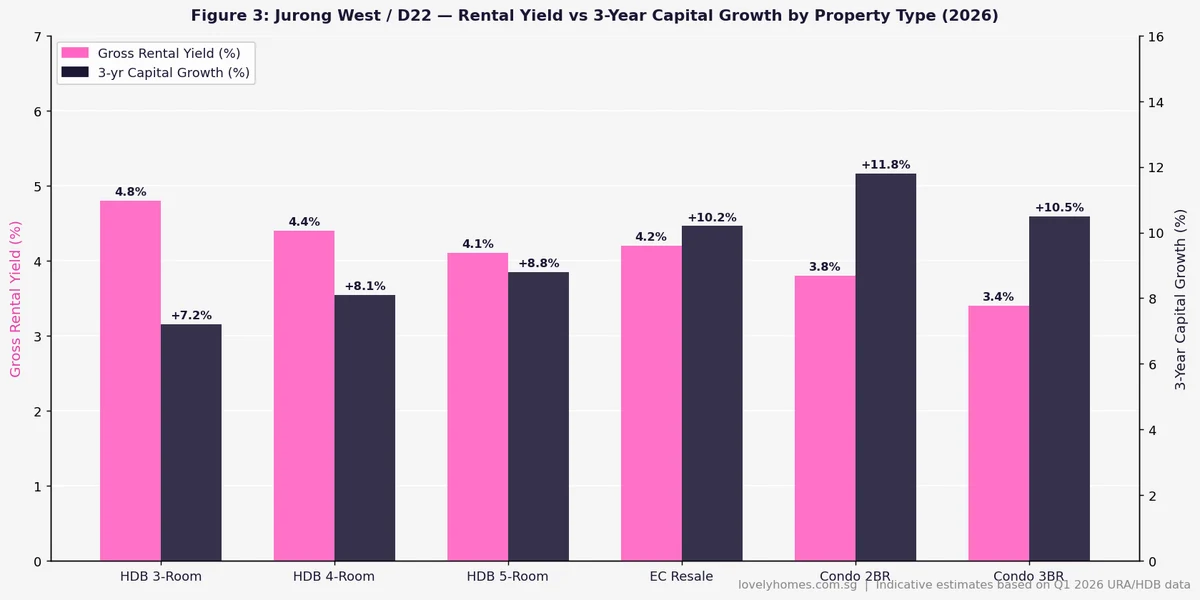
OCR (Outside Central Region) is where most Singaporean families and HDB upgraders buy. Yields are strongest here — typically 3.8%–4.8% gross for 2BR/3BR units — because rental demand from expats, young professionals, and domestic upgraders is broad. Capital appreciation can be rapid when an infrastructure catalyst (a new MRT line, a GLS announcement) lands nearby. The tradeoff: commute times to CBD are longer, and CCR-calibre tenants (senior bankers, diplomats) rarely rent in OCR.
RCR (Rest of Central Region) is the sweet spot for many: city-fringe convenience, more manageable entry prices than CCR, yet close enough to attract both expat and local renters. Districts 3, 10 (parts), 14, 15, 20 are all RCR. Yields run 3.2%–4.2%. New launches here have outperformed on price appreciation in the 2020–2026 run, driven by URA master-plan transformations (Queenstown, Kallang, Pearl’s Hill).
CCR (Core Central Region) is Singapore’s luxury and investment-grade market. Prices per square foot range from S$2,500 to S$5,000+ for prime District 9/10/11 addresses. Rental yields are the weakest (2.5%–3.5%) because asset values are high, but capital preservation in USD/GBP/EUR terms attracts significant foreign (FTA-exempt) and ultra-high-net-worth demand. The 60% ABSD has effectively handed CCR supply to the FTA-exempt buyer pool.
Worked Example: Mr & Mrs Chen Buy Their First Condo
Profile: SC couple, first private property, joint income S$16,000/mth
Property: 3-bedroom OCR condo in Sengkang, S$1,650,000. Freehold.
BSD: S$180K×1% + S$180K×2% + S$640K×3% + S$500K×4% + S$150K×5% = S$1,800 + S$3,600 + S$19,200 + S$20,000 + S$7,500 = S$52,100
ABSD: 0% (SC, first residential property)
Financing: Bank loan 75% LTV = S$1,237,500 @3.2% 30yr
Monthly repayment = approximately S$5,354/mth
TDSR = S$5,354 / S$16,000 = 33.5% — PASS (below 55% ceiling)
Downpayment (25%): S$412,500
— Cash (min 5%): S$82,500
— CPF OA (up to 20%): S$330,000
Total upfront outlay:
Downpayment: S$412,500
BSD (can reimburse from CPF after stamping): S$52,100
Legal & conveyancing fees: ~S$4,200
Grand total: ~S$468,800
Note on SSD: If the Chens sell within 4 years of purchase, SSD applies: 16% (Year 1), 12% (Year 2), 8% (Year 3), 4% (Year 4). They plan to hold long-term, so SSD is not a concern. Full details: SSD Guide 2026.
What This Means for Singapore Property Buyers in 2026
The private condo market in 2026 sits in a period of relative stability after the sharp price run of 2020–2023. URA’s private residential price index for Q1 2026 shows OCR prices up 1.1% quarter-on-quarter — moderate, not frothy. Interest rates, while above the near-zero era of 2010–2021, have stabilised: 3M SORA has hovered around 2.4% since late 2025. The TDSR and LTV framework means buyers are better-capitalised than in previous cycles.
For SC first-timers, the 0% ABSD window is exceptionally powerful: you can buy a S$1.6M condo and pay zero ABSD. Compare this to your SPR peer who pays 5% (S$80,000) or your foreigner colleague who pays 60% (S$960,000). Singapore citizenship carries extraordinary financial value in the property market — an advantage worth leveraging before your second purchase triggers the 20% ABSD.
What Might Come Next for the Condo Market
The Government’s track record on cooling measures is well-established: when private prices accelerate beyond what income growth can justify, additional rounds of ABSD increases, LTV tightening, or supply-side intervention (GLS increases) follow. The 2H2026 GLS programme announced in June 2026 adds approximately 4,010 private residential units to the Confirmed List — a signal that supply is being managed upward to prevent affordability deterioration.
Speculation (not official MAS guidance): if private price growth accelerates beyond 5–6% annually in the second half of 2026, the Government may revisit ABSD or TDSR thresholds, as it has done in April 2023. Buyers with strong holding power and clear owner-occupier intent are best insulated from policy risk; leveraged short-term investors should be especially mindful of SSD exposure within the four-year window.
Frequently Asked Questions
Can I buy a condo while still owning an HDB flat?
Yes — but with significant financial consequences. An SC who holds an HDB flat and buys a private condo will trigger 20% ABSD on the condo (second property rate), as they are deemed to hold two residential properties. To avoid ABSD, most upgraders adopt a “sell first, buy second” sequence, disposing of the HDB before exercising the condo OTP. Alternatively, the ABSD remission scheme allows an SC couple to buy a replacement home while still owning the first property, provided they sell the first within six months of the later of the condo’s purchase or its TOP date. See our full analysis in the HDB Upgrading Guide 2026.
Is there a minimum income to buy a private condo?
There is no statutory minimum income requirement. However, the TDSR framework means that your borrowing capacity — and therefore the price range you can access with a loan — is directly tied to gross income. A borrower with S$6,000/mth gross income is limited to a monthly mortgage payment of approximately S$3,300 (55% TDSR). At 3.2% over 30 years, that equates to roughly a S$762,000 loan. At 75% LTV, the maximum purchase price would be around S$1,016,000. Buyers with no debt obligations will find this headroom useful; those with car loans and credit card debt will find it tighter.
What is the difference between freehold and 99-year leasehold condos?
In Singapore, freehold (FH) and 999-year leasehold condos hold title in perpetuity, while 99-year leasehold (LH99) condos revert to the State at lease expiry. As a practical matter, a 99-year leasehold condo built today has roughly 92–95 years remaining — well within the CPF “cover to age 95” rule for most buyers. LH99 condos are typically 10–15% cheaper than equivalent freehold units, and price growth on LH99 units can be equally strong within the first 30 years. CPF usage becomes restricted once remaining lease falls below a threshold that does not cover the youngest buyer to age 95. Read more about lease decay implications in our related investment analysis.
Can I use CPF to pay ABSD?
No. ABSD (and BSD) must be paid in cash within 14 days of signing the OTP or S&P Agreement. However, you may apply to CPF Board to reimburse BSD from your OA after it has been stamped — so while the cash must flow out first, you can recover the BSD component from CPF. ABSD remains a pure cash cost and cannot be reimbursed from CPF.
What happens if I cannot exercise the OTP within 14 days?
If you fail to exercise the OTP within 14 days, the option lapses and the seller retains your 1% option fee as forfeiture. You have no further obligation to proceed with the purchase. If you have already stamped the OTP (i.e. paid BSD), you may apply to IRAS for a refund of part of the stamp duty paid — though this process involves fees and is not guaranteed. Always ensure your financing is in order before paying the option fee.
Is there Capital Gains Tax on condo profits in Singapore?
Singapore does not levy a Capital Gains Tax (CGT). Profits from the sale of a private condo are generally not taxable, provided the activity is not deemed a trade (i.e. you are not treated as a property dealer by IRAS). The exception is the Seller’s Stamp Duty (SSD) — introduced as a transaction deterrent — which applies at 16%/12%/8%/4% if you sell within 4 years of purchase respectively. Beyond the four-year holding window, there is no SSD and no CGT. See our detailed SSD Guide 2026.
Can a foreigner buy a condo in Singapore, and how much does it cost?
Yes — foreigners may purchase private condominium units without restrictions (other than ABSD). However, the ABSD rate for foreigners is 60% of the purchase price or valuation (whichever is higher). On a S$1.5M condo, that is S$900,000 in ABSD alone, on top of BSD of S$44,600. Citizens of Iceland, Liechtenstein, Norway, Switzerland, and the United States are entitled to Singapore Citizen ABSD rates under Free Trade Agreement provisions — so an American buying their first Singapore condo pays 0% ABSD. Our Foreign Buyer Guide 2026 covers the full picture.