Singapore Property as a Safe Haven in 2026: What the URA Data Shows Amid Global Uncertainty
As trade tensions, currency volatility and geopolitical fractures reshape capital allocation globally, Singapore’s residential property market is drawing renewed attention from high-net-worth investors. This analysis examines what the data actually shows — and what it does not.
Quick Answer
- Singapore’s private residential price index rose 0.3% quarter-on-quarter in Q1 2026, per URA flash estimates, with the OCR leading at +1.3% — a measured performance that belies the “booming market” narrative in some international headlines.
- The CCR (Core Central Region) — the segment most exposed to foreign UHNW demand — has appreciated modestly but steadily since Q1 2024, driven by wealth-preservation flows from Europe, the Middle East and Southeast Asia.
- Singapore’s 65% ABSD for foreign buyers, introduced in April 2023, has not reversed this structural demand — it has filtered out speculative short-term buyers while leaving long-horizon wealth-preservation purchasers largely undeterred.
- The Asia-Pacific UHNW population grew by approximately 24.8% between 2021 and 2026, generating a larger pool of potential buyers even at elevated ABSD rates.
- Singapore’s macroeconomic fundamentals — GDP growth forecast 2–4% in 2026, inflation ~1–2%, MAS-managed SGD, AAA sovereign credit — underpin the safe-haven thesis more than any single property market metric.
- Key risks: rising private housing completions in 2026–2027, softening HDB resale prices, and TDSR constraints limiting domestic upgrader demand.
The Global Context: Why Investors Are Looking at Singapore
In the first quarter of 2026, global financial markets contended with renewed trade tensions, a volatile US dollar and a broader reassessment of risk assets in key emerging-market economies. Against this backdrop, Singapore has attracted significant commentary as a potential beneficiary of capital-flight demand.
Singapore offers a stable rule-of-law jurisdiction under the Singapore Land Authority and the Urban Redevelopment Authority; transparent property transaction records through the URA’s caveat system; a currency managed by MAS under a nominal effective exchange rate framework that has historically appreciated against peer currencies during risk-off periods; and a property market with deep liquidity in the resale condominium segment.
What Singapore does not offer — and this is the corrective that international analysis sometimes omits — is a low-friction entry for foreign buyers. The 65% ABSD on any residential property purchased by a non-Singapore national (excluding US/Iceland/Liechtenstein/Norway/Swiss nationals who receive SC-equivalent rates under FTA arrangements) means the effective purchase premium is extraordinary. A S$5M CCR condominium purchased by a foreign buyer carries an ABSD bill of S$3.25M, bringing total acquisition cost to approximately S$8.43M. That is the price of safe-haven status in Singapore.

What the URA Data Actually Shows
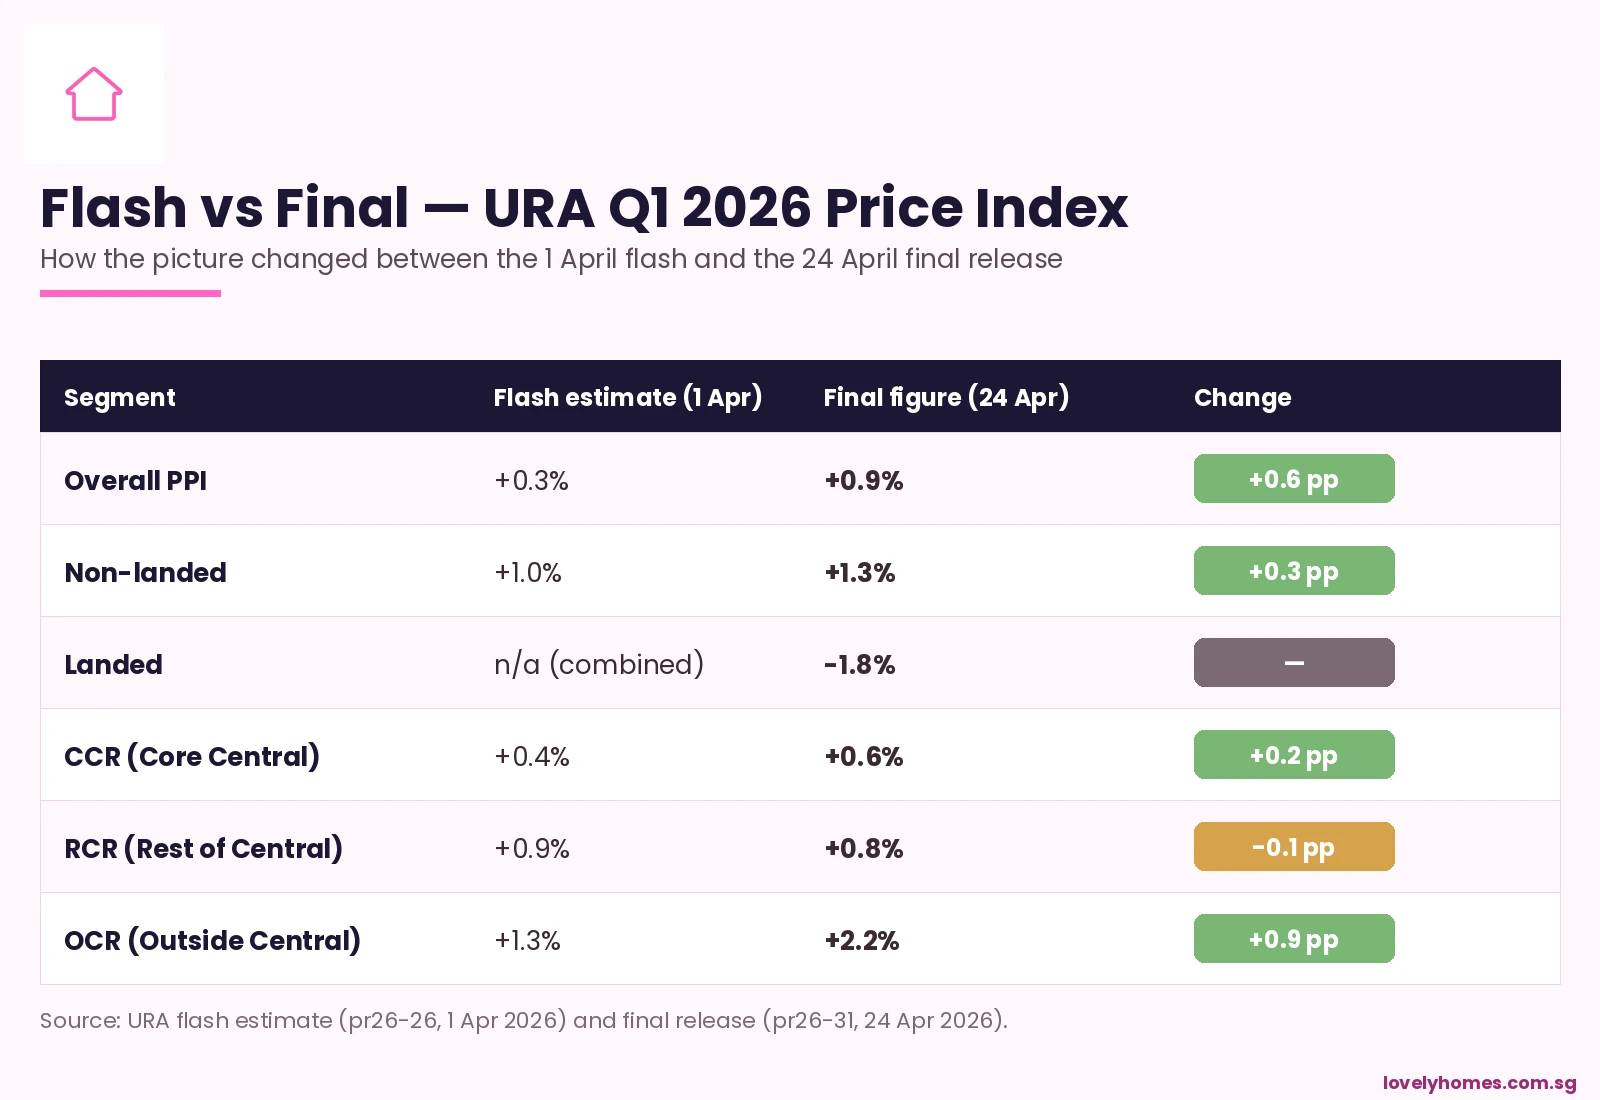
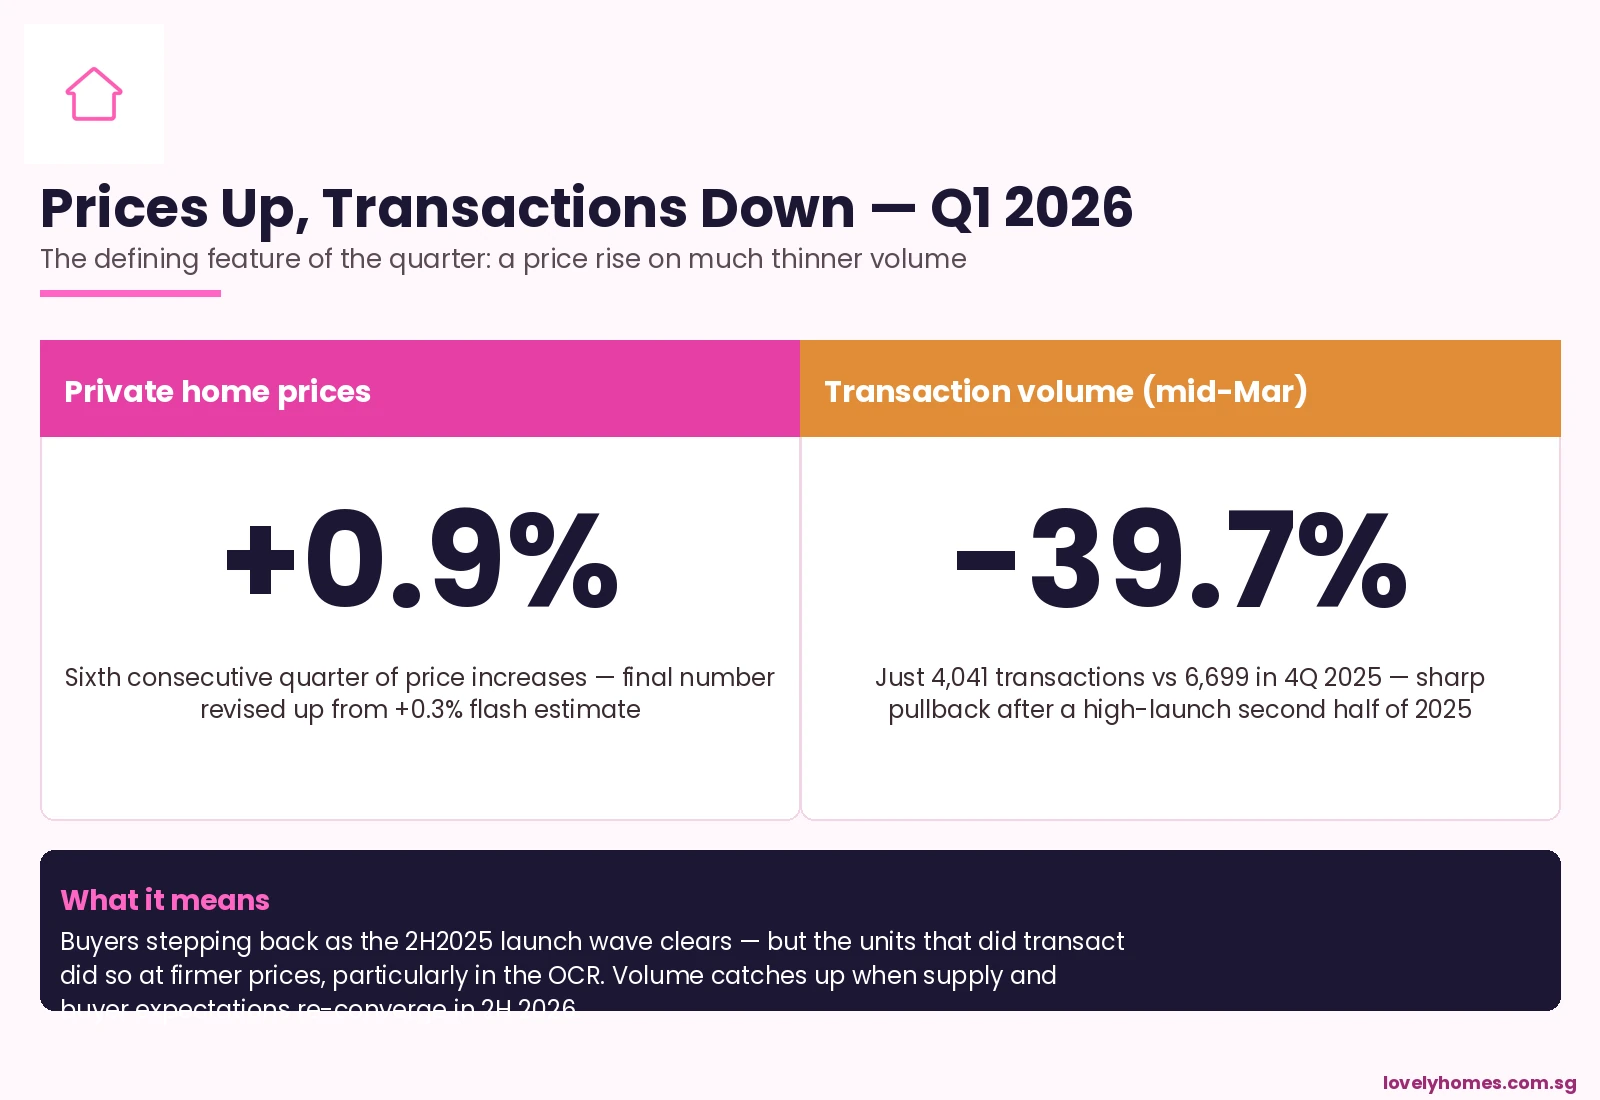
URA’s Q1 2026 release (pr26-31, 25 April 2026) reported an overall private residential price increase of 0.3% q-o-q, down from 0.6% in Q4 2025. The sub-regional breakdown: OCR +1.3% (domestic upgrader and new-launch driven); RCR +0.9% (mid-tier, mix of domestic and regional demand); CCR +0.4% (internationally exposed, softest performer). Transaction volume softened to ~4,041 caveats in Q1 2026, 39.7% below Q4 2025’s 6,699 — a seasonal correction amplified by Chinese New Year, not a structural demand collapse.
UHNW Demand: Real But Measured

Asia-Pacific UHNW population growth of ~24.8% between 2021 and 2026 has expanded the pool of potential buyers even at elevated ABSD rates. For buyers at this wealth tier, the 65% ABSD may represent an acceptable price for: no inheritance tax (abolished 2008), no capital gains tax on property, political neutrality in a fractured geopolitical environment, and world-class infrastructure supporting family relocation. The volume of such buyers is small — perhaps 200–400 transactions annually in the CCR above S$3M — but their price-setting impact is disproportionate.
Structural Safeguards: Why Singapore’s Market Is Different
Singapore’s residential market benefits from structural safeguards that collectively reduce speculative volatility: MAS property loan rules (TDSR 55%, LTV 75%/45%, MSR 30%) enforced since 2013; Sellers’ Stamp Duty (12%/8%/4% on years 1–3) that eliminates short-horizon flipping; URA’s calibrated GLS programme managing supply against demand signals; and an approximately 90% homeownership rate among resident households providing a stable owner-occupier base. Taken together, these mechanisms make Singapore’s residential market more resistant to sharp price swings than most international comparators.
Summary: Singapore Property Safe Haven — Key Metrics at a Glance
| Indicator | Singapore (Q1 2026) | Context |
|---|---|---|
| Overall private residential price growth (q-o-q) | +0.3% | Source: URA pr26-31 |
| OCR price growth (q-o-q) | +1.3% | Strongest sub-market Q1 2026 |
| CCR price growth (q-o-q) | +0.4% | UHNW-exposed segment — stable |
| ABSD for foreign buyers | 65% | Effective since 27 April 2023 (IRAS) |
| ABSD for FTA nationals (US/CH etc.) | SC rates (0–30%) | Only 5 nationalities qualify |
| Capital gains tax on property | None | Subject to IRAS badge-of-trade test |
| Sellers’ Stamp Duty (year 1) | 12% | Eliminates short-term flipping |
| SG GDP growth forecast 2026 | 2–4% | MAS macroeconomic review |
| Private residential pipeline (2025–2027) | ~40,000 units | Key supply-side risk to watch |
Worked Example: The UHNW Relocation Decision
A European technology entrepreneur, Ms K, relocating to Singapore on an Entrepreneur Pass targets a S$6M freehold 4BR unit in District 10. As a foreigner: ABSD 65% = S$3.9M. Total acquisition cost ~S$10.23M (plus BSD ~S$329,600 + legal). On a 10–15-year horizon, she foregoes yield (estimated gross yield 2.1%) and treats the property as a wealth-preservation vehicle. At a 3% annual SGD appreciation against EUR, the currency return alone adds S$2.4M over 10 years on a S$8M net asset position. For this buyer profile, the 65% ABSD is the cost of accessing the full Singapore safe-haven package — not a deterrent.
Key Risks to Watch
The safe-haven thesis for Singapore property in 2026 is credible but conditional. A synchronised global recession would pressure Singapore’s open economy (trade-to-GDP ratio above 300%), affecting employment, wages and domestic demand. The ~40,000-unit private residential completion pipeline for 2025–2027 could generate a supply overhang if demand softens concurrently. MAS’s higher-for-longer rate environment (effective mortgage rates 3.5–4.2%) keeps carrying costs elevated for leveraged buyers. And any relaxation of ABSD or TDSR rules — unlikely but not impossible — could paradoxically signal government concern about market weakness, dampening rather than stimulating confidence.
What Might Come Next
The URA April 2026 new home sales data (expected ~15 May 2026) will provide the next empirical test of whether OCR demand has been sustained after the strong Q1 new-launch take-up. If the April figure confirms momentum above 800–900 units sold, the safe-haven/OCR-upgrader thesis for 2026 looks intact. A print below 600 would flag a more cautious consumer posture and would likely see analysts revise full-year private residential price forecasts toward the lower end of the 3–5% annual range.
Frequently Asked Questions
Does the 65% ABSD apply to all foreigners buying Singapore property?
Yes, with one group of exceptions. Nationals of the United States, Iceland, Liechtenstein, Norway and Switzerland pay ABSD at Singapore Citizen rates under respective FTA provisions — 0% for first property, 20% for second, 30% for third and beyond. All other foreign nationals, including those on Employment Passes or Long-Term Visit Passes, pay 65% ABSD on any residential property purchase. The rate was set at this level effective 27 April 2023 by the Ministry of Finance and administered by IRAS.
Is Singapore property really capital gains tax free?
Singapore does not impose a capital gains tax. Gains from the sale of Singapore property are not taxed, provided the transaction is an investment rather than a trading activity. IRAS applies a “badges of trade” test (frequency of transactions, holding period, leverage, stated intent) to determine whether gains are assessable as income. For genuine long-hold investors, capital appreciation on Singapore property is effectively untaxed. This policy could change in future — investors should model scenarios that include a potential capital gains tax, which several peer jurisdictions have introduced in recent years.
How does Singapore compare to Hong Kong as a safe-haven property market?
Hong Kong reduced its Buyer’s Stamp Duty for non-permanent residents from 30% to 7.5% in February 2024 to revive its property market. Despite this, transaction volumes and prices in Hong Kong’s residential market have remained subdued, weighed by political uncertainty, reduced expatriate headcount and weak domestic economic confidence. Singapore, by contrast, has maintained its cooling measures and seen stable, positive price growth. Many international investors currently rate Singapore above Hong Kong for residential real estate, given rule-of-law certainty, financial-sector depth and the SGD’s track record of appreciation.
Can a Singapore PR benefit from safe-haven demand dynamics?
Yes, indirectly. PRs purchasing their first residential property in Singapore pay 5% ABSD — a fraction of the foreigner rate. If global uncertainty continues to drive wealth flows into Singapore, demand-support effects on CCR and RCR prices benefit all existing property owners, including PRs. PRs also benefit from the SGD’s safe-haven appreciation effect in their overall balance sheet if they hold Singapore-denominated assets. A PR who became a Singapore Citizen before purchasing a second property saves 25 percentage points in ABSD (0% SC first property vs 5% PR + 25% differential on second).
What are the most sought-after districts for UHNW foreign buyers in 2026?
Districts 9 (Orchard, River Valley), 10 (Tanglin, Bukit Timah, Holland) and 11 (Novena, Thomson) remain the primary targets for UHNW foreign buyers in Singapore’s CCR. Sentosa Cove (District 4) is the only area where foreigners may purchase landed property without separate government approval — though its pricing and yield dynamics are highly specific. D9 and D10 freehold condominiums with full-facility buildings in the S$5M–S$15M range have seen the most sustained foreign interest in 2025–2026 per URA caveat data.
Related Articles
- ABSD Singapore 2026: Complete Guide to Additional Buyer’s Stamp Duty
- Foreigner Property Buyer Singapore 2026: What You Can Buy
- Singapore REITs vs Direct Property Investment 2026
- Rental Yield Singapore 2026: Gross, Net and Location-Adjusted Yields
- Sellers’ Stamp Duty (SSD) Singapore 2026
- Landed Property Singapore 2026: Types, Who Can Buy, ABSD and Prices
Disclaimer: This article is a news analysis and commentary piece, not financial or investment advice. Data cited from URA, HDB, MAS and IRAS as at Q1–Q2 2026. ABSD rates, tax policies and MAS regulations are subject to change. Readers should consult a MAS-regulated financial adviser, a licensed property agent and qualified legal counsel before making any property investment decision. Foreign nationals should also obtain independent legal advice on residency, visa and tax implications in their home jurisdiction before purchasing Singapore property.