Singapore Property Investment Strategy 2026: Rental Yields, Capital Gains and Net Returns

Singapore Property Investment Strategy 2026: Rental Yields, Capital Gains and Net Returns

Quick Answer: Singapore Property Investment Strategy 2026

  • Singapore property gross rental yields range from 2.5% (CCR condos) to 4.8% (shophouse/commercial) — HDB flats offer the highest residential yields in 2026.
  • Capital appreciation since 2019 has been strongest in HDB resale (7.2% pa) and landed (6.1% pa), well ahead of CCR condominiums (3.5% pa).
  • The biggest drag on investor returns is ABSD: Singapore Citizens buying a 2nd property pay 20% — S$360,000 on a S$1.8M purchase — payable in cash only, not CPF.
  • After ABSD amortised over 10 years plus all operating costs, an OCR condo investor nets roughly S$44,000/yr total return — only if the property appreciates at ~4% pa.
  • Singapore Citizens on a first property (0% ABSD) and PRs on a first property (5% ABSD) enjoy meaningfully better net returns — estimated at 4.7% and 4.3% pa respectively.
  • S-REITs offer property exposure without ABSD or illiquidity, distributing 5.5–6.5% annually in 2026.
  • Record GLS supply (9,320 Confirmed-List units for 2026) could soften OCR/RCR prices by 2027 — monitor before committing at today’s entry prices.

Why Singapore Property Remains a Core Investment

Singapore’s property market has delivered consistent long-term returns since the Republic’s founding. Land is finite — the city-state covers just 720 square kilometres — yet it anchors a population approaching six million, a global financial hub, and one of the world’s busiest ports. This structural scarcity underpins values across all residential and commercial segments, and has historically cushioned the market against the deeper corrections seen in comparably-sized cities elsewhere in Asia.

The country’s legal and institutional framework adds a second pillar of confidence. Clear Torrens-system land titles, an independent judiciary, and the absence of capital controls make Singapore one of the few markets where property ownership has proved reliably secure across multiple economic cycles. Foreign institutional capital continues to flow into commercial and luxury-residential segments even at the 65% ABSD rate introduced in April 2023 — a telling signal of long-term conviction despite the punitive entry cost.

For Singapore Citizens and Permanent Residents, however, the investment case has shifted materially since the April 2023 cooling measures. A Singapore Citizen buying a second residential property now pays a 20% Additional Buyer’s Stamp Duty (ABSD), charged on the purchase price and payable entirely in cash within 14 days of exercising the Option to Purchase (OTP). On a S$1.8 million OCR condominium — modest by 2026 standards — that is S$360,000 in upfront tax. The critical question every investor must answer is: do the returns justify this cost?

Gross Rental Yields by Segment

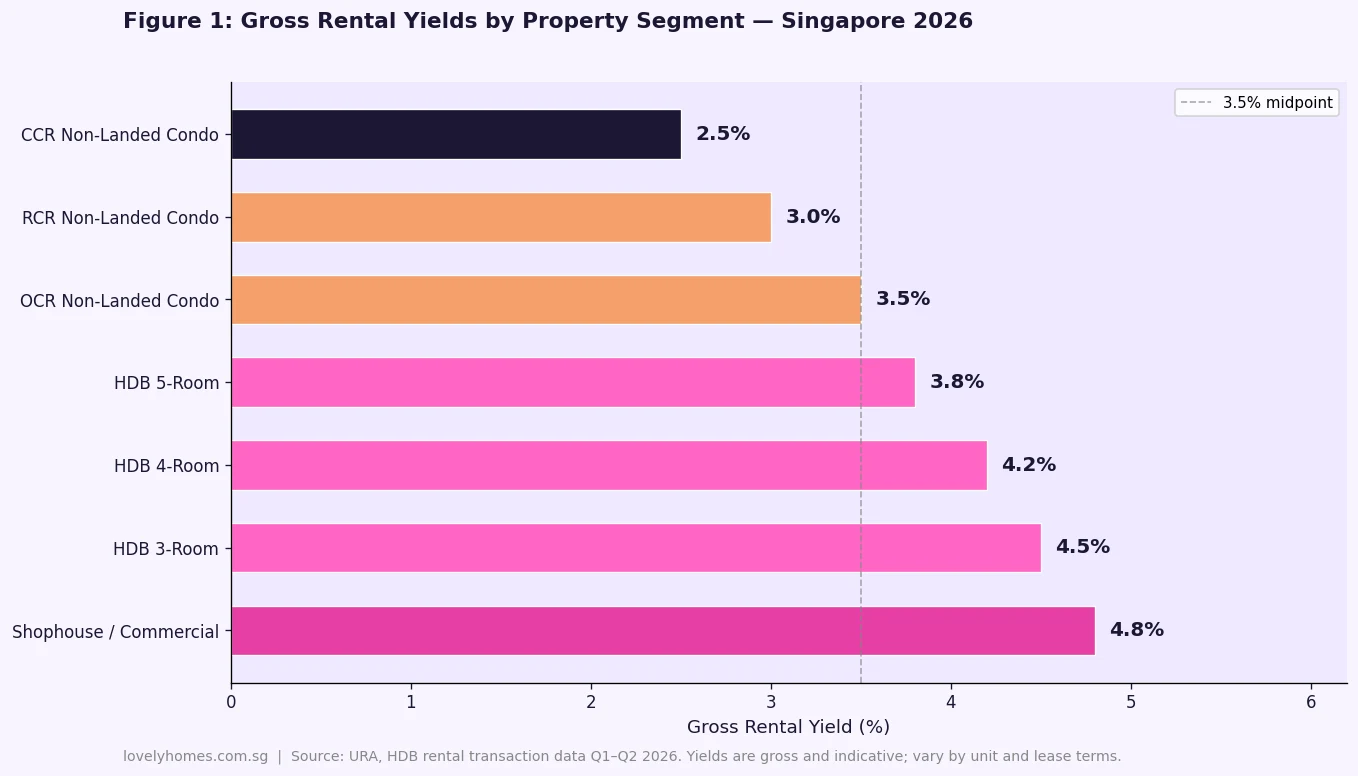
Gross rental yield — annual rent divided by purchase price — is the simplest measure of a property’s income productivity before expenses. It varies significantly across Singapore’s property segments, reflecting both the absolute price level of each asset class and the depth and quality of tenant demand.
Gross rental yields by property segment Singapore 2026 horizontal bar chart
Figure 1: Gross rental yields by property segment, Singapore 2026. Shophouses lead at 4.8%; CCR non-landed condos trail at 2.5%. Source: URA, HDB rental transaction data Q1–Q2 2026. Yields are gross and indicative; they vary materially by unit, location, and lease terms.

HDB flats achieve the highest gross yields among residential assets — typically 3.8%–4.5% depending on flat type — because their purchase prices are substantially lower than private condominiums, while rents in mature estates are broadly competitive. A 4-room flat in Toa Payoh, Queenstown, or Bishan renting at S$2,500–S$3,000 per month on a resale price of S$600,000–S$750,000 generates a 4.0%–4.8% gross yield. The caveat is that HDB rental requires HDB approval, and subletting rules — including approved tenant nationalities and minimum lease terms — are more restrictive than private property.

OCR non-landed condominiums sit at approximately 3.5% gross. A 2-bedroom unit in the Tampines, Jurong, or Punggol corridors renting for S$3,200–S$4,000 per month against a purchase price of S$1.1M–S$1.4M falls comfortably in this range. RCR condominiums yield around 3.0%, reflecting higher per-square-foot prices and a somewhat more transient tenant pool. CCR condominiums trail at 2.5%, as their elevated pricing limits the universe of tenants who can afford market-rate rents in the core central region.

Shophouses and commercial units lead all segments at approximately 4.8%, but they come with critical caveats: minimum purchase prices of S$3M–S$15M, limited liquidity, specialist buyer pools, and very different stamp duty treatment — residential ABSD does not apply to commercial purchases, which materially skews headline yield comparisons.

Capital Appreciation by Segment: 2019–2026

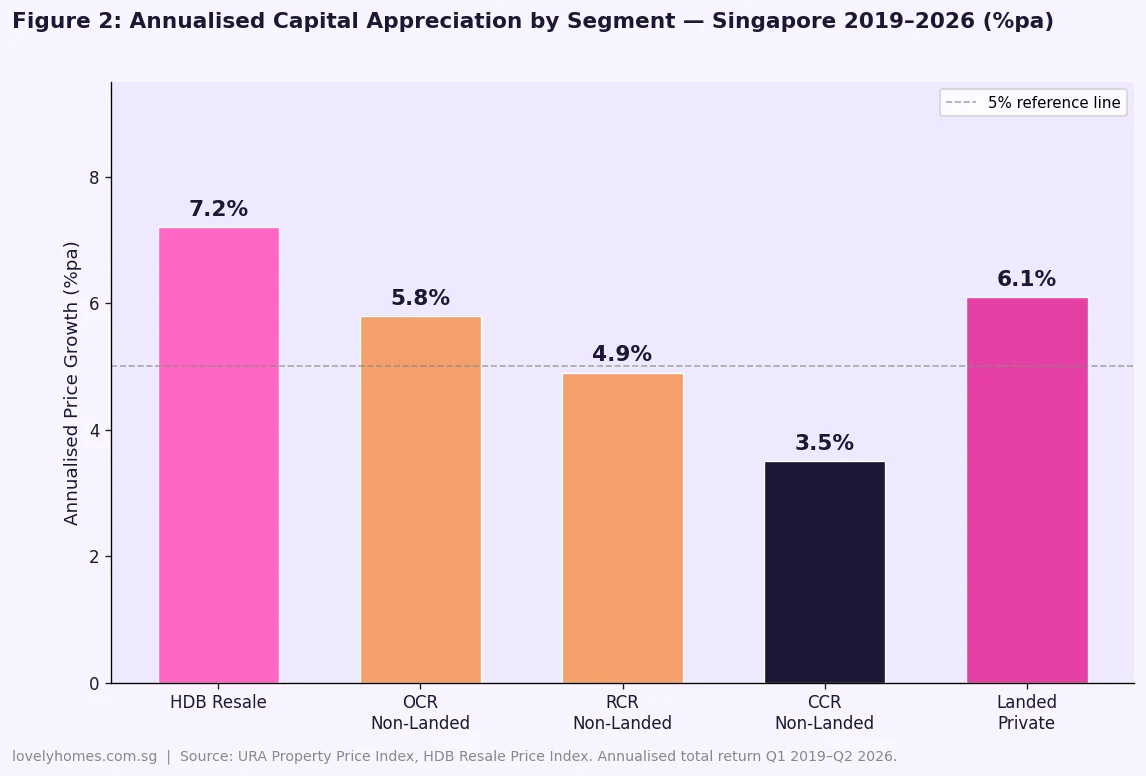
Rental income rarely explains why Singaporeans commit such large sums to direct property ownership. The real prize — historically — has been capital appreciation. The chart below shows annualised price growth across segments from Q1 2019 to Q2 2026 flash, covering the post-COVID boom and the subsequent cooling-measure moderation.
Annualised capital appreciation Singapore property segments 2019 to 2026 bar chart
Figure 2: Annualised capital appreciation by segment, Singapore 2019–2026. HDB resale leads at 7.2% pa; CCR non-landed trails at 3.5% pa. Source: URA Property Price Index, HDB Resale Price Index Q1 2019–Q2 2026 flash estimate.

The HDB resale segment’s 7.2% annualised gain is the most striking figure in the landscape. This reflects a chronic undersupply of resale flats in mature estates, persistent demand from first-time buyers who did not win a BTO ballot and are paying market price, and the government grant structure that pulls purchasing power from a wide income band into the same finite pool of homes.

Landed property at 6.1% pa reflects equally constrained supply — Singapore’s landed housing stock is constitutionally protected in most districts, and titles cannot be subdivided below minimum plot sizes. OCR non-landed private property at 5.8% has been propelled by the HDB upgrader pipeline: Singapore Citizens who have served their Minimum Occupation Period and graduated to private ownership. That demographic funnel, fed by BTO completions from 2018–2022 and the elevated HDB resale market of 2021–2024, has proved remarkably durable.

CCR’s more modest 3.5% pa gain reflects both the segment’s higher price base and the disproportionate impact of the 65% foreign ABSD — raised from 30% in April 2023 — on CCR demand, which had historically skewed towards foreign investors and expatriate purchasers.

The ABSD Impact: Quantifying the Investor’s Hurdle

For Singapore Citizens already owning property, the 20% ABSD on a second residential purchase is the dominant variable in any investment analysis. It is not merely an upfront cost: it is a 20% return hurdle the investment must clear before any real profit begins to accumulate.

Buyer Profile ABSD Rate ABSD on S$1.8M Est. Net Yield Cap. Gain (4% pa) Total Return pa
SC — 1st property (owner-occupier buying only) 0% S$0 +0.7% +4.0% ~4.7%
PR — 1st property 5% S$90,000 +0.3% +4.0% ~4.3%
SC — 2nd property 20% S$360,000 -1.3% +4.0% ~2.7%
PR — 2nd property 25% S$450,000 -1.6% +4.0% ~2.4%
SC — 3rd property 30% S$540,000 -2.5% +4.0% ~1.5%
Foreigner 65% S$1,170,000 Deeply negative +4.0% ~2.0%*

*Foreigner total return assumes 10yr hold and 4% pa capital appreciation; ABSD amortised at S$117K/yr. Estimates only; not financial advice. ABSD rates effective 27 April 2023 per IRAS.

Net Annual Return: The Full Breakdown

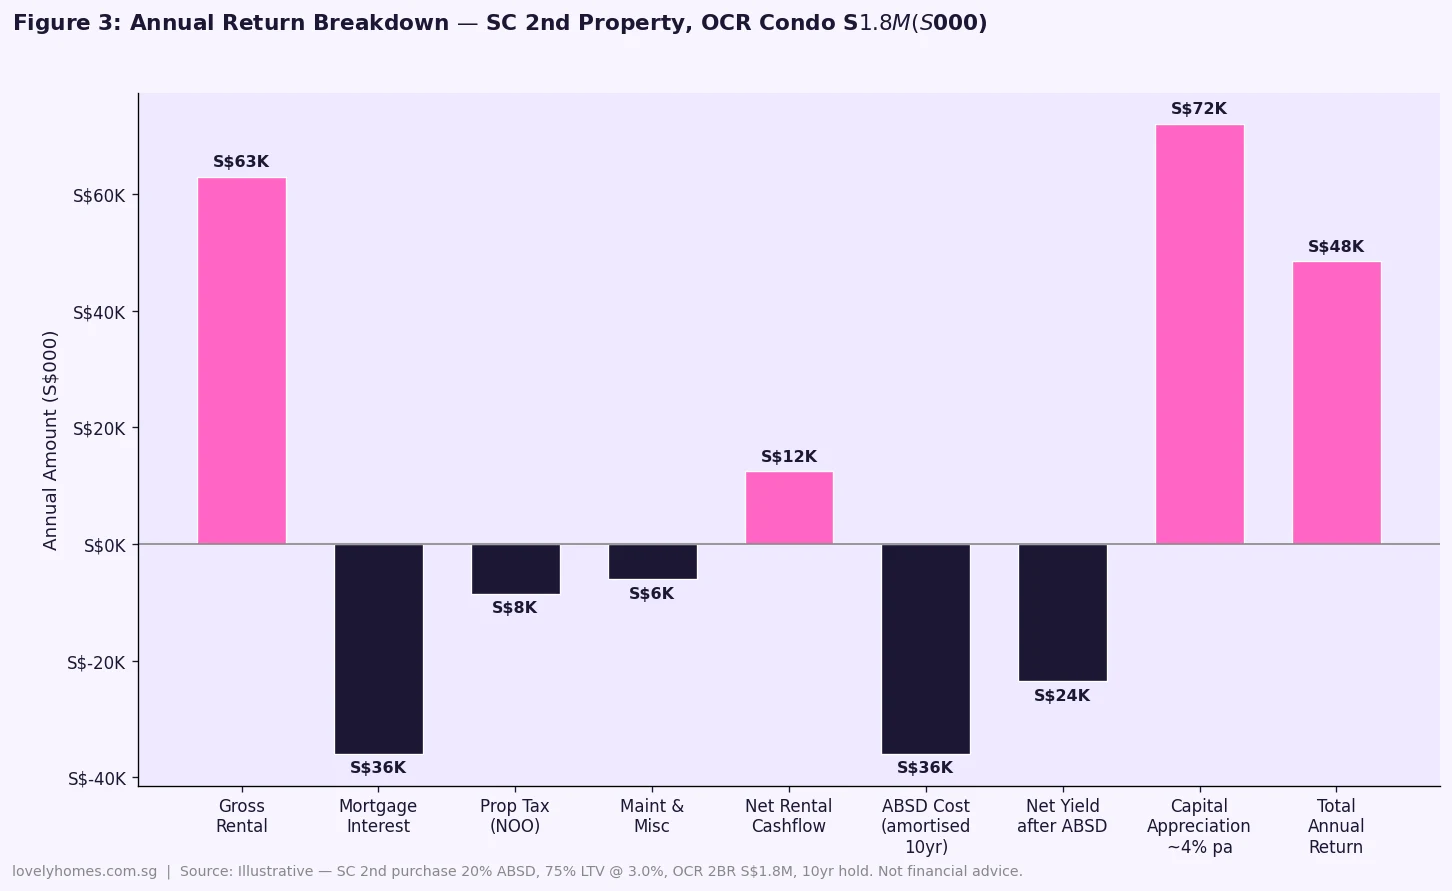
The chart below deconstructs every component of annual return for a Singapore Citizen buying a second property — a 2-bedroom OCR condominium at S$1,800,000 — showing precisely where income is earned and where costs erode it.
Net annual return breakdown Singapore OCR condo investment S$1.8 million 2026 waterfall chart
Figure 3: Annual return breakdown — SC 2nd property, OCR condo S$1.8M, 10-year hold, 75% LTV @ 3.0% pa. Pink bars = inflows; navy bars = costs. Source: LovelyHomes analysis based on URA market data. Illustrative only; not financial advice.

Gross rent at 3.5% yields S$63,000 per year. Mortgage interest on a S$1.35 million loan at 3.0% costs S$40,500. Non-owner-occupied property tax on an annual value of approximately S$63,000 costs around S$8,500. Maintenance fees and miscellaneous outgoings run another S$6,000 per year. That leaves a net rental cashflow of S$8,000 — barely 0.5% of the purchase price — before ABSD is factored in.

Amortised over a 10-year hold, the S$360,000 ABSD costs S$36,000 per year in opportunity cost. Subtracted from the S$8,000 net rental cashflow, the investor is running at S$28,000 negative annually from operations. Capital appreciation at 4% per annum on S$1.8M generates approximately S$72,000 per year in theoretical gain — rescuing the total return to roughly S$44,000 per year, or about 2.5% on purchase price. For comparison, the 10-year SGS bond yield in mid-2026 stood at approximately 3.0%, and S-REITs were distributing 5.5%–6.5% per annum. The risk-adjusted case for a second-property investment in Singapore demands real conviction in the capital-appreciation story.

Investment Strategies for 2026

Four broad strategies align with different investor profiles and risk appetites in the current environment.

Buy-to-let for income: Best suited to HDB flats (SC first purchase, mature estates near MRT) or OCR condominiums (first-time private buyer). Mature-estate HDB flats in Queenstown, Toa Payoh, and Bishan generate 4.0%–4.5% gross yields with low vacancy risk. Private condos in high-demand OCR rental catchments — near international schools, tech corridors, or major employment hubs — support consistent 3.3%–3.8% gross yields.

Capital-gain strategy via HDB-to-private upgrade: SC couples who sell their HDB flat and buy a private condominium as their primary residence pay zero ABSD on the private purchase and face no LTV penalty from an existing loan. This is structurally the most efficient entry into private property appreciation, and has driven OCR capital gains for over two decades.

En bloc positioning: Buying into an older, low-plot-ratio freehold property in a redevelopment-ready location — Greater Southern Waterfront fringe, Orchard/Newton corridor, or established OCR growth nodes — can deliver outsized capital gains if a collective sale proceeds. The trade-off is timeline uncertainty of 12–24 months and the 80% or 90% consent threshold. See our En Bloc Sale Guide 2026 for the full process and legal framework.

S-REITs — indirect exposure without ABSD: Singapore-listed REITs provide diversified property exposure across industrial, retail, logistics, and hospitality sectors, currently yielding 5.5%–6.5% annually. They are listed on SGX, liquid, and accessible from one lot. For income-focused investors who cannot justify the ABSD cost of direct second-property ownership, a portfolio of S-REITs is a compelling alternative — though it sacrifices the leverage and direct asset-selection advantages of physical property.

Financing: TDSR, LTV, and the Second-Property Rules

The Monetary Authority of Singapore (MAS) enforces the Total Debt Servicing Ratio (TDSR) across all property-linked loans. Monthly debt obligations — the new mortgage plus all existing commitments — must not exceed 55% of verified gross monthly income. For second-property investors, the binding constraint is often TDSR rather than ABSD alone.

Loan-to-Value rules compound this. With no outstanding loan, the bank LTV is 75% (meaning 25% downpayment, of which minimum 5% must be cash). With one outstanding loan — a common scenario for SC investors still servicing an HDB mortgage — the LTV on the new private loan drops to 45%, requiring a 55% downpayment. On a S$1.8M property, that is S$990,000 in equity required before ABSD, BSD, or legal fees are counted.

Note that ABSD cannot be paid with CPF. Only cash funds may be used. BSD may be paid from CPF Ordinary Account. These rules constrain the investable universe to buyers with substantial liquid savings beyond their CPF holdings.

What Might Come Next

The record GLS Confirmed List of 9,320 units for 2026 — the largest in the programme’s modern history — will translate into completions primarily in 2028–2030. Rental yields may compress modestly in 2027 as this wave of new supply enters the leasing market, particularly in the OCR and RCR segments where GLS activity is heaviest. Short-term investors entering at today’s prices face this headwind.

Interest rates are trending lower. The US Federal Reserve is expected to cut two to three times in 2026, pulling SORA from approximately 3.6% toward 2.8% by year-end. Lower financing costs improve net yields and could re-activate demand across all private segments. The full Q2 2026 URA private residential statistics, expected on 24 July 2026, will provide the most comprehensive data signal of whether the flash +0.5% figure holds across all sub-segments.

There is no credible expectation that ABSD rates will be reduced in the near term. MND has consistently signalled that housing affordability remains a priority concern, and any ABSD reduction risks reigniting the demand surge the 2023 measures were designed to prevent.

Frequently Asked Questions

Can I use CPF Ordinary Account funds to pay ABSD?

No. ABSD must be paid entirely in cash within 14 days of exercising the Option to Purchase. CPF Ordinary Account funds may be used for BSD, downpayments, and monthly mortgage instalments, but not for ABSD. This is a material liquidity constraint — buyers must hold sufficient cash above and beyond their CPF balances before committing to a second-property purchase.

Is there any ABSD remission for investors selling an existing property?

The ABSD remission for SC married couples allows a full ABSD refund on a second property if the first is sold within six months of the new property’s purchase date (completed property) or TOP (new launch). This is designed for the buy-before-sell upgrade path, not for investors who intend to retain both properties. There is no investor-specific ABSD waiver as at July 2026. Married SC/PR couples may apply for ABSD remission at the SC rate if the SC spouse is the sole or joint purchaser.

How does the TDSR apply to investment properties?

The TDSR applies equally to investment and owner-occupied residential properties. All monthly loan obligations must not exceed 55% of verified gross monthly income. Rental income from the investment property may be counted at a 70% haircut if you have evidence of existing rental receipts, but prospective rent from a newly purchased property is generally excluded. The TDSR is enforced by the MAS and applies to all financial institutions regulated in Singapore.

Is rental income from Singapore property taxable?

Yes. Net rental income is taxable as part of your assessable income under the Income Tax Act administered by IRAS. Net rental income is gross rent less allowable deductions: mortgage interest, agent commissions, property maintenance, fire insurance, property tax, and statutory depreciation on furniture and fittings (at 25% of monthly rent). Singapore residents pay progressive rates from 0% to 24%; non-residents pay a flat 24%. Rental income must be declared in your annual IRAS tax return by 15 April each year. Full guidance is available at iras.gov.sg.

Can foreigners buy investment property in Singapore?

Foreigners may purchase non-landed private residential property (condominiums and apartments). However, the 65% ABSD rate makes this prohibitively expensive for most investment theses — on a S$2M condominium, ABSD alone is S$1.3M. Foreigners cannot purchase HDB flats and require SLA written approval for landed property. Commercial property (shophouses, office, retail, industrial) is exempt from residential ABSD and remains fully open to foreign ownership, which is why shophouses continue to attract significant foreign institutional capital.

Are S-REITs a better investment than direct property?

S-REITs offer higher current yields (5.5%–6.5% in 2026), full liquidity (SGX-listed), no ABSD, and no minimum investment beyond one lot. The trade-off is that you do not select individual properties, you bear equity market volatility and interest-rate sensitivity, and capital appreciation is driven by unit-price movements rather than specific deals. For income-focused investors who cannot justify the ABSD cost of direct second-property ownership, a diversified S-REIT portfolio typically produces better risk-adjusted returns than a single leveraged property — though it sacrifices the leverage and bespoke asset-selection advantages of direct ownership.

Should I buy now or wait for the GLS supply to affect prices?

The record 9,320-unit GLS Confirmed List for 2026 translates into completions primarily in 2028–2030 — not an immediate price shock. Rental markets may soften from 2027 as supply arrives, particularly OCR/RCR. Short-term investors (3–5 year horizon) face elevated risk of entry-price headwinds from this supply wave. Long-term investors (8–10+ years) have historically found most Singapore entry points acceptable, as prices have recovered from every supply-driven moderation since 2013. Monitor the full Q2 2026 URA statistics (24 July 2026) and the October 2026 GLS announcement before committing.

Worked Example: SC Upgrader Buys OCR Investment Condo

Mr Tan, SC, 45, earns S$18,000 per month. He and his wife own a fully paid-up HDB flat in Bishan. He wishes to purchase an OCR 2-bedroom condominium in Tampines at S$1,800,000 as a 10-year investment.

Upfront costs: BSD S$56,600 (CPF OA) • ABSD 20% S$360,000 (cash only) • 25% downpayment: S$90,000 cash + S$360,000 CPF • Bank loan 75% LTV S$1,350,000 @ 3.0% 30 years = S$5,691/mth • TDSR 31.6% ✓ • Legal fees S$5,500. Total outlay: approximately S$455,500 cash + S$416,600 CPF.

Annual returns: Gross rent 3.5% = S$63,000 • Less mortgage interest (3.0% × S$1.35M) = S$40,500 • Less NOO property tax = S$7,560 • Less maintenance S$450/mth = S$5,400 • Less insurance and misc = S$1,200. Net rental cashflow: S$8,340/yr (0.5%). Less ABSD amortised over 10 years = S$36,000. Net yield after ABSD: −S$27,660/yr. Assumed capital appreciation 4% pa = S$72,000/yr. Estimated total annual return: S$44,340 (~2.5% pa on purchase price).

At a 10-year exit (no SSD having held more than three years), assuming 4% pa compound growth, the property is worth approximately S$2.66M — a S$860,000 gross capital gain. Less total ABSD (S$360,000), less selling costs (~S$36,000), less cumulative negative operating cashflow (approximately S$276,000 over 10 years): net 10-year return roughly S$188,000 on S$455,500 cash outlay. That is approximately 41% cumulative or 3.5% CAGR on cash invested. Compelling only if the 4% capital appreciation assumption holds across the entire decade.

Related Articles

Disclaimer: This article is for general information only and does not constitute financial, investment, or legal advice. Property investment involves risk, including possible loss of capital. Yield and appreciation figures are illustrative estimates based on historical and current market data; future performance may differ materially. ABSD rates, BSD schedules, and financing rules are correct as at 11 July 2026 but are subject to change by the relevant Singapore authorities. Readers should consult a licensed financial adviser or mortgage broker and conduct independent due diligence before making any investment decision. For official ABSD/BSD rates, refer to IRAS at iras.gov.sg. For market transaction data and GLS information, refer to URA at ura.gov.sg.

×
Enlarged view
Click anywhere to close

Long Island Singapore Preparatory Works 2026: What It Means for East Coast Property

Long Island Singapore Preparatory Works 2026: What It Means for East Coast Property

Source: URA / HDB Press Release pr26-50, 30 June 2026 — “Preparatory works for ‘Long Island’ project to commence from end-2026”

Key Takeaways: Long Island Preparatory Works 2026

  • What: Preparatory marine works for Singapore’s large-scale ‘Long Island’ coastal protection and land reclamation project, to begin end-2026 off East Coast Park
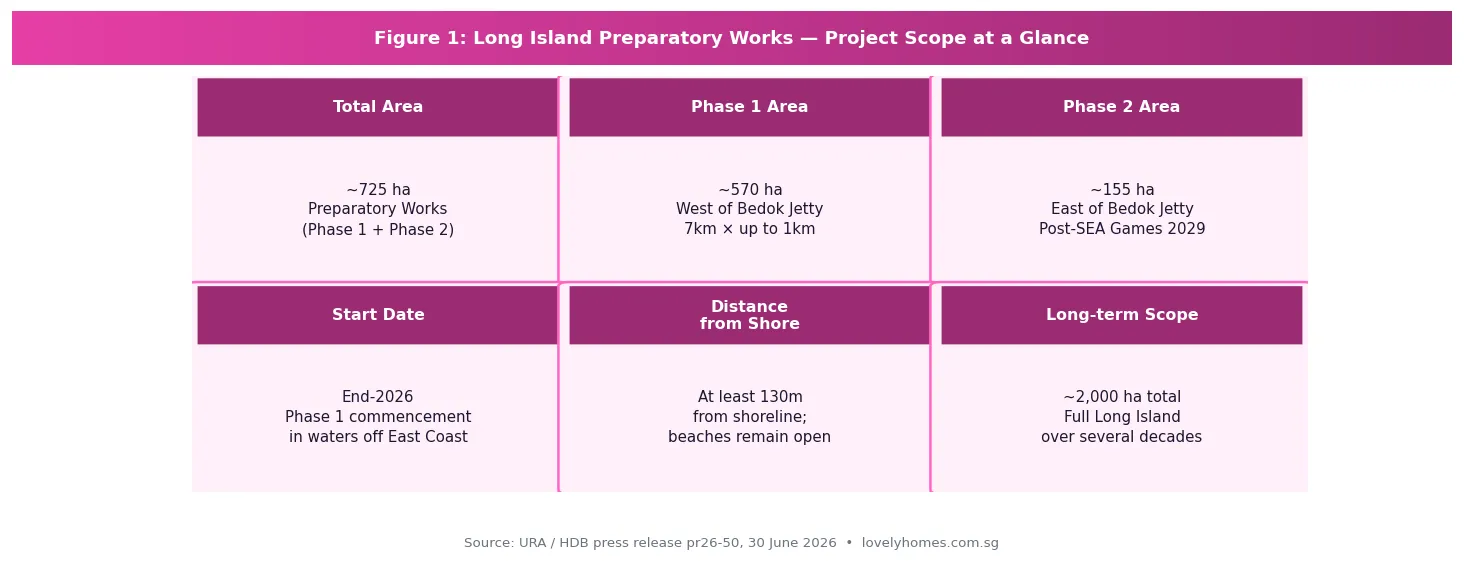
  • Phase 1: ~570 ha, west of Bedok Jetty, starts end-2026; 7km long, up to 1km wide, at least 130m from shoreline
  • Phase 2: ~155 ha, east of Bedok Jetty — deferred until after the Southeast Asian (SEA) Games 2029
  • Public impact: Beaches at East Coast Park remain open throughout; near-shore swimming continues; sea sports (especially kiteboarding) will be temporarily displaced
  • Environmental study: Water quality expected to meet marine criteria; minor impacts on coral and seagrass beds; dust and sediment managed by silt screens and EMMP
  • Property implications: East Coast (D15) property holders should view Long Island as a long-term positive catalyst — ultimately creating new land, extended waterfront, and a future reservoir adjacent to Singapore’s most liveable eastern corridor
  • Full reclamation: The preparatory works area is NOT the final Long Island profile; detailed plans will be developed through further technical studies and public engagement over the coming years

Singapore took a significant step forward on its most ambitious coastal infrastructure project on 30 June 2026, when the Urban Redevelopment Authority (URA) and the Housing & Development Board (HDB) jointly announced that preparatory marine works for the ‘Long Island’ project will begin from end-2026. For property owners and buyers along the East Coast corridor — particularly in District 15 (D15), Bedok (D16), and the Tampines/Pasir Ris eastern stretch — the announcement marks the formal start of a multigenerational transformation that will ultimately reshape Singapore’s entire southern coastline.

LovelyHomes has previously covered the Greater Southern Waterfront (GSW) — the western bookend of Singapore’s coastal transformation — in our Tanjong Pagar Neighbourhood Guide and East Coast Neighbourhood Guide. Long Island is the eastern counterpart: a critical flood protection measure that will eventually create new land and a future reservoir east of Bedok, protecting the entire East Coast from rising sea levels over the coming century.

Figure 1: Long Island preparatory works project scope — Phase 1 and Phase 2 areas and timeline
Figure 1: Long Island preparatory works — project scope, Phase 1 and Phase 2 parameters, and long-term scale. Source: URA / HDB press release pr26-50, 30 June 2026.

What Are the Preparatory Works, Exactly?

Long Island is Singapore’s planned response to climate change and rising sea levels along its vulnerable East Coast. The full project — which will ultimately involve major land reclamation to create a new island and a freshwater reservoir — is a decades-long undertaking. What begins at end-2026 is the preparatory phase: essential marine construction works that lay the groundwork for eventual reclamation, but do not yet constitute reclamation itself.

The preparatory works involve three primary activities: removal of seabed obstructions (historical debris, hazards); construction of temporary sand bunds (underwater containment structures); and sand infilling within the bunded areas. These works will take place entirely offshore, at least 130 metres from the shoreline, and will be clearly demarcated by silt screens and floating barriers visible from the beach.

The works are split into two phases:

Phase Location Area Dimensions Timing
Phase 1 Waters west of Bedok Jetty ~570 ha ~7km long × up to 1km wide Commences end-2026
Phase 2 Waters east of Bedok Jetty ~155 ha TBC After SEA Games 2029 completion
Full Long Island Entire East Coast offshore zone ~2,000+ ha (indicative) TBC through technical studies Over several decades

The deferral of Phase 2 until after the 2029 SEA Games is a deliberate accommodation: the waters east of Bedok Jetty are currently used for water sports and will host major aquatic events for the SEA Games. This sequencing shows that the government is managing the project’s community impact thoughtfully — a signal that should give East Coast residents some comfort about near-term disruption.

Environmental Findings: What the Study Revealed

HDB commissioned a formal Environmental Study covering the preparatory works, consulting nature groups on scope. The study’s key findings are reassuring for the majority of East Coast users:

Water quality: No significant changes expected; water will continue to meet Singapore’s prevailing marine water quality criteria throughout the works.

Currents and waves: Slight localised changes near Bedok Jetty are expected to have minimal impact on near-shore activities. Swimming can continue along the entire East Coast stretch.

Air quality and visibility: Up to minor visual impact from sand infilling operations; intermittent sediment plumes and dust are expected, mitigated by silt screen deployment and active dust monitoring under the Environmental Monitoring and Management Plan (EMMP).

Biodiversity: Some coral and seagrass beds found near the work site may experience short-term, localised impact from sediment plumes. However, the majority of coral and seagrass — including Sisters’ Islands Marine Park — is assessed as largely unaffected. HDB has committed to EMMP monitoring throughout.

Sea sports displacement: This is the most tangible near-term impact for active East Coast users. Kiteboarding is most affected; other sea sports face minor to moderate displacement. Agencies are working with affected user groups to identify alternative sites within the sea space east of Bedok Jetty in the interim.

Key Takeaway: The environmental study concludes that preparatory works will have manageable, temporary, and localised impacts — not the large-scale ecological disruption that some stakeholders had feared. Beaches remain open. Swimming is unaffected. The most significant disruption is displacement of marine leisure activities, particularly kiteboarding, which will require temporary relocation.

What This Means for East Coast Property Buyers and Owners

For property owners in the East Coast corridor — covering D15 (Katong, Tanjong Katong, Marine Parade), D16 (Bedok, Siglap, Upper East Coast), and the eastern planning areas (Tampines, Pasir Ris, Changi) — the Long Island announcement is a long-term positive with a short-term noise caveat.

Short-term (2026–2029): Managed Disruption

The preparatory works will generate visible marine activity offshore — construction vessels, sand infilling operations, and temporary bunds. From the shoreline, this will be noticeable but distant (at least 130m offshore). Air quality impacts are expected to be minor and intermittent. Beaches remain open. The practical implication for property values is minimal in the short term: these works are a public infrastructure programme, not a lifestyle degradation, and they come with an explicit government commitment to environmental monitoring and mitigation.

Medium-term (2029–2035): Planning Uplift Begins

As the preparatory phase completes and the URA begins formal planning for Long Island’s reclamation profile, the East Coast will progressively benefit from the same planning-uplift dynamic that has historically preceded major Singapore waterfront transformations. When Marina Bay was being planned in the 1980s and 1990s, property in D1 and D2 began appreciating in anticipation of the new precinct long before a single building was complete. Long Island represents a similar, though slower, catalyst for the D15/D16 corridor.

Long-term (2035+): Transformative Uplift

When the full Long Island reclamation creates new land along the East Coast — including a future reservoir — the implications for D15 and D16 property are substantial: extended waterfront promenade access, reduced flood risk (supporting insurance and bank valuations), new residential parcels potentially creating supply (a risk to existing owners) but also major new amenity and connectivity (a positive for the precinct as a whole). The 2026 URA Q2 price data already showed D15 benefiting from TEL Stage 4 connectivity; the Long Island catalyst is additive to this structural tailwind over the 2030s and beyond.

Horizon Impact on East Coast Property Key Risk
2026–2029 (prep works) Neutral to marginally negative optics; no material price impact expected Marine activity visible from beachfront; minor sea-sport disruption
2029–2035 (early planning) Positive sentiment as Long Island masterplan solidifies; planning uplift begins Timeline may slip; full reclamation profile remains unconfirmed
2035+ (reclamation & beyond) Transformative — new waterfront, reduced flood risk, new amenity corridors New residential supply on Long Island may moderate prices on existing stock

Public Engagement and What Comes Next

The URA reiterated in the 30 June 2026 announcement that Singapore’s commitment to public engagement on Long Island planning remains firm. The government has engaged more than 14,000 people to date on Long Island’s vision. From end-2026, a new phase of public engagement will invite Singaporeans to shape key planning topics including recreational uses along the new coastline, the design of the future reservoir, and the character of new precincts that will eventually emerge.

Crucially, the URA clarified that the area used for preparatory works is not the final Long Island land profile. The reclamation profile will be determined through subsequent technical studies — covering environmental impact assessments for the actual reclamation, engineering studies, and further public engagement — expected to take several more years. Main reclamation works will only commence after these studies are complete and mitigation measures are determined.

The Environmental Study report was published for public feedback for four weeks from 30 June 2026. Members of the public may view it and submit feedback at go.gov.sg/long-island.

Frequently Asked Questions: Long Island and East Coast Property

Will the preparatory works affect East Coast Park beach access?

No. All beaches along East Coast Park will remain open throughout the preparatory works. Near-shore swimming can continue along the entire stretch of the East Coast. Exercise paths and tracks for jogging and cycling also remain fully accessible. The works are offshore (at least 130m from the shoreline) and cordoned off for public safety. Safety advisories will be posted at East Coast Park and on government agency websites.

How might Long Island affect property values in D15 and D16?

In the short term (2026–2029), the preparatory works are unlikely to have a material impact on property values in D15 (Marine Parade, Katong, Tanjong Katong) or D16 (Bedok, Upper East Coast, Siglap). The works are offshore, temporary, and environmentally monitored. In the medium to long term, Long Island is broadly a positive catalyst for the East Coast corridor — creating new waterfront, improved flood protection, and eventually new amenities. However, buyers should note that full Long Island reclamation is decades away and carries execution and timeline uncertainty. Purchase decisions should be based on the neighbourhood’s existing merits, with Long Island treated as optionality, not a near-term price driver.

What is the difference between the preparatory works and the main Long Island reclamation?

The preparatory works (beginning end-2026) involve seabed clearance, temporary bund construction, and sand infilling — foundational marine works that create the conditions for eventual reclamation without being the reclamation itself. The area used for preparatory works is not the final land profile of Long Island. The main reclamation works — which will actually create the new island — will only commence after the government completes further technical studies, determines mitigation measures, and incorporates feedback from additional public engagement rounds. This could be many years away. Think of the preparatory works as clearing and grading a site before construction, not as the construction itself.

Will Long Island create new HDB or private residential areas in the future?

Long Island’s ultimate land use profile — including any residential development — has not been finalised. The URA has noted that planning will incorporate findings from technical studies and public engagement, and that the government retains flexibility to meet evolving national needs. Historically, Singapore’s reclaimed land has been used for a mix of residential, commercial, and infrastructure purposes. It is reasonable to expect that some Long Island land will eventually be developed for housing, but the specific profile, tenure, and density remain undecided. Any residential development on Long Island is likely to be 15–25 years away.

Can I still use East Coast Park for water sports during the works?

Most water sports can continue, but with some adjustment. Near-shore swimming is unaffected. However, sea sports that require more sea space — particularly kiteboarding — will be the most significantly impacted, as the Phase 1 work area covers much of the sea space west of Bedok Jetty. Agencies are working with affected groups to identify alternative sites, including the sea space east of Bedok Jetty (until Phase 2 begins post-2029). Recreational paddling, kayaking, and water skiing in near-shore areas should be largely unaffected, though users should maintain safe distances from vessels and the cordoned work area.

Disclaimer: This article is an editorial summary of URA/HDB press release pr26-50 (30 June 2026). All project details, timelines, areas, and environmental findings cited are drawn from that official source. Property value commentary reflects editorial analysis only and does not constitute investment advice. Long Island timelines are subject to change by the Singapore Government. Readers should consult official sources — go.gov.sg/long-island, URA, HDB — and qualified property professionals before making property decisions based on this or any infrastructure announcement.

×

Click anywhere to close

Tanjong Pagar Neighbourhood Guide Singapore 2026: D02 Prices, GSW and Investment Outlook

Tanjong Pagar Neighbourhood Guide Singapore 2026: D02 Prices, GSW and Investment Outlook


Quick Answer: Tanjong Pagar (D02) at a Glance

  • Location: District 02, Core Central Region (CCR), southern edge of Singapore’s CBD — Chinatown, Tanjong Pagar, Anson Road corridor
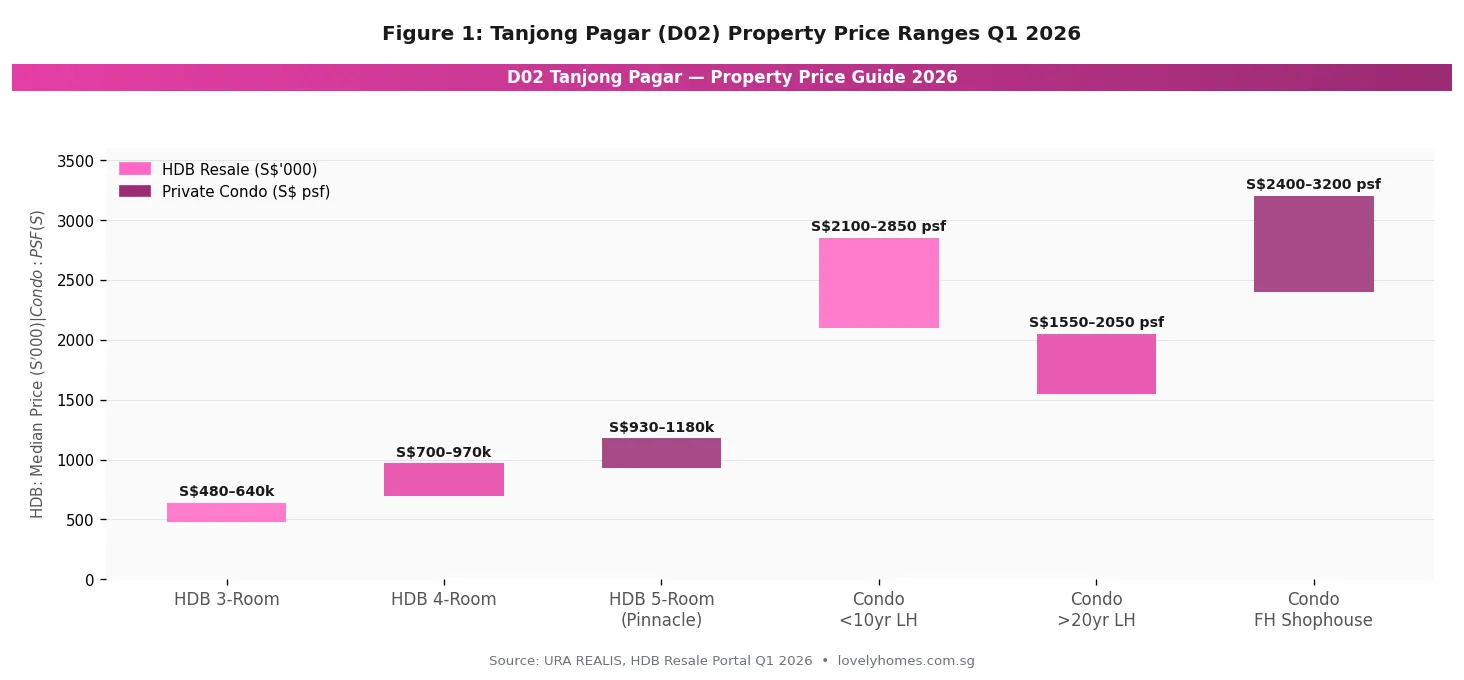
  • HDB resale prices (Q1 2026): 3-room S$480k–S$640k; 4-room S$700k–S$970k; 5-room at Pinnacle@Duxton S$930k–S$1.18M
  • Private condo PSF: S$1,550–S$2,050 (older leasehold) to S$2,100–S$2,850 (newer/freehold)
  • MRT access: Tanjong Pagar EWL (EW15), Shenton Way TEL (TEL17), Cantonment CCL (CC28) — three-line connectivity
  • Rental yield: ~2.6–3.2% gross (CCR typical range); stronger for smaller-format units near CBD
  • Key catalyst: Greater Southern Waterfront (GSW) — ~2,000 ha of land transformation planned over the next two to three decades
  • Who buys here: Expat professionals, CBD workers, upgraders seeking CCR address, investors targeting GSW uplift
  • Watch: Supply is thin — no major new private residential GLS in D02 for several years; scarcity premium is real

Tanjong Pagar is one of Singapore’s most layered neighbourhoods. It is at once a bustling CBD business district, a conserved Peranakan and shophouse enclave, a mature HDB heartland anchored by the globally celebrated Pinnacle@Duxton, and the gateway to Singapore’s most ambitious land transformation project — the Greater Southern Waterfront (GSW). For property buyers and investors in 2026, the neighbourhood presents a rare combination: tight existing supply, a proven rental market, and a long-term government-backed regeneration catalyst that will reshape the southern coast of Singapore over the coming decades.

This guide covers everything you need to know about buying, renting, and investing in Tanjong Pagar — from live Q1 2026 price data across HDB resale and private condominiums, to the eligibility rules that govern who can buy what, a worked cost example, and an honest assessment of what the Greater Southern Waterfront means for property values in D02.

Figure 1: Tanjong Pagar D02 property price ranges 2026 — HDB resale and condo PSF
Figure 1: Tanjong Pagar (D02) property price ranges, Q1 2026. HDB resale prices are medians in S$’000; private condo data reflects median PSF (S$) for non-landed units ≤1,500 sqft. Sources: URA REALIS, HDB Resale Portal.

Where Is Tanjong Pagar and What Makes It Distinctive?

Tanjong Pagar sits in District 02, bounded roughly by Outram Road to the west, Maxwell Road and Neil Road to the north, Keppel Road to the south, and Anson Road to the east. The district is administered within the Outram planning area, and sits firmly within Singapore’s Core Central Region (CCR) — the premium market segment encompassing the traditional prime districts (D9, D10, D11), the CBD core (D1, D2, D6), and Sentosa.

What distinguishes Tanjong Pagar from the rest of the CCR is its mix. Unlike Orchard Road (D9/D10) or Holland Village (D10), which are predominantly private residential, Tanjong Pagar houses approximately 5,400 HDB flats alongside office towers, conserved shophouses, food courts, Chinatown Heritage Centre, and one of Singapore’s most recognisable public housing landmarks. This diversity of tenure and use gives the neighbourhood an urban texture that attracts a broad buyer and tenant base.

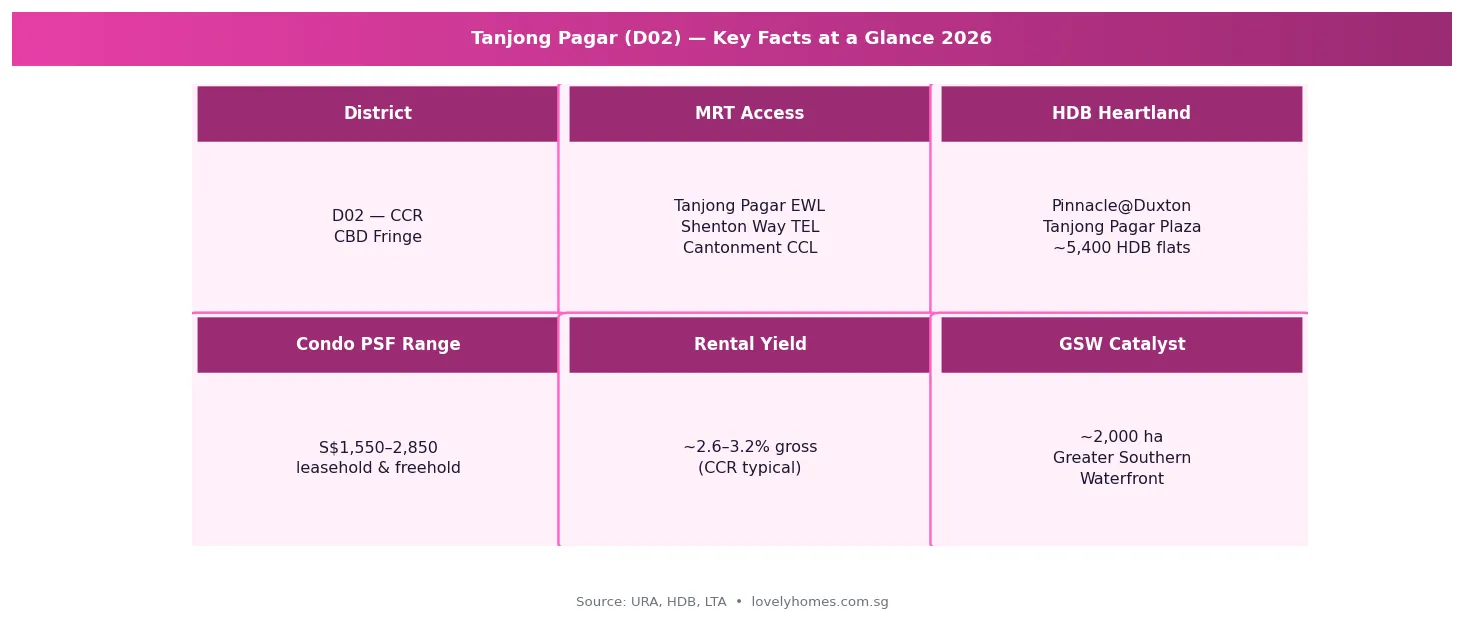
Figure 2: Tanjong Pagar D02 key facts 2026 — district, MRT, HDB, condo, rental yield, GSW
Figure 2: Tanjong Pagar (D02) key facts at a glance, 2026. Sources: URA, HDB, LTA.

Transport Connectivity: Three MRT Lines and Walking-Distance Access

Connectivity is one of D02’s strongest selling points. Residents can access three MRT lines without a bus transfer:

Tanjong Pagar MRT (EW15 — East-West Line): The original station, opened in 1987, connects directly west to Jurong and east to Tampines, Changi Airport, and Pasir Ris. The one-stop hop to Raffles Place (EW14) places the financial district within a two-minute train ride. Outram Park (EW16/NE3/TE17) — one stop west — offers further cross-platform access to the North-East Line and Thomson-East Coast Line.

Shenton Way TEL (TEL17 — Thomson-East Coast Line, Stage 3): Opened in November 2022, Shenton Way TEL sits a short walk north of the Tanjong Pagar residential cluster. The TEL offers seamless one-transfer connectivity to Woodlands (via Orchard and Newton), to East Coast (via Bayshore and Bedok South on TEL Stage 4), and eventually to Sungei Bedok where a cross-platform interchange with the East-West Line will complete the full loop. For Tanjong Pagar residents, the TEL meaningfully reduces commute times to the northern towns and to the Katong/Marine Parade corridor.

Cantonment MRT (CC28 — Circle Line): Opened in September 2022 as part of the Circle Line Stage 6 (closing the loop), Cantonment station sits on Cantonment Road just south of the Pinnacle@Duxton. The Circle Line connects Tanjong Pagar residents directly to one-north, Harbourfront, Dhoby Ghaut, and the eastern nodes of the CCL without going through the city centre interchange.

This three-line connectivity is uncommon even by Singapore standards. Most heartland towns have one or two lines; D02’s triple access gives it a commuting advantage that supports both tenant demand and rental premiums.

HDB Resale Market in Tanjong Pagar: Prices, What to Expect

The HDB resale market in Tanjong Pagar is among the most expensive in Singapore for public housing. The reasons are structural: limited supply (most of the area is private or commercial), exceptional connectivity, and the prestige associated with the Pinnacle@Duxton address. Buyers should expect to pay a meaningful premium over comparable flats in Queenstown or Buona Vista, let alone OCR towns like Tampines or Sengkang.

Flat Type Approx. Floor Area Q1 2026 Median Price Price Range Key Precinct
3-Room ~65–73 sqm S$555,000 S$480k–S$640k Tanjong Pagar Plaza, Cantonment Rd
4-Room ~90–105 sqm S$820,000 S$700k–S$970k Tanjong Pagar Plaza, Pinnacle (lower floors)
5-Room (Pinnacle) ~110–120 sqm S$1,050,000 S$930k–S$1.18M Pinnacle@Duxton exclusively

Pinnacle@Duxton — the seven-tower, 50-storey public housing development completed in 2010 — warrants special mention. Units here, particularly those on higher floors with city and sea views, have consistently transacted above S$1 million since 2021. The development enjoys Minimum Occupation Period (MOP) completed status, and resale units come with the added draw of the iconic sky bridge and rooftop gardens, which are open to the public. Buyers should note: as a leasehold HDB flat with a 99-year tenure commencing 2010, Pinnacle units have approximately 83 years remaining as at 2026 — factoring in lease decay is essential when assessing long-term value.

HDB Eligibility Rules That Apply in D02

The standard HDB resale eligibility framework applies — Singapore Citizens and Permanent Residents who meet the citizenship/family nucleus requirements may purchase. There are no specific restrictions unique to D02, but buyers should note: if any flat in the precinct falls within a Prime classification zone (under HDB’s August 2024 Prime/Plus/Standard framework for BTO), resale of those units after MOP will attract a clawback on subsidies received at purchase. As at 2026, most Tanjong Pagar resale flats are legacy stock not subject to new-framework clawbacks — but prospective buyers should verify the specific block’s classification with HDB before committing.

Private Condo and Freehold Market in D02

D02 Tanjong Pagar has a limited supply of private condominiums compared to neighbouring districts. Development sites are scarce in this dense, mixed-use environment. Notable private residential projects in and around the precinct include Icon (leasehold, completed 2007), One Shenton (leasehold, Shenton Way), V on Shenton (leasehold), 76 Shenton (freehold conservation shophouse redevelopment), and the Artra development at Alexandra View. Freehold conservation shophouses on Club Street, Tanjong Pagar Road, and Duxton Hill command premium valuations as alternative assets.

The PSF range varies significantly by age, tenure, and location within the precinct. As a general guide for Q1 2026:

Property Type Tenure PSF Range (S$) Typical Monthly Rent (2BR) Est. Gross Yield
Condo <10 yr old, LH 99-year S$2,100–S$2,850 S$5,800–S$7,500 ~2.8–3.1%
Condo >15 yr old, LH 99-year S$1,550–S$2,050 S$4,200–S$5,600 ~2.9–3.2%
Freehold shophouse resi Freehold S$2,400–S$3,200 S$6,000–S$9,000 ~2.5–2.9%

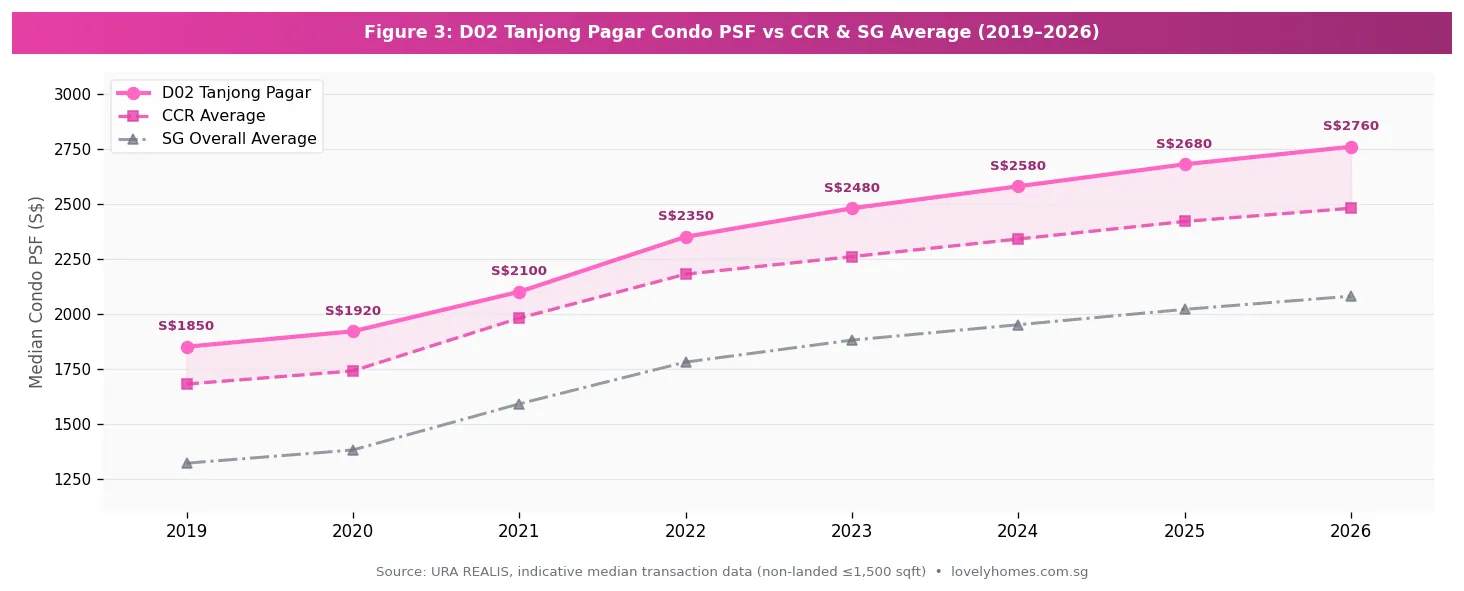
Figure 3: Tanjong Pagar condo PSF trend 2019–2026 versus CCR and Singapore average
Figure 3: D02 Tanjong Pagar median condo PSF (non-landed, ≤1,500 sqft) versus CCR average and Singapore overall, 2019–2026. Sources: URA REALIS, indicative median transaction data.

As Figure 3 illustrates, D02 has consistently traded at a premium above the CCR average — reflecting the district’s CBD-adjacency advantage. The gap widened between 2021 and 2023 as post-pandemic demand for city-fringe living spiked. Since 2024, the gap has stabilised, with D02 running approximately S$250–S$320 psf above the CCR mean. The absence of significant new supply — no major GLS site has been released in D02 in recent years — has supported prices even as broader CCR activity moderated in 2024.

The Greater Southern Waterfront: What It Means for Tanjong Pagar Property

The Greater Southern Waterfront (GSW) is the Singapore Government’s most ambitious urban transformation project south of the city. It encompasses approximately 2,000 hectares of land stretching from Pasir Panjang in the west to Marina East in the east — a stretch of southern coastline currently occupied by port terminals, industrial facilities, golf courses, and government land. As the Tanjong Pagar Port (the world’s largest container port by throughput when it operated) progressively relocates to Tuas by the early 2030s, this vast land bank becomes available for mixed-use development over the following two to three decades.

For Tanjong Pagar property owners, the GSW is both an opportunity and a long-dated one. Key facts that property buyers should understand:

Scale and timeline: At 2,000 ha, the GSW is larger than Marina Bay and Tampines combined. Development will be phased over 20–30 years. The first parcels to emerge will be around Keppel and Telok Blangah; those closest to Tanjong Pagar could see activity within 10–15 years.

Planned character: URA’s masterplan envisions a live-work-play precinct with new residential districts, public green spaces, a new waterfront promenade, cultural institutions, and a potential new MRT connection along the southern coast. The Keppel Club site (approximately 44 ha) was the first major GSW parcel to be tendered, with the winning developer awarded the white site in early 2023 for a mixed-use development that will include over 9,000 residential units — becoming one of Singapore’s largest planned private housing estates.

Property value implications: Historical precedent from Marina Bay and one-north suggests that government-planned transformations deliver measured but real uplift to surrounding residential values — typically concentrated in the 5–10 years before and during initial development. For D02 owners, the GSW catalyst is a hold thesis rather than an immediate trading play.

Key Takeaway: The GSW will materially reshape Singapore’s southern coast but on a multigenerational timeline. Buyers who purchase in Tanjong Pagar for own occupation benefit from the neighbourhood’s current strengths (connectivity, heritage, supply scarcity) and receive the GSW as optionality — not as a near-term flip thesis.

Worked Example: Buying a Tanjong Pagar Condo in 2026

The Scenario: Mr and Mrs Tan (SC/SC), first-time buyers, purchasing a 2-bedroom condo

Property: 2-bedroom leasehold condo near Tanjong Pagar, 700 sqft at S$2,400 psf = S$1,680,000

Stamp duty: Buyer’s Stamp Duty (BSD) = 1% on first S$180k + 2% on next S$180k + 3% on next S$640k + 4% on next S$500k + 5% on remainder
= S$1,800 + S$3,600 + S$19,200 + S$20,000 + S$9,000 = BSD S$53,600

ABSD: S$0 — SC first property, ABSD exempt

LTV and downpayment: With income of S$15,000/mth combined, TDSR ceiling is 55% → max monthly debt S$8,250. Assume 75% LTV bank loan at 3.5% over 25 years:
Loan = S$1,260,000; monthly repayment ≈ S$6,310 → TDSR 42.1% PASS

Cash required upfront:
— 5% cash downpayment: S$84,000 (cash only; CPF cannot cover first 5%)
— 20% balance: S$336,000 (cash or CPF OA)
— BSD: S$53,600
— Legal fees / stamp duty / valuation: ~S$6,000
Total upfront: approx. S$479,600 (depending on CPF OA balance)

Note: SPR or SC second-property buyers would pay ABSD of 5% (SPR first) or 20% (SC second) respectively, materially increasing the total cost. Always compute your personal profile’s ABSD liability before committing.

Why Tanjong Pagar Matters for Property Investors in 2026

In a market where OCR prices have risen sharply since 2020 and the gap between CCR and OCR has narrowed, Tanjong Pagar offers a rare proposition: a CCR address at a price point that, in historical context, is more accessible than it has been. The CCR-to-OCR price differential compressed significantly between 2021 and 2024 as mass-market demand pushed OCR prices upward while CCR remained relatively range-bound.

For long-term holders, D02 has three structural advantages that distinguish it from comparable CCR districts. First, the supply pipeline is thin — no significant new private residential completions are expected in D02 through 2028, meaning existing stock bears no dilution risk from new units coming online. Second, the tenant pool is diversified across CBD professionals, Chinatown heritage seekers, and increasingly, short-stay visitors and digital nomads who value the neighbourhood’s walkable character. Third, the GSW represents a call option on Singapore’s next major urban precinct — one that, unlike speculative GLS bids, requires no premium payment.

Comparable CCR districts (D9 Orchard, D10 Bukit Timah, D11 Novena) all carry higher average PSFs and lower yield profiles. D02’s position as the undervalued cousin of the prime districts has been a persistent feature of the Singapore market, partly because of the neighbourhood’s historic industrial associations and partly because of its relative unfamiliarity to overseas buyers. Both factors are changing.

What Might Come Next for Tanjong Pagar Property

This section reflects editorial analysis and speculation based on current trends. It should not be treated as a forecast or investment advice.

The most consequential near-term catalyst for D02 values is likely the Keppel integrated development — the first major GSW residential project — which, if it proceeds on schedule, could deliver initial units by the late 2020s to early 2030s. When Marina Bay Sands and the Marina Bay Financial Centre arrived, surrounding Districts 1 and 2 saw demonstrable price appreciation driven by improved amenity, connectivity, and perception uplift. A similar dynamic is plausible as the first GSW precincts activate, though the scale and timeline introduce significant uncertainty.

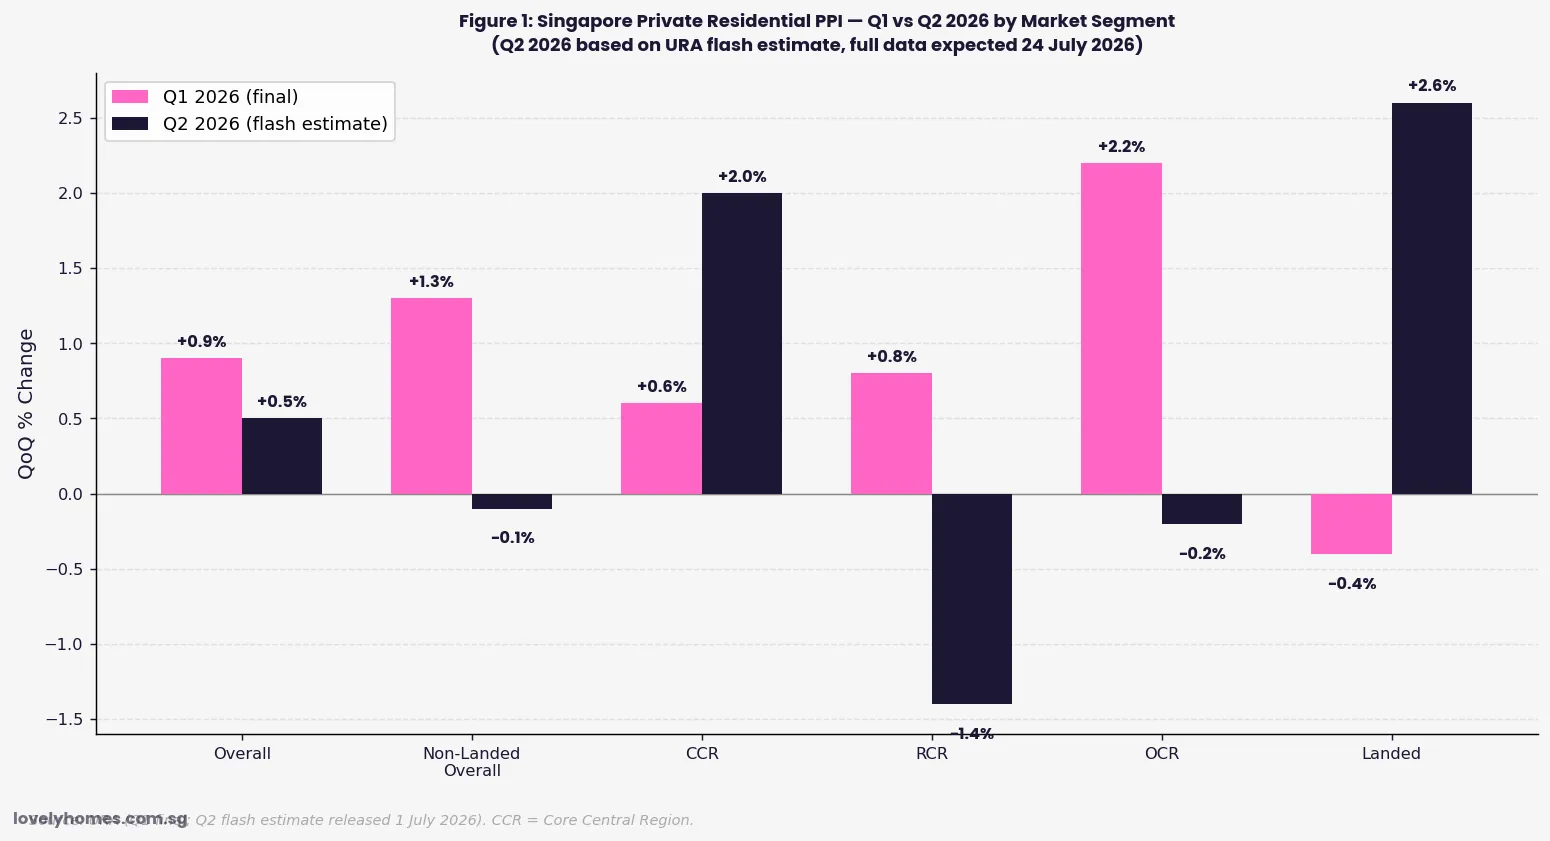
The URA Q2 2026 price index (released 1 July 2026, URA pr26-51) showed the CCR rebounding +2.0% quarter-on-quarter, outperforming the RCR (-1.4%) and OCR (-0.2%). If the CCR rebound is sustained, D02 stands to benefit disproportionately given its supply constraints and improving sentiment around the GSW. That said, global interest rate trajectories and Singapore’s continued vigilance on cooling measures (ABSD rates remain elevated since 2023) remain the key headwinds for any near-term price acceleration.

Frequently Asked Questions: Tanjong Pagar Property

Can a foreigner buy property in Tanjong Pagar?

Foreigners may purchase private condominiums in Tanjong Pagar freely, but may not purchase HDB flats (including Pinnacle@Duxton). Foreign buyers pay a 60% ABSD on their purchase price, on top of BSD. Freehold conservation shophouses classified as strata commercial or strata residential may be available, but restrictions apply — consult a licensed property agent and conveyancing solicitor before proceeding. Singapore Permanent Residents (SPRs) pay 5% ABSD on their first residential property purchase.

What is the MOP for HDB flats in Tanjong Pagar?

HDB resale flats in Tanjong Pagar (including Pinnacle@Duxton) have a standard Minimum Occupation Period of 5 years from the date the seller obtained the keys. You cannot resell or rent out the entire flat during MOP. After MOP, the full flat may be rented out, subject to HDB’s rental eligibility rules. New BTO flats in prime-classified zones carry an extended 10-year MOP under the framework introduced in August 2024.

How does buying a Pinnacle@Duxton flat differ from a standard HDB purchase?

Pinnacle@Duxton units transact as standard HDB resale flats under the HDB resale process — there is no special purchase mechanism. However, buyers should be aware of several unique features: the 50-storey height means piped gas is unavailable above certain floors; the sky bridge and rooftop garden access was previously charged (S$6 for residents) and open to the public; and the premium commanded by higher floors can be substantial. Lease decay is an important consideration: with a 99-year lease commencing 2010, the remaining lease in 2026 is approximately 83 years. HDB’s loan eligibility will be affected by the lease duration — ensure the flat meets the remaining-lease requirement for your desired loan tenure.

Is there a significant COV (Cash Over Valuation) in Tanjong Pagar?

In a tight supply market like D02, COV is common. COV is the amount a buyer pays above the HDB-commissioned bank valuation — it must be paid entirely in cash, not CPF. For popular blocks and high floors at Pinnacle@Duxton, COV of S$30,000–S$80,000 has been observed in recent transactions. Buyers should budget for COV explicitly and factor it into their cash liquidity planning alongside the standard 5% cash downpayment and BSD.

What is the Greater Southern Waterfront and when will it affect property prices?

The Greater Southern Waterfront (GSW) is Singapore’s government-planned transformation of approximately 2,000 hectares of southern coastal land, from Pasir Panjang to Marina East, as the Tanjong Pagar Port relocates to Tuas by the early 2030s. Development will proceed in phases over 20–30 years. The Keppel integrated development (white site awarded 2023) is the first major residential precinct to emerge from the GSW, with an estimated 9,000+ homes planned. Property values in D02 are unlikely to see an immediate step-change from GSW; the effect will be gradual, strongest when the first GSW precincts open and new amenities, waterfront access, and additional MRT nodes materialise. Buyers today are effectively pre-positioning.

What rental income can I expect from a Tanjong Pagar condo?

Based on Q1 2026 rental market data, a 2-bedroom unit (600–800 sqft) in a leasehold condo in D02 typically commands S$4,200–S$7,500 per month, depending on age of the building, floor level, and furnishing. Smaller studio or 1-bedroom units (400–500 sqft) rent in the S$3,200–S$5,000 range and are popular with single CBD professionals. Gross rental yields typically fall in the 2.6–3.2% range for private condos at current price levels — not the highest in Singapore but supported by consistently low vacancy given the CBD tenant base. HDB flats may be rented out after MOP; rental returns on HDB in D02 can be relatively attractive given the lower absolute price relative to nearby private units.

Are there upcoming GLS or new launch condos in Tanjong Pagar?

As at July 2026, there are no confirmed GLS sites in District 02 Tanjong Pagar on the URA Confirmed List for 1H or 2H 2026. The GSW Keppel integrated development is the closest major upcoming supply, but it is physically distinct from the current D02 residential cluster and is expected to be launched as a new growth node rather than a competitor to existing D02 stock. Supply scarcity in D02 proper is expected to persist through at least 2028, which supports both rental and capital values.

Disclaimer: This article is produced for general information and educational purposes only. Price data represents indicative medians drawn from publicly available URA REALIS, HDB Resale Portal, and industry sources for Q1 2026; individual transactions may differ materially. Nothing in this article constitutes financial, investment, legal, or property advice. The Greater Southern Waterfront projections are based on URA planning documents and are subject to change. Readers should conduct their own due diligence and consult a licensed property agent, conveyancing solicitor, and independent financial adviser before making any property purchase decision. Official resources: URA, HDB, IRAS, MAS.

×

Click anywhere to close

Singapore Turf City Transformation 2026: How the Bukit Timah Masterplan Could Lift D10 and D11 Property Values

Singapore Turf City Transformation 2026: How the Bukit Timah Masterplan Could Lift D10 and D11 Property Values

⚡ Quick Answer: Turf City Transformation and D10/D11 Property Outlook

  • What is happening to Turf City? The former Singapore Turf Club premises at Bukit Timah Road, covering approximately 161 hectares, are being progressively redeveloped as part of Singapore’s Long-Term Plan Review for the 2030–2040 horizon.
  • Location: Bukit Timah Road, primarily within District 10 (Buona Vista/Holland/Tanglin boundary); bordering District 21 (Bukit Timah/Upper Bukit Timah).
  • Planned uses: Mixed-use including residential, sports and recreation, hotel/hospitality, retail, F&B, and significant green buffers. No specific GFA breakdown has been gazetted as at July 2026.
  • Timeline: Phased development over 10–20 years; near-term interim sports and community uses are expected from 2024–2027.
  • Property impact: Industry analysis suggests the Turf City masterplan could add 3–8% to PSF values in the closest D10/D11 sub-districts once the first phase of development is confirmed and under way.
  • Key nearby projects: The Opus, 19 Nassim, Bishopsgate Residences, and various freehold landed properties in Coronation Road, Farrer Road, and Bukit Timah Road environs.
  • For buyers: The full masterplan is not yet gazetted. Investors should treat Turf City upside as speculative but directionally positive given the historical value lift seen at Fusionopolis (one-north) and the Marina Bay precinct.

Turf City’s Transformation: What Is Changing and Why It Matters

When the Singapore Turf Club relocated its racing operations to Kranji in 1999, the sprawling 161-hectare Turf City site on Bukit Timah Road entered a prolonged interim phase — partially leased to recreation operators, event venues, car showrooms, and equestrian clubs — while the government deliberated on its long-term future. That deliberation has now moved into a more active planning phase. Under Singapore’s Long-Term Plan Review (LTPR), the Turf City site is designated for a major mixed-use transformation that, when complete, will introduce thousands of new residential units, substantial commercial and hospitality uses, and extensive green amenity into one of Singapore’s most prestigious residential corridors.

Industry analysis published in July 2026 examined the potential property value impact of this transformation on the surrounding Districts 10 and 11 — two of Singapore’s most expensive and tightly-supplied residential districts. This LovelyHomes analysis draws on URA’s published planning intentions, publicly available transaction data, and the lessons of comparable Singapore placemaking transformations to assess the opportunity and its limitations for property buyers and investors.

Note: The Turf City masterplan has not yet been publicly gazetted with specific development parameters. All planning details referred to in this article are drawn from URA’s published Long-Term Plan Review documents and publicly available information. Buyers should not rely on this article for specific investment decisions and should monitor URA announcements directly.

What the URA Masterplan Says About Turf City

URA’s 2019 Master Plan and the subsequent 2022 Long-Term Plan Review (LTPR) designated the Turf City area as a significant future development node. The LTPR’s concept plan for this precinct identifies several planning intents:

  • Mix of uses: The plan envisions residential development integrated with sports and recreation facilities, acknowledging that Turf City’s large green footprint and parkland character should be substantially preserved. Unlike a purely commercial-residential development, the green open space ratio is expected to be high — potentially 40–50% of the site retained as parks, nature buffers, and green corridors connecting to the Rail Corridor and Bukit Timah Nature Reserve.
  • Sports and recreation anchor: Given the site’s equestrian history and existing facilities, URA has signalled that major sports and recreation infrastructure will be a centrepiece — potentially including a new sports hub or equestrian park serving the western Singapore population.
  • Residential quantum: While no specific flat count has been published, the scale of the site (161 ha compares to one-north’s 200 ha) suggests a potentially significant number of homes — possibly 3,000–8,000 units over multiple phases, based on typical Singapore mixed-use plot ratio norms and the green space retention commitment.
  • Phasing: Turf City redevelopment is expected to take 15–25 years. The first GLS (Government Land Sales) tender for a Turf City sub-parcel has not yet been announced as at 10 July 2026. Near-term uses include the existing recreational tenants (many on short-term leases), and the Singapore Racecourse Master Plan is subject to ongoing stakeholder consultation.
Turf City Singapore masterplan transformation Districts 10 and 11 property values 2026
Figure 1: Districts 10 and 11 property overview — current PSF ranges, school catchments, and estimated Turf City masterplan impact by sub-district. Source: URA / industry analysis / LovelyHomes research.

How D10 and D11 Property Markets Are Currently Positioned

Districts 10 and 11 together represent the upper tier of Singapore’s residential property market outside of the super-premium District 9 (Orchard/River Valley) and District 1 (Raffles Place/Marina). Both districts are characterised by a high proportion of freehold and 999-year tenure land, proximity to Singapore’s premier primary schools (SCGS, RGS, ACS (Independent), MGS, CCFPPS), and established address prestige that commands a persistent premium over Rest of Central Region (RCR) and Outside Central Region (OCR) comparables.

As at Q2 2026, the indicative non-landed private residential PSF ranges in D10 and D11 are approximately:

District / Sub-Area Indicative PSF Range (Q2 2026) Typical 2BR Resale Price Tenure Characteristics
D10 — Holland Road / Bukit Timah Road corridor S$2,400–S$3,400 PSF S$2.2M–S$3.4M Predominantly freehold / 999-yr
D10 — Farrer Road / Stevens Road S$2,600–S$3,600 PSF S$2.5M–S$3.8M Mix of freehold and 99-yr leasehold
D11 — Newton / Novena S$2,200–S$3,200 PSF S$1.8M–S$3.0M Mix; Novena corridor 99-yr heavy
D11 — Watten / Dunearn S$2,400–S$3,200 PSF S$2.2M–S$3.2M Predominantly freehold
D21 — Bukit Timah / King Albert Park (adjacent to Turf City) S$1,900–S$2,600 PSF S$1.6M–S$2.5M Mix; some 999-yr old estates

The Turf City site itself straddles the D10/D21 boundary. The sub-districts most directly adjacent — the Coronation Road / Farrer Road / Bukit Timah Road triangle — already trade at the upper end of D10 pricing, reflecting both school proximity (five top primary schools within 1–2 km) and the existing parkland premium from Bukit Timah Nature Reserve and the Rail Corridor.

Historical Precedents: What Placemaking Does to Singapore Property Values

Singapore has a strong track record of using master-planned precincts to drive medium-term property value uplift in surrounding neighbourhoods. Several precedents are instructive:

One-north (Buona Vista): The Fusionopolis and Biopolis development at one-north, launched from 2001 and substantially built out by 2015, transformed a former industrial estate into a knowledge-economy hub. Property values in the immediately surrounding residential areas (Rochester Park, Ghim Moh, Clementi Park) appreciated significantly ahead of broader Singapore market trends during the 2005–2020 period, as the employment node matured and transport connectivity (Circle Line one-north station) delivered.

Marina Bay (Districts 1–2): The Marina Bay Sands integrated resort and Marina Bay Financial Centre, developed between 2005 and 2013, created one of the most dramatic property value catalysts in Singapore history. The broader Tanjong Pagar and Marina Bay sub-district saw PSF appreciation of 60–90% between 2007 and 2019, well above the Singapore-wide average.

Punggol (Waterway) and Tengah: HDB’s Punggol Waterway and the ongoing Tengah “Forest Town” development demonstrate that even in OCR public housing, master-planned green and amenity precincts command a meaningful premium (approximately 3–8% based on URA resale transaction data for comparable flats within vs outside the precinct boundary).

The Turf City precedent is closest to one-north in character: a large brownfield/interim-use site in an established residential precinct, being redeveloped with a mixed-use programme that preserves substantial green space. The one-north uplift, when adjusted for broader market trends, was approximately 5–12% for the closest residential properties over the decade following the first GLS tender award.

LovelyHomes’ Assessment: Is Turf City a Compelling Property Play?

The Turf City transformation presents a genuine medium-to-long-term opportunity for property investors in D10 and D21 — but it comes with meaningful caveats that distinguish it from a straightforward near-term trade.

The bull case is straightforward: Turf City will introduce significant employment, amenity, and population density into one of the most undersupplied premium residential corridors in Singapore. The Rail Corridor connectivity, proximity to Bukit Timah Nature Reserve, and the school catchment (virtually unique in offering five top primary schools within walking distance) mean that any new residential supply in the precinct is likely to face strong demand — and the uplift to surrounding existing properties from improved precinct vitality should be positive.

The bear case centres on two risks. First, timeline: Turf City redevelopment will take 15–25 years to materialise meaningfully. Investors who buy near-Turf City properties today expecting a 2–3 year capital uplift are likely to be disappointed. Second, supply: if the residential quantum is large (3,000–8,000 units), the new supply itself may partially offset the precinct uplift — particularly in the first decade when construction activity depresses the perceived liveability of the immediate surrounds.

LovelyHomes’ view: The most advantaged properties in a Turf City transformation scenario are existing freehold condominiums and landed properties on Coronation Road, Farrer Road, and the Bukit Timah Road corridor between D10 and D21 — within 800m of the site boundary. These are already premium assets; the Turf City announcement provides structural support for their long-term price floor rather than an immediate uplift catalyst. Buyers who prioritise school proximity (SCGS and RGS catchment), freehold tenure, and green access as primary criteria will find these properties attractive independent of the Turf City story.

FAQ: Turf City Transformation and D10/D11 Property

When will Turf City redevelopment begin and what will be built first?

As at 10 July 2026, URA has not published a specific development timeline or issued a GLS tender for Turf City sub-parcels. The current phase is characterised by interim recreational uses and ongoing masterplan consultation. Industry estimates suggest the first GLS tender could be launched in 2027–2028, with the first major development completing in the early 2030s. The precise sequencing will depend on URA’s decision on whether to prioritise the sports/recreation anchor (which would require significant infrastructure lead time) or the residential component. Buyers interested in properties adjacent to the site should monitor URA’s press releases at ura.gov.sg for official announcements.

Will Turf City affect HDB flat prices in Districts 10/11 or nearby towns?

There are very few HDB flats in the immediate Turf City vicinity — D10 and D21 are predominantly private residential districts. The nearest substantial HDB stock is in Clementi (D5), Queenstown (D3), and Bukit Timah (D21 fringes). For HDB owners in these areas, the Turf City transformation is unlikely to have a direct price impact in the near term. The effect, if any, would operate through general neighbourhood attractiveness and amenity improvements — factors that affect all property types, but with a longer and less direct transmission mechanism than for adjacent private properties. HDB owners in Clementi and Bukit Timah should monitor broader market trends, the HDB Q2 2026 full data release (~23 July 2026), and the upcoming October 2026 BTO launch for a more relevant read on their local market.

Are there any new launches or upcoming projects in D10 or D11 that could benefit from Turf City?

As at July 2026, several new-launch projects in D10 and D11 are either recently launched or in pipeline. Dunearn House (D11, Bukit Timah/Dunearn Road corridor) previewed on 10 July 2026 with prices from approximately S$2,799 PSF — benefiting from the Bukit Timah Road premium and proximity to top schools. The new-launch pipeline in D10/D21 is thin, reflecting the scarcity of GLS or collective sale sites in this tightly-held freehold belt. Buyers seeking new-launch exposure to the Turf City theme would need to look at the upcoming GLS confirmed list (2H2026 GLS list includes no D10/D21 confirmed sites as at this writing). The most practical approach is the resale market — existing freehold condominiums within 800m of Turf City.

Should I buy in D10 or D21 now in anticipation of the Turf City masterplan?

LovelyHomes does not provide investment recommendations. Factually, the current D10 and D21 markets are already pricing in a degree of “masterplan optionality” — freehold properties in the Bukit Timah Road and Farrer Road corridors trade at a consistent premium to comparable leasehold properties in RCR. The Turf City story has been discussed in the market since at least 2019 and is not new information in 2026. Any buyer who acts on this theme should have a minimum 8–10 year investment horizon, sufficient to see meaningful precinct development materialise, and should ensure the property’s current fundamentals (location, tenure, floor plan, school catchment, MRT connectivity) justify the investment independent of the Turf City thesis. The Turf City upside is a potential enhancement — not the primary investment rationale. Speak to a licensed property agent and financial adviser before transacting.

How does the Rail Corridor affect D10/D21 values near Turf City?

The Rail Corridor — the 24-km green strip running from Tanjong Pagar Railway Station to the Woodlands Checkpoint — cuts directly through the Turf City vicinity, connecting the site to Bukit Timah Nature Reserve to the north and the Queensway/Alexandra green corridor to the south. NParks has progressively activated the Rail Corridor as a recreational trail since 2021, and phase-by-phase improvements have added rest nodes, cycling paths, and community spaces. Properties within 200–400m of the Rail Corridor in D10 and D21 have consistently commanded a green-corridor premium in Singapore’s transaction data — a pattern confirmed by URA’s own analysis of comparable resale prices. For Turf City-adjacent properties, Rail Corridor access and Bukit Timah Nature Reserve proximity are compounding green premiums that pre-exist the Turf City transformation and will persist regardless of its timeline.

Related Articles

Disclaimer: This article is for general informational and analytical purposes only and does not constitute investment or financial advice. Property values are subject to change. The Turf City masterplan has not yet been publicly gazetted with specific development parameters; all planning information in this article is drawn from URA’s published documents and publicly available sources. URA’s press releases are available at ura.gov.sg. Seek advice from a licensed property agent (CEA-registered) and a licensed financial adviser before making property investment decisions. This article was accurate as at 10 July 2026.
×Click anywhere outside to close

Singapore BCA Green Mark Guide 2026: Ratings, Mandatory Requirements and Property Value Impact

Singapore BCA Green Mark Guide 2026: Ratings, Mandatory Requirements and Property Value Impact

⚡ Quick Answer: BCA Green Mark Singapore 2026 — Key Takeaways

  • What is Green Mark? Singapore’s national green building certification, administered by the Building and Construction Authority (BCA). Launched in 2005; mandatory for new buildings since 2008.
  • Rating tiers (GM:2021 framework): Certified (≥50 pts), Gold (≥65 pts), GoldPLUS (≥75 pts), Platinum (≥85 pts), and higher tiers: SLE (Super Low Energy), Zero Energy, Positive Energy.
  • Who must comply? All new private residential developments with ≥2,000 sqm GFA must achieve at least Green Mark Certified. New commercial/institutional buildings ≥5,000 sqm have been mandatory since 2008.
  • PSF premium: Industry research estimates Green Mark Platinum residential buildings command a 5–8% PSF premium over comparable non-certified buildings in Singapore.
  • 2030 target: 80% of all Singapore buildings (by GFA) to be certified Green Mark under the Singapore Green Building Masterplan 3.0 (2021).
  • GM:2021 framework: Evaluates 7 categories — Energy, Water, Indoor Environment Quality, Materials, Responsible Construction, Smart Building, and Resilience.
  • BCA’s SLE standard: Super Low Energy buildings must achieve 60–80% energy savings versus the 2005 baseline — the key threshold for the highest practical tier.
  • For buyers: Check the developer’s BCA Green Mark certification certificate; Platinum and SLE ratings are the strongest proxy for long-term running cost savings and resale premium.

What is the BCA Green Mark Scheme?

The BCA Green Mark scheme is Singapore’s comprehensive framework for certifying the environmental sustainability of buildings. Administered by the Building and Construction Authority (BCA) — a statutory board under the Ministry of National Development — Green Mark evaluates buildings across seven dimensions: energy efficiency, water efficiency, indoor environment quality, construction materials, responsible construction practices, smart building technology, and resilience to climate change.

Launched in January 2005, Green Mark began as a voluntary certification for new commercial buildings. Within three years, the government made it mandatory for most new developments above a minimum floor area threshold. Today, Green Mark certification is not merely a sustainability badge: it affects construction costs, operating costs, rental values, capital values, and — in the Singapore property market’s increasingly climate-aware investor base — investment attractiveness.

This guide covers everything a Singapore property buyer, investor, or homeowner needs to know about Green Mark: the rating tiers, what they mean in practice, the mandatory requirements, the financial implications for property values, and where the scheme is heading by 2030 and beyond.

BCA Green Mark rating tiers GM:2021 Singapore 2026 Certified Gold Platinum SLE Zero Energy
Figure 1: BCA Green Mark rating tiers under the GM:2021 framework — from Certified (≥50 points) through to Positive Energy (net exporter to the grid). Source: BCA Singapore.

BCA Green Mark Rating Tiers Explained

The GM:2021 framework, which came into effect for projects applying for a building permit from 1 April 2021, introduced a unified scoring system of 100 points across seven categories, with conditional requirements at each tier. Older projects certified under GM:2015 or earlier frameworks retain their certification but are assessed under the criteria applicable at the time of their certification.

Rating Tier Minimum Points Key Additional Requirements What It Means in Practice
Certified ≥ 50 Meet minimum mandatory requirements in all 7 categories Entry-level: satisfies regulatory minimum for mandatory submissions
Gold ≥ 65 Achieve conditional requirements in at least 2 categories Above-baseline; most new mass-market condos target this tier
GoldPLUS ≥ 75 Achieve conditional requirements in at least 3 categories; demonstrate energy reduction ≥20% vs 2005 baseline Mid-tier; common in mid-range residential projects in RCR and OCR
Platinum ≥ 85 Conditional requirements across most categories; energy reduction ≥25% vs 2005 baseline Premium standard; associated with higher PSF and developer prestige
SLE (Super Low Energy) Platinum ≥ 85 + SLE standard Achieve the SLE performance standard: EEI ≤35 kWh/m²/yr (non-residential) or EUI benchmark (residential) Best-in-class; required for future-proof buildings and GovTech properties
Zero Energy SLE standard + net zero Annual net energy consumption = zero (generation equals consumption) Rare; achieved by a handful of institutional buildings in Singapore
Positive Energy SLE standard + net export Annual net energy export to the grid exceeds consumption Aspirational; achieved by specific solar-optimised low-rise structures

In residential property, the vast majority of new condominiums launched in Singapore from 2018 onwards have achieved at least Green Mark Gold. Platinum has become the differentiating tier for premium developments, while SLE (Super Low Energy) remains rare in residential use — it is more common in institutional and government buildings where energy modelling is more granular.

Why Green Mark Matters for Singapore Property Buyers and Investors

For most Singapore property buyers, Green Mark certification is background noise: a certificate in the showflat, a line in the developer’s brochure. But the financial implications are more tangible than most buyers realise, operating through three channels: running costs, resale values, and regulatory future-proofing.

Running costs: A Green Mark Platinum condominium typically consumes 25–35% less energy per square metre than a pre-2005 building. For an owner-occupier, this translates to lower electricity bills for air-conditioning (the dominant energy use in Singapore homes), lower common area utility charges (reflected in maintenance fees), and lower air-conditioning servicing intervals. For a rental property, energy efficiency is increasingly a draw card for corporate tenants and expatriates from markets where green credentials are standard expectations.

Resale values: Industry analysis consistently identifies a PSF premium for Green Mark certified buildings in Singapore. While premium buildings tend to be concentrated in CCR and RCR where premium is harder to isolate from location, studies examining comparable pairs of certified vs non-certified condominiums in similar locations have identified statistically significant premiums at higher rating tiers. As the mandatory minimum certification level for all new buildings raises the baseline, the marginal premium for Certified and Gold tiers is expected to compress — while Platinum and SLE buildings may attract stronger relative premiums as the market bifurcates.

Green Mark PSF premium estimated by region OCR RCR CCR 2026 Certified Gold GoldPLUS Platinum
Figure 2: Estimated Green Mark PSF premium vs non-certified comparable buildings, by region and rating tier (2026). Premiums are industry estimates; actual outcomes vary by location, age and market conditions. Source: BCA / industry analysis / LovelyHomes research.

Mandatory Green Mark Requirements: What Developers Must Achieve

The mandatory Green Mark requirement for new residential developments was established by the Building Control (Environmental Sustainability) Regulations 2008, which came into effect on 15 April 2008. These regulations have been progressively tightened and the threshold types have broadened across subsequent revisions in 2013, 2018, and 2022.

As at 2026, the mandatory minimum requirements are:

  • New private residential buildings ≥2,000 sqm GFA: Green Mark Certified (minimum).
  • New commercial/retail/institutional buildings ≥5,000 sqm GFA: Green Mark Certified (minimum).
  • Government buildings (all new and major refurbishments): Green Mark GoldPLUS or better, since 2012.
  • Existing buildings undergoing major retrofits (≥50% mechanical and electrical works): Green Mark Certified (minimum), triggered since 2014.
  • All large new buildings from 2030 target: Super Low Energy standard as the mandatory floor.

In practice, most reputable Singapore developers now voluntarily target Platinum or GoldPLUS even where Gold would satisfy the regulatory minimum — partly for marketing differentiation, partly because the incremental cost of moving from Gold to Platinum (typically 1–3% of construction cost) is recoverable through PSF premium and tenant demand.

BCA Green Mark Policy Timeline

BCA Green Mark policy timeline 2005 to 2030 Singapore green building mandatory requirements
Figure 3: BCA Green Mark policy milestones from 2005 to the 2030 target. The scheme has progressively tightened its mandatory minimum and introduced advanced tiers (SLE, ZE, PE). Source: BCA Singapore.

Singapore Green Building Masterplan 3.0 and the 2030 Roadmap

Singapore’s commitment to green buildings accelerated materially with the Singapore Green Plan 2030 (launched February 2021) and its accompanying Singapore Green Building Masterplan (SGBMP) 3.0, published in March 2021 by the BCA in partnership with the Singapore Green Building Council.

SGBMP 3.0 sets three headline targets:

  • 80% of buildings (by GFA) to be certified Green Mark by 2030. This is measured against Singapore’s total building stock, not just new construction.
  • 80% of new buildings (by GFA) from 2030 to achieve Super Low Energy performance. This is a major step-up from the current Certified minimum.
  • Best-in-class buildings to achieve Zero Energy or Positive Energy performance by 2030.

To meet these targets, the BCA has expanded its incentive programmes (the Green Mark Incentive Scheme for Existing Buildings — GMIS-EB) and introduced the Super Low Energy (SLE) call for projects, which provides funding of up to S$2 million per project for owners of existing buildings pursuing SLE retrofits. For new developments, the mandatory minimum has been incrementally tightened, and from 2030, the target is for all new buildings to meet SLE as the baseline.

Worked Example: Green Mark in a Real Singapore Property Investment Decision

📚 Case Study: Ms Loh — Comparing a Platinum vs Gold+ 2BR Condo in the RCR

Background: Ms Loh (Singapore Citizen) is comparing two new-launch 2-bedroom condominiums in the Rest of Central Region (RCR), both within 300m of the same MRT station and with broadly similar layouts and project sizes.

Property A: Green Mark GoldPLUS. Developer launch price: S$1,850,000 (S$2,200 PSF). Estimated monthly maintenance fee: S$550. Estimated annual utility costs: S$3,800.

Property B: Green Mark Platinum (and SLE pre-qualified). Developer launch price: S$1,940,000 (S$2,307 PSF). Estimated monthly maintenance fee: S$520. Estimated annual utility costs: S$2,900.

Upfront cost premium: Property B costs S$90,000 (4.9% PSF premium) more at launch.

Annual operating savings on Property B:

  • Maintenance fee saving: (S$550 − S$520) × 12 = S$360/yr
  • Utility cost saving: S$3,800 − S$2,900 = S$900/yr
  • Total annual saving: S$1,260

Payback period: S$90,000 ÷ S$1,260/yr ≈ 71 years from operating savings alone. However, the investment calculus also includes the expected resale premium at exit (typically 5+ years later), which industry analysis suggests could recover 3–5% of the premium in a well-maintained Platinum building vs a similarly-aged GoldPLUS building in the same location.

Investment perspective: If Ms Loh holds Property B for 8 years and sells at a modest 3% PSF premium vs Property A’s resale value, the Platinum premium recovers approximately S$58,200 at exit (3% × S$1,940,000), reducing the net premium to S$31,800. Combined with S$10,080 in operating savings over 8 years, the net cost of the Platinum premium is approximately S$21,720 over the holding period — less than 1.2% of the purchase price.

Conclusion for buyers: Green Mark Platinum is increasingly worth paying for in prime RCR and CCR locations with strong resale depth; it is less compelling in deep OCR locations with shallower investment demand. Check the actual BCA rating on the developer’s marketing materials and verify the certificate number at bca.gov.sg/greenmark.

How Green Mark Affects Singapore Rental Values

Beyond the purchase price, Green Mark certification increasingly influences the rental market — particularly in the corporate and expatriate segment of the Singapore residential market. Multinational corporations relocating staff to Singapore are under pressure from their own ESG (environmental, social and governance) reporting obligations to demonstrate that the accommodation they provide meets sustainability standards. For larger serviced residences and corporate lettings, Green Mark Platinum or SLE certification has become a checklist item.

In the commercial market, this effect is far more pronounced. Grade-A offices with Green Mark Platinum certification in the CBD can command rental premiums of 8–12% over comparable non-certified Grade-B buildings — a premium that has been expanding as Singapore-listed companies and multinationals integrate building sustainability into their corporate real estate procurement. The BCA’s Green Mark Occupancy premium tracking indicates that vacancy rates in Green Mark Platinum commercial buildings have been consistently lower than the broader Grade-A market since 2020.

For residential landlords, the premium remains softer but is directionally positive, particularly in the CCR. LovelyHomes’ analysis of rental transactions in Districts 1–11 suggests that comparable units in Green Mark Platinum buildings command roughly 3–6% higher monthly rents than equivalent units in non-certified buildings of similar vintage, with the gap widening for newer SLE-certified developments.

What Might Come Next for Green Mark?

As Singapore approaches its 2030 milestone, BCA has signalled that the mandatory minimum for new buildings will progressively tighten towards SLE performance. Beyond 2030, Singapore’s net-zero 2050 commitment (announced at COP26) implies that all new buildings will eventually need to approach Zero Energy performance as the grid decarbonises.

For property investors, the most practical implication is generational: buildings built to today’s GoldPLUS standard that are not upgradable to SLE may face stigma in the 2035–2040 resale market, as buyers increasingly expect and demand the highest certified tier from new launches. This mirrors a pattern already visible in the office market, where older LEED/Green Mark Gold commercial buildings face compression of their yield relative to modern Platinum equivalents.

FAQ: BCA Green Mark Singapore 2026

How do I check if a Singapore condo is Green Mark certified?

BCA maintains a public registry of all Green Mark certified buildings at bca.gov.sg/greenmark. You can search by project name, address, or developer. Each listing shows the certification tier, the applicable framework (GM:2015, GM:2021, etc.), and the certificate validity period. For new-launch condominiums, developers are required to display the Green Mark certification prominently in their marketing materials; if a project is in construction, the provisional Green Mark award (if applicable) will be listed on BCA’s portal. If no record exists, the building is either not certified or is so old it pre-dates the mandatory period.

Does Green Mark certification expire?

Yes. Green Mark certification is valid for three years, after which the building owner must apply for renewal. The renewal assessment checks whether the building’s systems continue to perform at the certified level — energy consumption, water usage, indoor environment quality, and so forth. Buildings that fail to maintain performance can be downgraded or lose certification entirely. For new buildings, the provisional Green Mark award during construction is converted to a full certification upon Temporary Occupation Permit (TOP). For buyers, it is worth checking that the certification has been renewed and is current, particularly for buildings that were certified in the early years of the scheme (2005–2012) under now-superseded frameworks.

Is Green Mark certification the same as LEED or BREEAM?

Green Mark is Singapore’s own national scheme, developed by BCA to address Singapore’s specific tropical climate, building typologies, and regulatory context. LEED (Leadership in Energy and Environmental Design) is the US-based scheme administered by the US Green Building Council, while BREEAM (Building Research Establishment Environmental Assessment Method) is the UK-based equivalent. All three are internationally recognised. Singapore allows buildings to seek both Green Mark and LEED (or BREEAM) certification simultaneously — dual certification is common for premium office developments targeting international corporate tenants. For Singapore residential properties, Green Mark is the dominant and most relevant certification; LEED residential certifications are comparatively rare in the Singapore market.

Does Green Mark affect my Singapore property tax or ABSD?

Green Mark certification does not directly affect stamp duties (ABSD, BSD, SSD) or property tax calculations. IRAS determines Annual Value (AV) and property tax based on estimated market rental value, which may be marginally higher for Green Mark Platinum buildings given the rental premium evidence — but this effect, if any, is indirect and operates through market rents rather than a specific Green Mark adjustment. There is no tax incentive or rebate for residential property owners specifically linked to Green Mark status. For commercial buildings, BCA’s GMIS-EB incentive scheme provides a grant of up to S$2 million for qualifying retrofits, but this is a capital grant to the building owner rather than a tax benefit.

What is the Singapore Green Building Masterplan 3.0 target for 2030?

The Singapore Green Building Masterplan 3.0 (SGBMP 3.0), published by BCA in March 2021, sets three headline targets. First: 80% of all Singapore buildings by gross floor area (GFA) to be certified Green Mark by 2030. Second: 80% of new buildings (by GFA) launched from 2030 to achieve Super Low Energy (SLE) performance — a major step up from the current mandatory minimum. Third: the most advanced buildings to achieve Zero Energy or Positive Energy performance by 2030, demonstrating what is possible with current technology. As at mid-2026, BCA reports approximately 57% of Singapore’s building GFA as certified Green Mark, placing the 2030 target within reach if the current pace of new construction and retrofitting continues.

As a condo buyer, should I prioritise Green Mark Platinum over location?

No — location remains the primary determinant of property value in Singapore, as in virtually all markets. Green Mark certification is a secondary factor that can add 3–8% PSF on a like-for-like basis, but it cannot compensate for a fundamentally inferior location, weaker catchment, or poorer connectivity. The practical rule of thumb: if you are choosing between two developments in the same micro-location with similar unit sizes and layouts, Green Mark tier is a meaningful tiebreaker — a Platinum building is worth paying a modest premium for over a Gold equivalent. But choosing a Platinum building in a secondary OCR location over a Gold building with superior MRT connectivity in the RCR would almost certainly be a poor investment decision. Prioritise: (1) location; (2) connectivity; (3) developer track record; (4) Green Mark tier.

Related Articles

Disclaimer: This article is for general informational purposes and does not constitute financial, investment, or legal advice. Green Mark certification levels, PSF premiums, and BCA policy targets are subject to change. PSF premium estimates are based on published industry research and are not guaranteed. Verify a building’s current certification status at bca.gov.sg. For investment advice, consult a licensed financial adviser. This article was accurate as at 10 July 2026.
×Click anywhere outside to close

Singapore Luxury Homes and Safe-Haven Demand: CCR Surges +2.0% in Q2 2026

Singapore Luxury Homes and Safe-Haven Demand: CCR Surges +2.0% in Q2 2026

Quick Answer: What Is Driving Singapore Luxury Home Sales in 2026?

  • Singapore’s Core Central Region (CCR) posted a +2.0% price increase in Q2 2026 — the strongest of any market segment and a sharp reversal from Q1’s tepid +0.6%.
  • Industry observers and URA data point to a safe-haven demand thesis: high-net-worth individuals from Asia and globally are channelling wealth into Singapore amid geopolitical uncertainty in 2026.
  • Good Class Bungalow (GCB) deals in H1 2026 are reported to average S$2,121 per square foot — near all-time highs despite lower transaction volumes.
  • Foreigner buying share of private residential transactions remains below 2% due to the 65% ABSD, but dollar volumes in the CCR continue to outpace other regions.
  • The luxury market is bifurcating: sub-S$3M OCR and RCR condos are softening (OCR -0.2%, RCR -1.4% in Q2 2026), while trophy assets above S$5M are tightening.
  • Singapore’s combination of rule of law, no capital gains tax, SGD strength, and geopolitical neutrality underpins its premium positioning among global wealth management centres.
  • Full Q2 2026 transaction data is expected from URA on 24 July 2026 — the flash estimate published 1 July 2026 covers pricing only, not full volumes.

CCR Surges 2.0% in Q2 2026 as Luxury Demand Returns

Singapore’s Core Central Region (CCR) property market recorded a 2.0% price increase in Q2 2026, according to the Urban Redevelopment Authority’s flash estimate released on 1 July 2026. This makes the CCR the best-performing segment of the entire private residential market for the quarter — outpacing the overall market gain of 0.5% and standing in sharp contrast to the Rest of Central Region (RCR, -1.4%) and Outside Central Region (OCR, -0.2%), which both posted price declines.

The CCR’s outperformance is particularly notable given the backdrop: the wider Singapore private residential market has been moderating since early 2025, with the URA Private Property Price Index (PPI) recording gains of just 0.9% in Q1 2026 and 0.5% in Q2 2026 — well below the 8.4% full-year gain of 2023. The surge in CCR prices reflects a specific dynamic: demand from wealth-preserving investors, both domestic and international, for premium Singapore residential assets.

The Safe-Haven Thesis: Why Singapore Is Attracting Global Wealth

Industry observers note that Singapore’s luxury property market has increasingly attracted demand driven not by speculative gain but by wealth preservation. Several structural factors reinforce Singapore’s position as a premium repository of global capital in 2026.

Geopolitical diversification: Ongoing conflicts in Europe, rising trade tensions between the United States and China, and political uncertainty in multiple Southeast Asian nations have prompted high-net-worth individuals to diversify their real-asset holdings into jurisdictions perceived as politically stable. Singapore — with its neutral foreign policy, independent judiciary, and transparent legal framework — is among a short list of global cities offering this combination.

No capital gains tax: Singapore does not tax capital gains on property disposal (subject to the IRAS’s anti-speculation rules around short-term trading). For investors holding a property for more than three years, any appreciation is fully exempt from tax. This contrasts sharply with major competing markets: the United Kingdom taxes property gains at 18–28%, Australia at the marginal income rate, and Hong Kong at stamp duty and property tax regimes that have been progressively tightened.

Singapore Dollar resilience: The Monetary Authority of Singapore (MAS) manages the Singapore Dollar within a policy band that has delivered steady appreciation against a trade-weighted basket since the 1980s. For USD or EUR-denominated investors, Singapore property effectively provides implicit currency protection alongside the real-asset yield.

Rule of law and property rights: Singapore property title is freehold or 99-year leasehold under a clear and well-enforced framework. Title searches are transparent, conveyancing is regulated, and disputes are adjudicated by courts with a strong track record of enforcing property rights. There is no risk of compulsory acquisition without fair compensation under the Land Acquisition Act.

Singapore private residential property price index CCR RCR OCR Q1 Q2 2026 URA flash estimate
Figure 1: Singapore Private Residential PPI — Q1 vs Q2 2026 by Market Segment. Source: URA (Q2 based on flash estimate, 1 July 2026).

The Luxury Segment in Numbers: What the Data Shows

The Q2 2026 URA flash estimate provides pricing data but not full transaction volumes — those will be released with the full Q2 statistics on approximately 24 July 2026. However, the H1 2026 market narrative is already forming from the available data points.

Market Segment Q1 2026 PPI Change Q2 2026 PPI Change (Flash) H1 2026 Direction
Overall Private Residential +0.9% +0.5% Moderating
Non-Landed Overall +1.3% -0.1% Softening
CCR (Core Central Region) +0.6% +2.0% Accelerating
RCR (Rest of Central Region) +0.8% -1.4% Correcting
OCR (Outside Central Region) +2.2% -0.2% Cooling
Landed Residential -0.4% +2.6% Rebounding

The data shows a clear bifurcation: mid-market mass-market condominiums (OCR and RCR) are softening or correcting, while the premium CCR segment and landed residential — the two categories most associated with high-net-worth buying — are strengthening. This is consistent with the safe-haven demand thesis: wealth-preserving buyers are focused on premium Singapore assets, not the mass-market segment where supply from new GLS sites is more acute.

Landed residential and GCBs: Industry data cited in market commentary indicates that Good Class Bungalow (GCB) transactions in H1 2026 averaged approximately S$2,121 per square foot — near historical highs. While GCB volume has been subdued (fewer than 20–30 transactions per half typically), the average transacted PSF points to the depth of demand at the very top of the market. GCBs are the only residential asset class in Singapore where the absolute supply is fixed by planning policy: there are approximately 2,800 GCB plots gazetted in 39 designated GCB Areas, and no new GCB land has been released since the 1990s.

ABSD as a Structural Filter: Who Is Still Buying at the Top End?

The 65% ABSD for foreigners did not eliminate luxury CCR buying — it filtered it. At the S$5 million price point, a foreign buyer pays S$3,250,000 in ABSD alone. The buyers who can absorb this cost are a qualitatively different group from the pre-2023 foreign luxury buyer cohort: predominantly ultra-high-net-worth (UHNW) individuals or family offices for whom the ABSD represents a tolerable cost of admission to a prized asset class rather than a prohibitive barrier.

The primary luxury buyer base in 2026 remains Singapore Citizens and PRs, who face no ABSD (SC 1st property) or 5% ABSD (SPR 1st property) respectively. Singapore-based UHNW families who have grown their wealth over the past two decades through private equity, technology, or trade finance are the backbone of CCR demand. A secondary and growing segment is foreign family office principals who have established Single Family Office (SFO) structures in Singapore under the Monetary Authority of Singapore’s SFO incentive framework — these are resident in Singapore and may qualify for SC or PR status over time.

What This Means for Property Buyers in Singapore

The CCR’s Q2 2026 outperformance is both a market signal and a policy-test. It signals that the ultra-premium segment is resilient to macroeconomic headwinds and retains structural demand even at historically high price levels. The question for the government is whether this resilience in the top tier justifies ongoing caution about relaxing the foreigner ABSD — or whether the bifurcation (luxury up, mass-market softening) suggests the cooling measures are having their intended effect of segmenting demand without depressing the overall market.

For Singapore Citizens and PRs looking at the CCR, the data suggests that the window of Q4 2025 / Q1 2026 softness (CCR posted only +0.6% in Q1) may have already passed. If the CCR’s Q2 2026 momentum carries into Q3, the entry window could narrow further. Buyers targeting premium properties — Orchard Road, Sentosa Cove, River Valley, Buona Vista — may find pricing firming through the second half of 2026.

What Might Come Next

The full Q2 2026 private residential statistics from URA (expected 24 July 2026) will reveal whether the CCR volume recovery matched the price recovery. If CCR transaction volumes in Q2 2026 show a meaningful uptick from the subdued Q1 levels, it would confirm the demand recovery is broad-based rather than driven by a small number of high-value transactions. Conversely, a further Q3 2026 reading above +1.5% CCR PPI growth could bring the CCR back onto the radar of the government’s cooling measure review — though any specific policy response ahead of the next scheduled review is speculative.

The full Q2 2026 HDB resale statistics (expected from HDB around 23 July 2026) will provide a complementary read on the mass-market segment — and whether the flash estimate’s -0.3% RPI decline was accurately captured. Taken together, the two data releases in late July 2026 will give the market its clearest picture yet of whether Singapore’s property bifurcation — luxury strengthening, mass-market moderating — is the dominant theme for H2 2026.

Frequently Asked Questions

Why is the CCR doing better than the RCR and OCR in 2026?

The Core Central Region comprises Districts 1–4 and 9–11 — the prime downtown and Orchard Road belt. It attracts a qualitatively different buyer profile: high-income Singapore residents, wealth-preserving investors, and family office principals. This cohort is less sensitive to interest rate cycles and supply pipeline impacts because they are buying premium or trophy assets rather than investment units. In contrast, the RCR and OCR have seen more mid-market supply from new Government Land Sales (GLS) sites, and their buyer base — including upgraders and first-time condo buyers — is more sensitive to mortgage rates and HDB resale price trends.

Can foreigners still buy Singapore luxury property given the 65% ABSD?

Yes, but the economics have changed dramatically since the April 2023 cooling measures. On a S$5 million CCR condo, a foreign buyer faces S$3,250,000 in ABSD alone. This effectively restricts the foreign luxury buyer market to ultra-high-net-worth individuals or family office structures where the ABSD is an acceptable cost of entry. MAS data suggests foreign buyer volumes remain below 2% of all private residential transactions — but their average deal size is materially higher than the market average, meaning they contribute disproportionately to CCR dollar volume.

What is a Good Class Bungalow (GCB) and why are prices so high?

Good Class Bungalows are the most exclusive form of landed residential property in Singapore, located within 39 designated GCB Areas gazetted under the URA Master Plan. GCBs must occupy a minimum land area of 1,400 square metres (about 15,000 sqft) and are subject to strict development controls. The supply is fixed at approximately 2,800 plots — no new GCB land has been created since the 1990s. Combined with strong demand from Singapore’s wealthiest families and a long-standing restriction on foreign ownership (SLA approval required), GCBs represent the most inelastic supply in the Singapore property market. Average transacted PSF of approximately S$2,121 in H1 2026 reflects this structural scarcity premium.

When will the full Q2 2026 property transaction data be released?

The Urban Redevelopment Authority typically releases full quarterly private residential statistics approximately 3–4 weeks after the quarter ends. The Q2 2026 flash estimate (covering the PPI only) was released on 1 July 2026. The full data — including transaction volumes, unit counts, new sales, sub-sales, and resale transactions by region and property type — is expected around 24 July 2026. LovelyHomes will cover the full release when it is published. For HDB resale statistics, the Q2 2026 full data (including median prices by flat type and town) is expected around 23 July 2026.

Is Singapore’s luxury property market in a bubble?

This is a contested question among market analysts. Arguments against a bubble: Singapore property prices are underpinned by genuine end-use demand, a restricted land supply, and government cooling measures that actively suppress speculative demand; the ABSD itself is the most powerful anti-bubble tool in the market. Arguments for caution: CCR prices are near historical highs on a PSF basis; low transaction volumes mean that a small number of trophy deals can move the index; and if global macroeconomic conditions worsen materially — reducing the “safe-haven” narrative — demand could soften quickly. The MAS monitors private residential price trends closely through its Financial Stability Review process, and will act if it assesses that price growth is becoming detached from fundamentals. As at July 2026, the government has not signalled any concern about a bubble in the CCR.

Related Articles

Disclaimer: This article is for general information and editorial purposes only. Property market data is sourced from URA’s Q2 2026 flash estimate (released 1 July 2026) — full Q2 2026 data is expected on approximately 24 July 2026. GCB and luxury transaction figures are indicative industry data. This article does not constitute investment advice. Readers should conduct their own research and seek qualified advice before making any property or investment decisions. LovelyHomes.com.sg is not a licensed real estate agency.

Translate »