URA Q1 2026 Private Home Prices Rise 0.9% — Revised Up from +0.3% Flash, OCR Leads at +2.2%
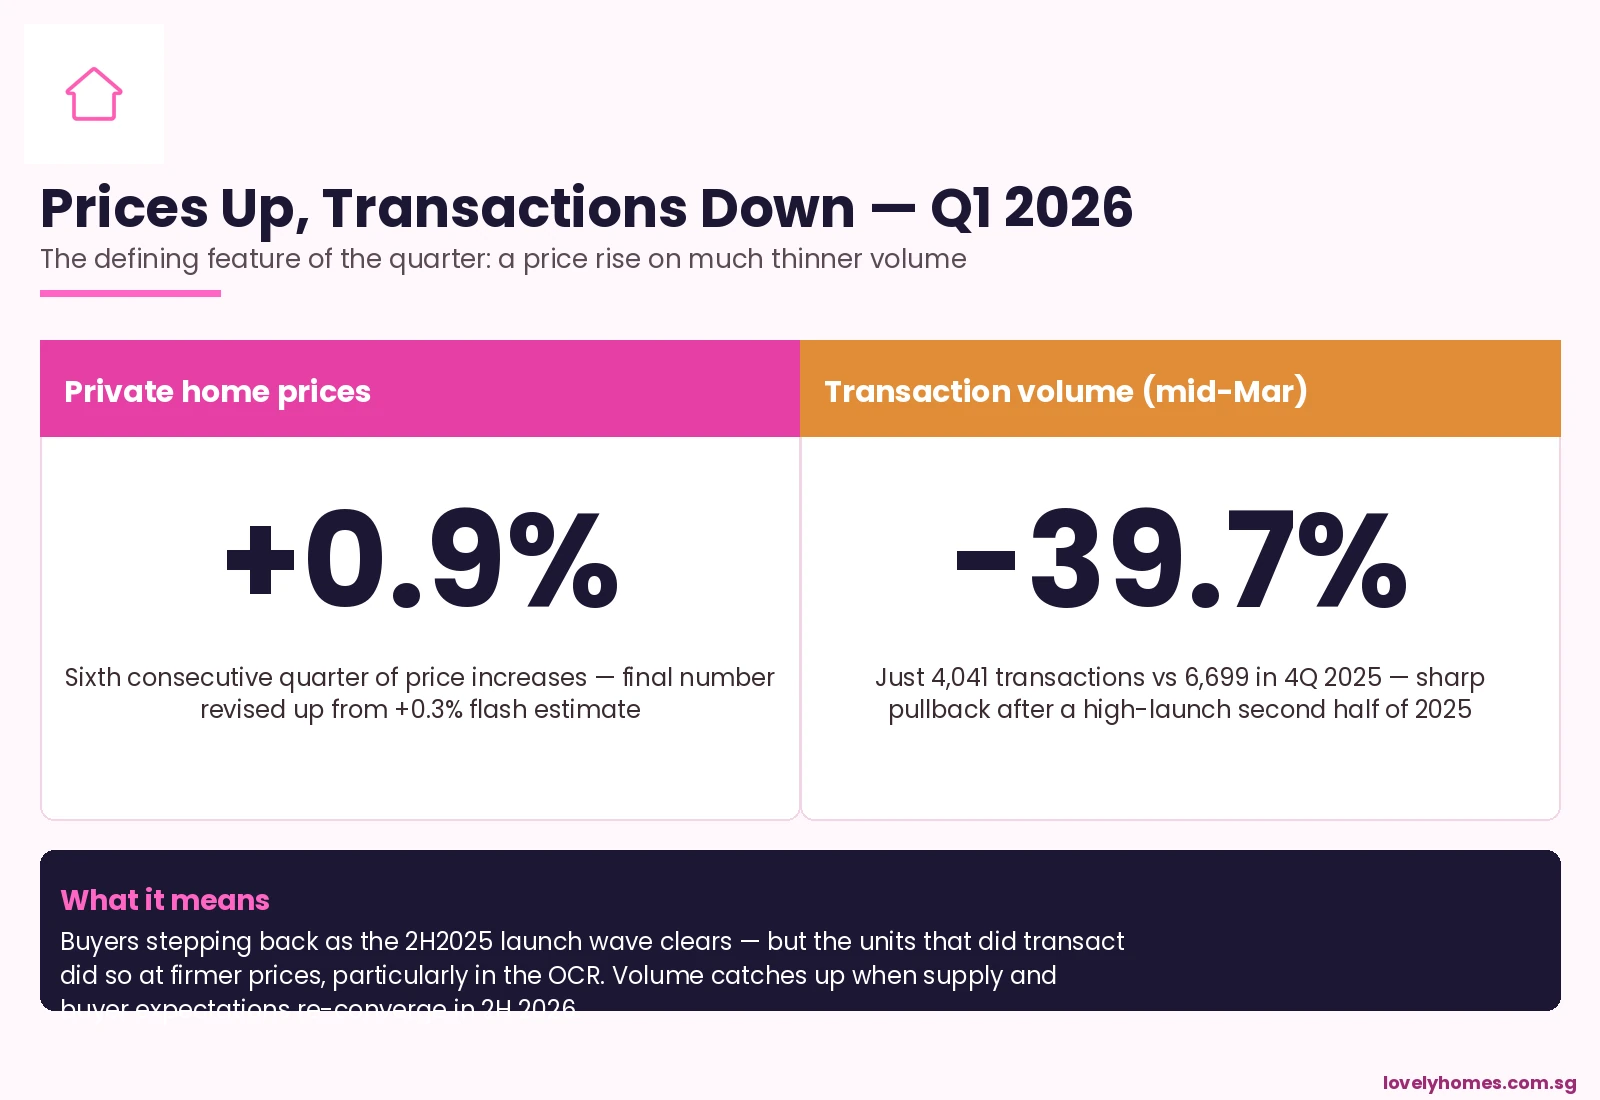
Singapore private home prices rose 0.9% in the first quarter of 2026 — almost three times the pace flagged in the URA flash estimate three weeks earlier. The final reading, published by the Urban Redevelopment Authority on 24 April 2026, marks the sixth consecutive quarter of growth in the private residential price index, and it tells a story that diverges sharply from the volume picture: prices firmed, but transactions slumped almost 40% quarter-on-quarter.
Quick Answer — what the URA Q1 2026 release shows
- Overall private residential PPI: +0.9% q-o-q, sixth consecutive quarter of growth.
- Sharp upward revision from the +0.3% flash estimate on 1 April.
- Non-landed properties: +1.3%; landed: -1.8%, reversing the +3.4% prior quarter.
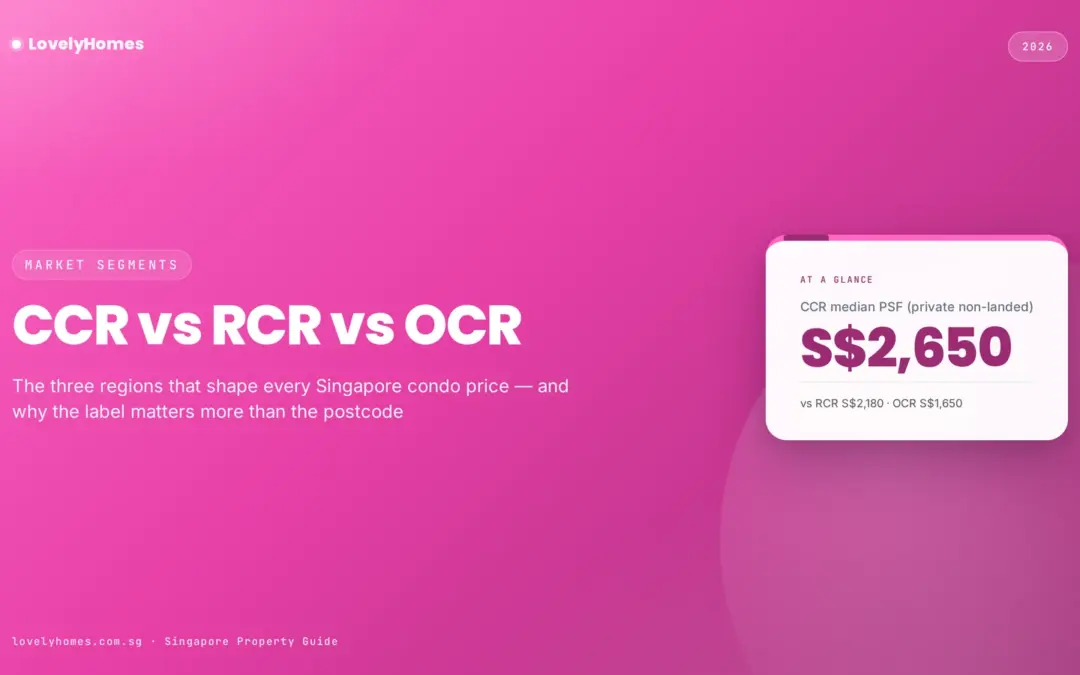
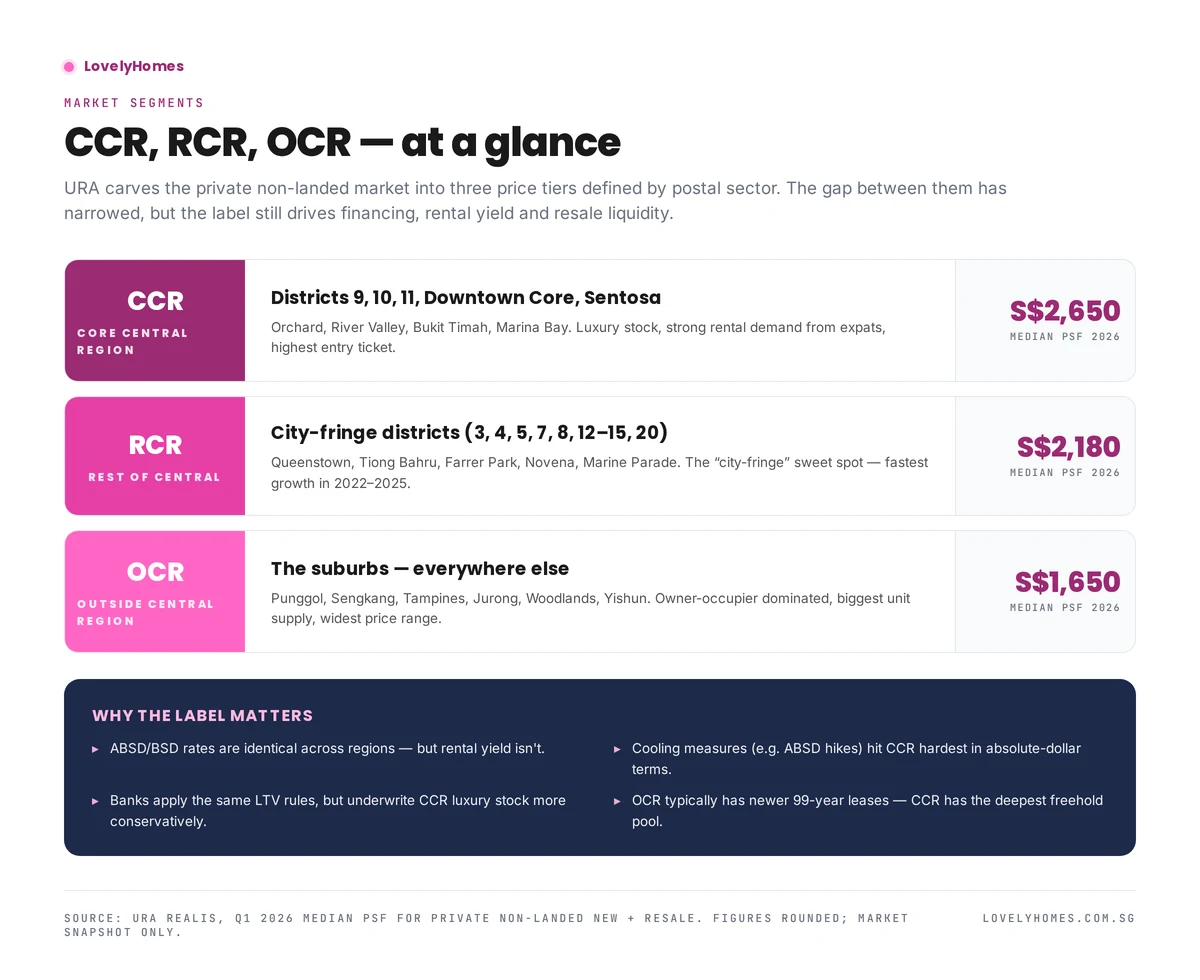
- OCR led non-landed with +2.2%; RCR +0.8%; CCR +0.6%.
- Transaction volume crashed: only 4,041 deals recorded by mid-March, -39.7% versus 4Q 2025.
- Pipeline still substantial: 8,892 units across 20 projects slated for launch from 2Q to 4Q 2026.
Flash to Final — A Substantial Upward Revision
URA flash estimates are released on the first business day of every quarter, before the full transaction sample is in. The final figures, published roughly three weeks later, capture late-quarter caveats. In most quarters the gap between flash and final is small — perhaps 0.1 to 0.3 percentage points. In Q1 2026 the gap was larger than usual: from +0.3% to +0.9%.
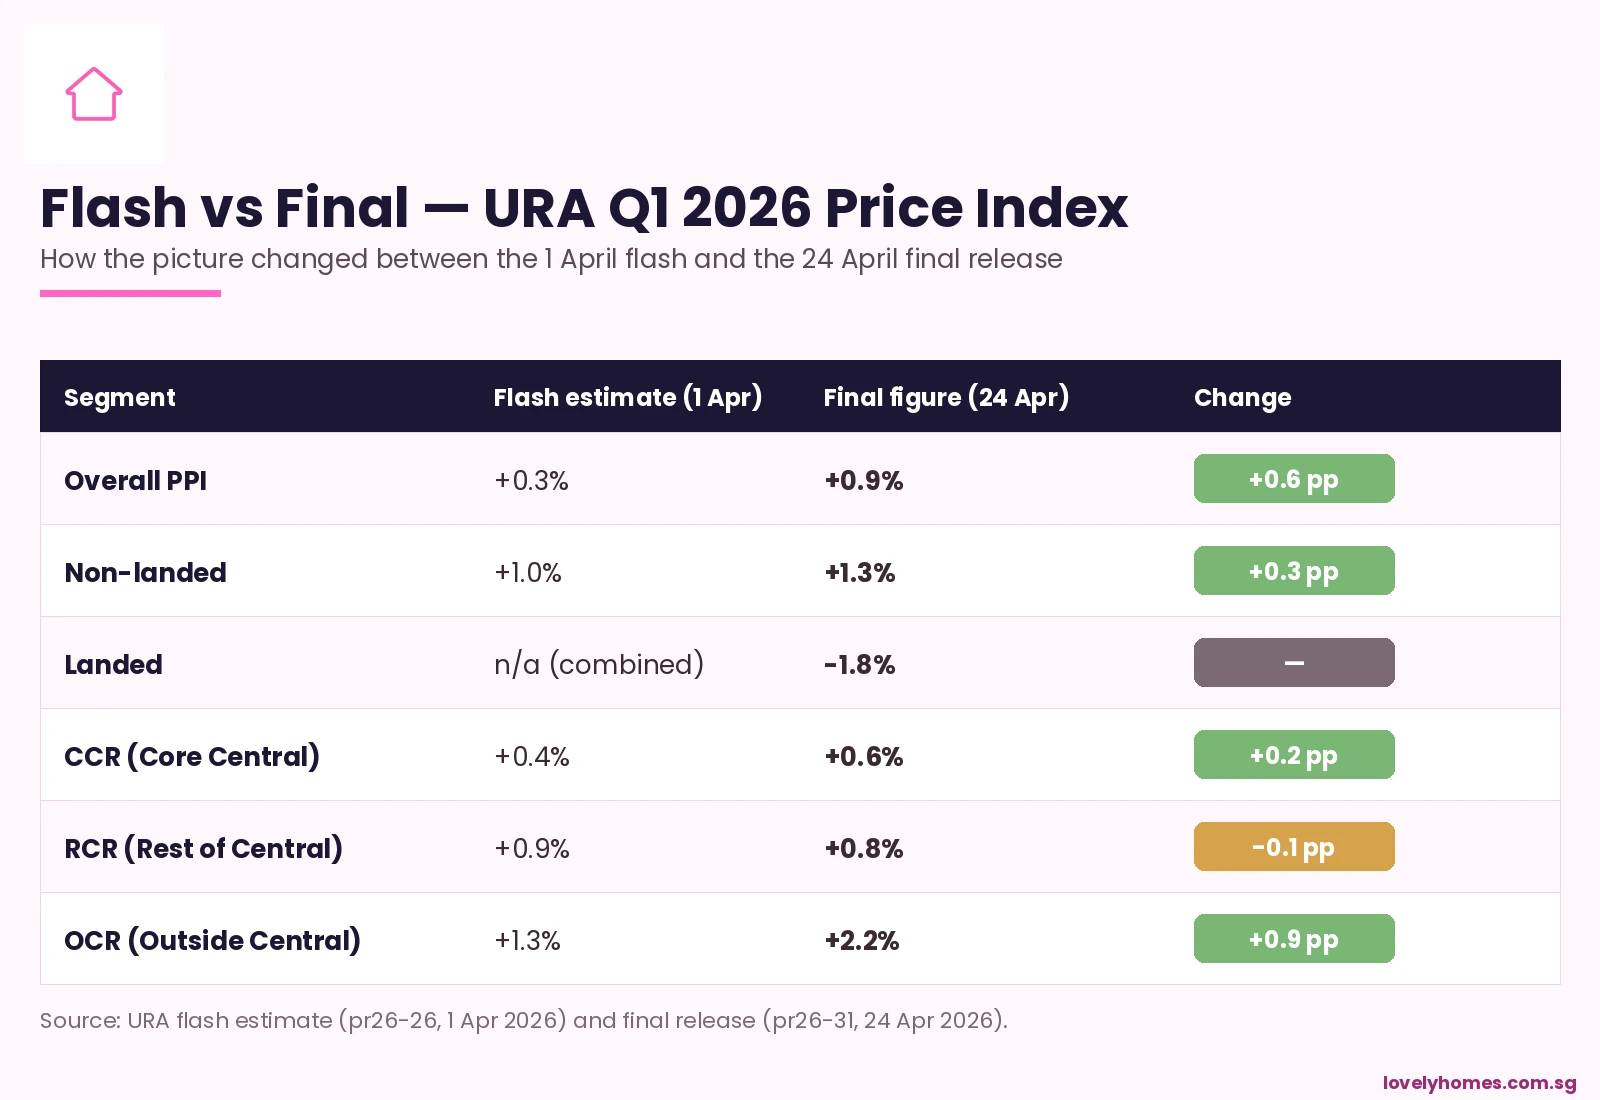
The largest upward revision was in the Outside Central Region (OCR), from a flash reading of +1.3% to a final +2.2%. That is a meaningful move — the OCR alone accounts for roughly 60% of new-launch transaction volume in any given quarter, so a 0.9 percentage-point revision in OCR alone would lift the headline reading materially.
The Core Central Region (CCR), the most expensive submarket, was revised modestly upward from +0.4% to +0.6%, after a punishing -3.5% in 4Q 2025. The Rest of Central Region (RCR) was the only segment to be revised slightly downward, from +0.9% to +0.8%.
Why Were OCR Numbers Revised So Sharply?
Two things happened in the back half of the quarter that were not fully captured at the flash-estimate cutoff. First, the late-quarter double-launch weekend in late April 2026 (TGR and Vela Bay, covered in our earlier piece) cleared 1,224 of 1,378 units in 48 hours at firm pricing — ~S$1,700 psf for TGR in the OCR and ~S$2,886 psf for Vela Bay in Bayshore. Both sets of transactions dragged up the OCR PPI when finally captured.
Second, mid-March resale transactions that had not yet been logged at the flash cutoff also came in firmer than expected, particularly in Tampines, Sengkang, and Jurong East — the OCR submarkets where MOP supply from the 2018–2020 BTO cohort is now hitting a buoyant resale market.
The Volume Story — A 39.7% Crash
The price firming has to be read against a steep drop in activity. Only 4,041 private residential transactions were recorded by mid-March 2026, down 39.7% versus the 6,699 transactions in 4Q 2025. That is the lowest quarterly transaction count in nearly two years.
The volume drop has two readable causes. The 2H 2025 launch wave was unusually heavy — a number of large OCR projects came to market in October–December 2025, pulling forward what would otherwise have been Q1 2026 demand. Q1 2026 was always going to look soft on volume by comparison.
The second cause is sentiment. Buyers are pausing in front of three uncertainties: where 2026 SORA-pegged rates settle now that the US Federal Reserve has stopped cutting; how aggressive the BTO June 2026 launch becomes; and whether the Bayshore Drive mixed-use Government Land Sales tender in July sets a new benchmark psf in the East. Volume usually returns once these three questions get answered.
Landed -1.8% — Mean-Reverting After a Hot 4Q
The landed segment swung from +3.4% in 4Q 2025 to -1.8% in Q1 2026, a 5.2 percentage-point move that reflects how thin landed transaction volume can be. Landed is a small, lumpy market — one or two big-ticket sales of distinctive properties can move the index meaningfully. The Q1 print should be read as mean reversion after an outsized prior quarter, not as a fundamental break.
Rental Index +0.3% — Stabilising After 2024 Cool-Off
The private residential rental index ticked up 0.3% in Q1 2026 after the multi-quarter cool-off through 2024 and early 2025. Yields on private condos remain in the 3.0–3.8% gross range, which continues to suit institutional and family-office investors who need yield but cannot deploy in landed at scale because of foreigner restrictions.
What Comes Next — The Q2 to Q4 Pipeline
| Indicator | Q1 2026 reading | What it implies for the rest of 2026 |
|---|---|---|
| Overall PPI | +0.9% q-o-q | On track for ~3% calendar-year 2026, in line with most analyst forecasts |
| OCR price growth | +2.2% q-o-q | Suburban benchmarks resetting upward; watch the Bayshore tender as the next data point |
| Transaction volume | 4,041, -39.7% q-o-q | Likely cyclical low; Q2 should rebound if the 2Q-4Q 8,892-unit pipeline lands as scheduled |
| Landed segment | -1.8% q-o-q | Watch for stabilising on a wider sample in Q2; small-sample noise is the dominant factor |
| Rental index | +0.3% q-o-q | Yields steady; institutional appetite for buy-to-let condos persists |
What This Means for Buyers — The Counter-Cyclical Window
For end-user buyers who have been waiting on the sidelines, Q1 2026 is the kind of moment that historically gets revisited as a buying window. Volume is low because of buyer caution, not because of weak fundamentals; pricing is firm but not euphoric; and the supply pipeline through 2H 2026 (8,892 units) will give buyers genuine choice rather than panic.
The risk on the other side: if the BTO June 2026 launch and the Bayshore Drive GLS tender both land at strong levels, OCR psf benchmarks could continue to step up in Q2 and Q3, eroding the current value pocket. Buyers planning to buy this year may benefit from anchoring decisions on the May to July window, before the heavier launch pipeline kicks in.
Frequently Asked Questions
Why was the upward revision from flash to final so large this quarter?
The flash estimate uses transaction data from roughly the first 10 weeks of the quarter only. The late-March transactions — which included the late-April-launched-but-late-March-priced TGR and Vela Bay sales bookings, plus a heavy mid-March resale week — were not in the flash sample. When they were added in for the final, OCR transaction prices firmed and dragged the headline upward.
Does this change the 2026 full-year forecast?
Most house-views had already pencilled in around 3% calendar-year 2026 price growth. Q1 at +0.9% is broadly consistent with that pace — not a beat, not a miss. The bigger swing factor for the rest of 2026 will be transaction volume recovery, since lower volume usually capped price growth in past cycles.
If volume is so weak, why are prices going up at all?
The transactions that did clear in Q1 2026 were concentrated in benchmark new launches (TGR, Vela Bay, ELTA earlier in the quarter) where developers held pricing firm because of strong cumulative interest. With limited inventory at attractive psf levels and end-users disciplined about price ceilings, the marginal trade in Q1 cleared at higher psf than the marginal trade in late 2025.
What does this mean for HDB upgraders?
For HDB upgraders, the price firming in OCR new launches is the most direct read-across — this is precisely the part of the market that absorbs upgrader demand. The flip side, however, is that HDB resale prices dipped 0.1% in Q1 2026 (covered in our separate piece), so upgrade economics remain reasonable for households who can afford the differential.
Does the URA Q1 2026 release affect cooling-measure expectations?
Almost certainly not. +0.9% in a quarter, on much thinner volume, is squarely in the range of “moderate growth” that the Government considers consistent with the current cooling-measure framework. Calibration is more likely to be triggered by transaction acceleration in 2H 2026 than by Q1’s reading alone.
How much new supply is coming?
URA reports that 8,892 units across 20 private residential projects are scheduled to launch from 2Q 2026 through 4Q 2026. That is a substantial pipeline, weighted to the OCR. Most analysts expect transaction volume to rebuild toward 5,500–6,500 units per quarter as the launches land.
Related Articles
- HDB Resale Prices Q1 2026 — First Decline Since 2019
- Singapore Luxury Home Sales Q1 2026 Hit Two-Year High
- Singapore EC Sales Top 1,000 Units in Q1 2026
- Singapore Double-Launch Weekend April 2026 — TGR + Vela Bay
- LTV Limits Singapore 2026
- Seller’s Stamp Duty (SSD) Singapore 2026
Disclaimer
This analysis summarises Q1 2026 statistics published by the Urban Redevelopment Authority on 24 April 2026 and contextualises them against earlier flash estimates and prior-quarter releases. Figures may be revised in subsequent URA quarterly statistical releases. The piece does not constitute investment, tax, or legal advice. For authoritative figures consult URA, HDB, the Monetary Authority of Singapore, the Inland Revenue Authority of Singapore, CPF Board, and SingStat. Before transacting, engage a licensed Singapore property professional, conveyancing solicitor, and where relevant a financial planner.