Singapore Property Market Forecast 2H 2026: Price Outlook, Key Risks and What Buyers Should Know

Singapore Property Market Forecast 2H 2026: Price Outlook, Key Risks and What Buyers Should Know

Quick Answer: Singapore Property Market Forecast 2H 2026

  • Private residential prices rose 0.9% QoQ and 2.63% YoY in Q1 2026, with the Outside Central Region (OCR) leading at +2.2% QoQ — price growth is positive but moderating.
  • HDB resale recorded its first quarterly dip (-0.1% QoQ) since Q2 2019; index sits at 203.4. Not a crash — more of a pause after a five-year run.
  • 2H 2026 GLS launches 9 confirmed-list sites (4,745 units), adding meaningful supply to OCR and RCR. Pricing discipline from developers is expected.
  • Key risk: interest rates remain elevated at 3.0–3.5% for bank mortgages; affordability is stretched for many first-time buyers.
  • Key catalyst: any US Federal Reserve rate cut signals would unlock significant pent-up demand — watch the September and December 2026 Fed meetings.
  • For buyers: fundamentals remain sound — Singapore’s employment is near-full, rental demand supports investment yield, and supply is finite. Timing the market is less reliable than time in the market.
  • URA Q2 2026 Flash Estimates are expected in early July 2026 and will be the next major data point.

H1 2026 in Review: Where the Singapore Property Market Stands

As the calendar turns to the second half of 2026, Singapore’s property market presents a nuanced picture. Private residential prices continued their gradual upward trajectory in Q1 2026, with the Urban Redevelopment Authority (URA) reporting a Property Price Index (PPI) increase of 0.9% quarter-on-quarter — a modest but consistent gain that extends a trend stretching back to the post-pandemic recovery that began in mid-2020. On a year-on-year basis, the private residential index is up 2.63%, a pace that is firm but well below the double-digit growth seen during the post-pandemic surge of 2021 to 2023.

The Housing Development Board’s Resale Price Index (RPI), however, told a slightly different story. At 203.4 in Q1 2026, the HDB resale market recorded a 0.1% quarterly decline — the first such dip since Q2 2019. This is not alarming in isolation: the index had surged more than 54% since its 2019 trough, and a modest pause is consistent with natural market digestion. What it does signal is that the exceptional run of HDB resale price appreciation is transitioning into a more measured phase.
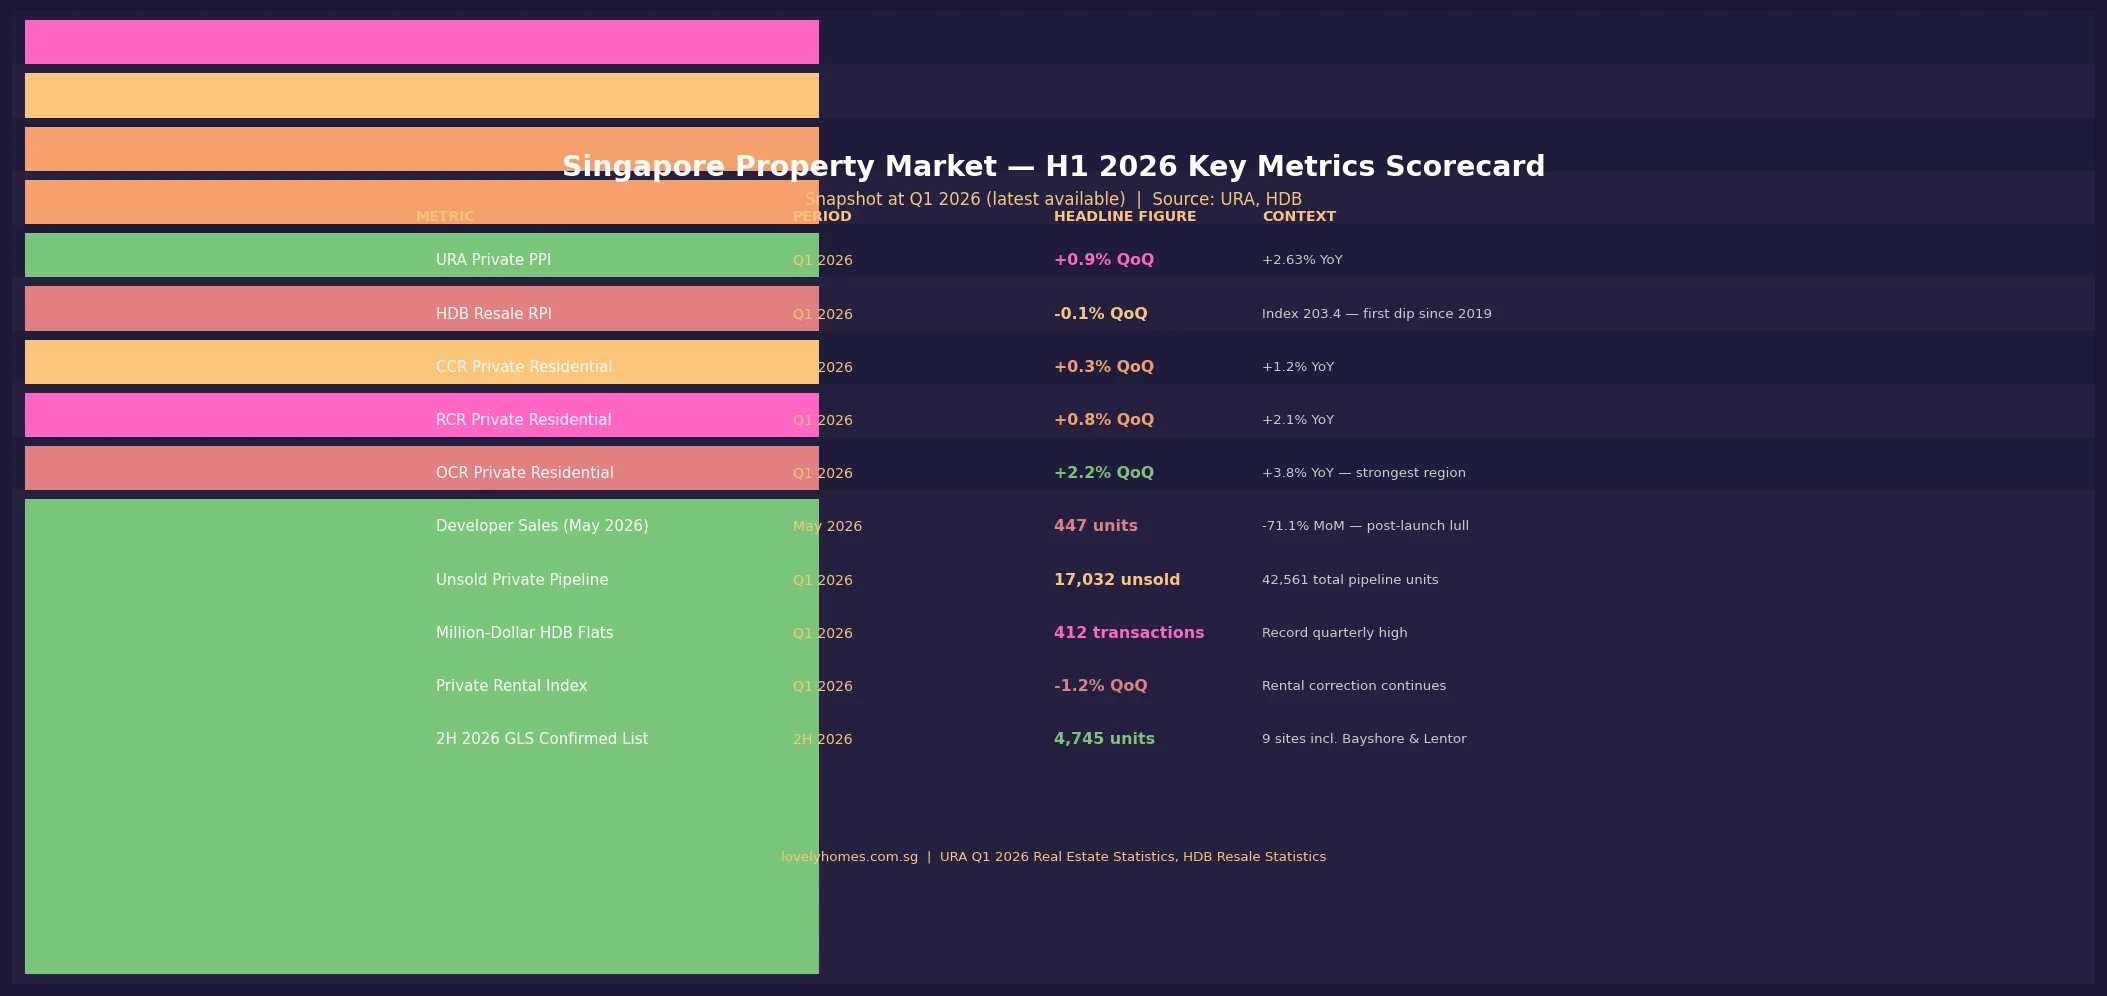
Singapore property market H1 2026 key metrics scorecard URA HDB data
Figure 1: Singapore Property Market H1 2026 Key Metrics Scorecard — URA Q1 2026 Real Estate Statistics and HDB Resale Statistics.

Private Residential Market: A Three-Speed Story

The defining characteristic of Singapore’s private residential market in 2026 is regional divergence. The three planning zones administered by URA — the Core Central Region (CCR), Rest of Central Region (RCR), and Outside Central Region (OCR) — have performed at markedly different speeds in 2026.

The OCR is the undisputed pace-setter. A 2.2% quarterly gain in Q1 2026, following similar momentum in late 2025, reflects genuine demand from HDB upgraders — a cohort whose Minimum Occupation Period (MOP) clears in waves and who target mass-market new launches in the S$1.3M–S$1.8M range. The 2H 2026 GLS programme deliberately concentrates supply here (Tampines Street 94, Bayshore Road), which should moderate any further sharp price acceleration without causing a price correction.

The RCR recorded 0.8% QoQ growth — solid mid-field performance driven by a mix of first-time private buyers, professionals, and some foreign-related buying in the city-fringe. River Valley Green Parcel C (awarded June 2026 at a top bid of approximately S$1,730 psf ppr) is the headline indicator of developer confidence in this zone.

The CCR grew just 0.3% QoQ, a subdued reading that reflects several headwinds: the 60% Additional Buyer’s Stamp Duty (ABSD) on foreigners that has been in place since April 2023 continues to suppress international transaction volumes; and the global macro uncertainty discussed in the risk section below has weighed on ultra-high-net-worth discretionary buying. That said, CCR is not in distress — it remains a long-term beneficiary of Singapore’s family office growth and wealth inflows.
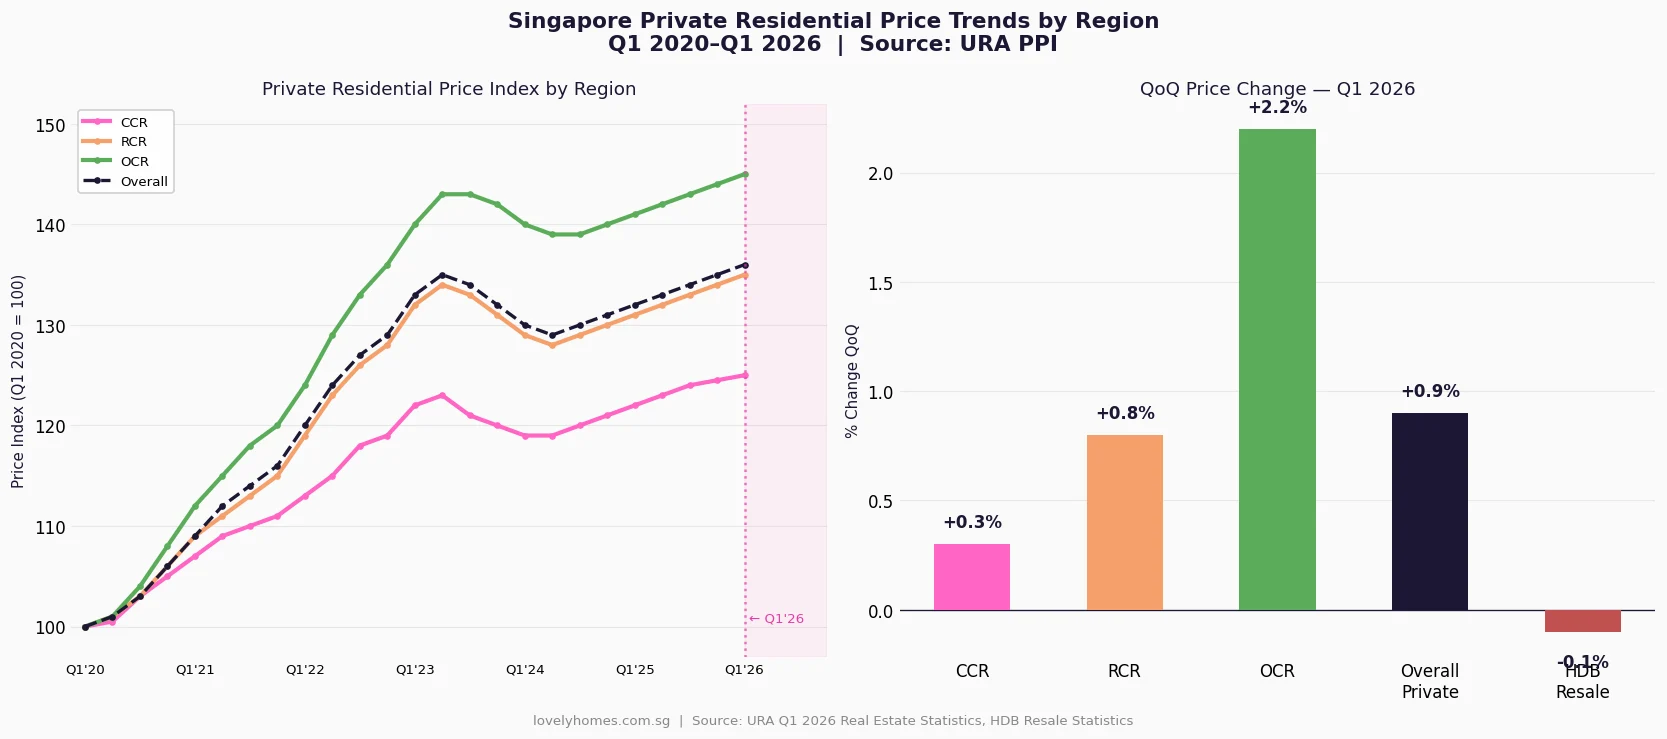
Singapore private residential price index CCR RCR OCR Q1 2026 regional trends
Figure 2: Singapore Private Residential Price Index by Region (Q1 2020–Q1 2026) and QoQ Change for Q1 2026. Source: URA Q1 2026 Real Estate Statistics.

HDB Resale Market: A Healthy Pause, Not a Reversal

Singapore’s HDB resale market has been one of the defining investment stories of the 2020s. From a low point in 2019 (RPI ≈ 132), prices surged to an index of 203.4 by Q1 2026 — a 54% cumulative increase. The Q1 2026 dip of 0.1% QoQ is, in that context, the market catching its breath after an exceptional run rather than a structural reversal.

Two counterintuitive data points reinforce this view. First, million-dollar HDB transactions reached a record quarterly high of 412 in Q1 2026 — indicating that at the premium end of the resale market (large mature-estate flats, high-floor units in sought-after towns), demand remains fierce. Second, overall HDB resale transaction volumes for Q1 2026 remained healthy, with four-room flats accounting for the largest share (approximately 2,690 transactions in Q1 2026 alone) at a median price of around S$575,000.

For 2H 2026, the HDB resale market is likely to remain range-bound rather than sharply appreciating or correcting. MOP cohorts from the 2016–2019 BTO launches are gradually clearing, releasing units back to the resale market — but supply from this channel is relatively thin compared to the 2013–2016 peak cycle. Demand remains supported by couples who cannot access BTO (due to income ceiling, citizenship mix, or urgency) and Permanent Residents who remain ineligible to buy BTO directly.

Developer Sales and the New Launch Pipeline

Developer sales activity is the indicator most directly shaped by new launch timing. The monthly data tells a story of feast and famine: January to April 2026 saw 1,120, 895, 1,348 and 1,548 units sold respectively — solid months driven by a cluster of project launches. May 2026 crashed to 447 units (-71.1% month-on-month), not because demand evaporated, but because there were few projects launching that month.

The pipeline going into 2H 2026 remains substantial. URA data shows 17,032 unsold units in the private pipeline as of Q1 2026 (total pipeline including units not yet launched: 42,561). The 2H 2026 GLS Confirmed List adds nine further sites including Lentor Gardens Parcel A and B, Bayshore Road, Tampines Street 94, and an EC site at Jurong East. These launches are phased across 2H 2026 into 2027, so the impact on completed supply will be felt primarily in 2028–2030.

Rental Market: Correction Underway, Yields Compressing

Singapore’s private residential rental market began correcting in 2024 after a record two-year surge and that correction extended into 2026. The URA rental index fell 1.2% QoQ in Q1 2026, following declines across 2024 and 2025. In absolute terms, rents remain significantly above their pre-pandemic levels — a 2BR in D15 that rented for S$2,800/month in 2019 may still command S$4,200–S$4,800/month in 2026 depending on specification — but the exceptional post-pandemic pricing has normalised.

For investors, this rental correction compresses gross yields. A S$1.5M 2BR in the RCR yielding S$4,500/month gross generates a gross yield of approximately 3.6%, which is broadly comparable to bank deposit rates in 2026. Net yield after management fees, property tax, and maintenance is lower — making the case for property investment in 2026 primarily a capital appreciation thesis rather than a pure income play.

2H 2026 Market Outlook Summary

Segment Base Case Bull Case Bear Case
Private Residential (Overall) +1%–2% for full year 2026 +3%–4% if rates ease and demand recovers Flat to -1% if global recession deepens
OCR (Mass Market) Continues outperforming; +2%–3% YoY +4%–5% with strong HDB upgrader demand Supply pressure from GLS launches moderates gains
RCR (City Fringe) Steady +1%–2% YoY +3% with new launch interest Flat if affordability ceiling is hit
CCR (Core Central) Sideways to +1%; foreign buyer ABSD drag +2%–3% if ABSD reviewed or wealth inflows surge -1%–2% if global HNW sentiment deteriorates
HDB Resale ±0.5% QoQ; range-bound in H2 +1%–2% if upgrader demand stays robust -1% if affordability stress bites flat demand
Private Rental Further -2%–4% as supply catches up Stabilises if employment influx resumes Deeper correction if expat headcount falls

Worked Example: The Chen Family — Buy in 2H 2026 or Wait?

Mr and Mrs Chen are Singapore Citizens in their early 30s. They have cleared their HDB MOP on their Bishan 4-room flat and are looking to upgrade to a 3-bedroom OCR condo. They have combined income of S$13,500 per month, CPF OA savings of S$180,000, and cash of S$120,000.

They are eyeing a 3BR at an upcoming OCR launch in Q3 2026 priced at S$1.65M. Under the ABSD SC couple remission scheme, they can purchase the new condo and claim a full refund of the 20% ABSD (S$330,000) provided they sell their HDB flat within six months of the condo purchase date.

Key numbers: BSD S$47,600 (payable from CPF); ABSD S$330,000 (cash, but refundable within six months of HDB sale); 5% cash S$82,500; legal fees ~S$5,500. Bank loan: 75% LTV = S$1,237,500 at 3.2% over 30 years → monthly repayment approximately S$5,338. TDSR = S$5,338 ÷ S$13,500 = 39.5% (PASS, under 55%). Total cash needed upfront: ~S$208,000 (cash component + ABSD float pending HDB sale).

Should they wait? If OCR prices rise another 2% by Q1 2027, the same unit would cost S$1,683,000 — an additional S$33,000. If interest rates fall 50 bps by then, monthly repayments fall by ~S$300/month. The calculus slightly favours acting when they are ready rather than trying to time the market precisely, provided the ABSD remission window can be managed. See our guide on ABSD remission for SC couples for the full rules.

What Might Come Next: Risks and Catalysts for 2H 2026

The Singapore property market operates at the intersection of domestic fundamentals (employment, wage growth, HDB upgrader cohorts) and global macro forces (US interest rates, geopolitical risk, capital flows). For the second half of 2026, both sides of that equation are in play.

Key downside risks include the persistence of elevated interest rates — if the US Federal Reserve holds rates through 2026 without cutting, Singapore bank mortgage rates (which track SORA and swap rates) will remain in the 3.0–3.5% range, keeping affordability stretched. Continued global trade disruptions from US tariff policy create a dampening effect on business investment sentiment and, indirectly, on expatriate headcounts and rental demand. China’s economic slowdown reduces the pool of Chinese-origin buyers who were historically active in the CCR.

Key upside catalysts include the prospect of Fed rate cuts in September or December 2026 — even one 25-basis-point cut would move Singapore’s forward rates and boost buyer confidence. Singapore’s own fundamentals remain strong: the unemployment rate is approximately 2.0%, wage growth is positive, and the Government’s managed-supply approach via the GLS programme means developers are not flooding the market with distressed inventory. Any relaxation of ABSD for permanent residents (which has been debated, though there is no official signal) would be an immediate CCR and RCR catalyst.
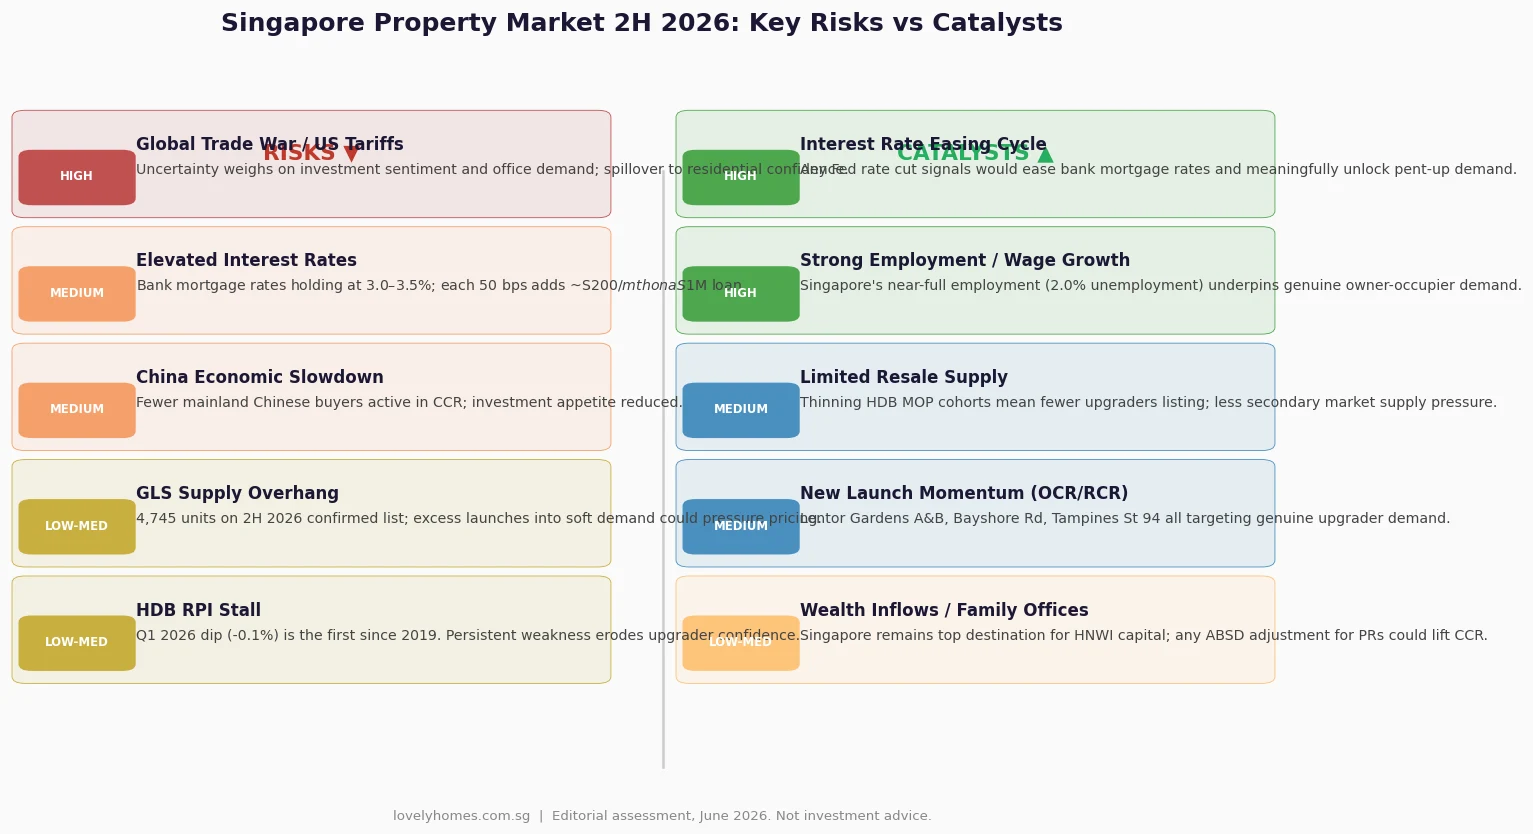
Singapore property market second half 2026 risks catalysts analysis
Figure 3: Singapore Property Market 2H 2026 — Key Risks vs Catalysts. Editorial assessment as at June 2026. Not investment advice.

Frequently Asked Questions

Will Singapore property prices drop in 2H 2026?

A broad price correction in 2H 2026 is not the base-case scenario for most analysts. Singapore’s property market is underpinned by limited land supply, robust employment, and the Government’s disciplined GLS programme which calibrates supply to demand. The most likely outcome for 2H 2026 is modest positive growth in the private residential segment (0%–2% for the full year in a base case) and range-bound movement in HDB resale. A sharp correction would require a confluence of events unlikely to materialise simultaneously: a major spike in unemployment, a severe global financial shock, and a government decision to release large additional land supply. None of these is the current outlook.

When will the URA Q2 2026 Flash Estimates be released?

Based on URA’s established release pattern, the Q2 2026 Flash Estimates for the private residential property price index are expected in the first week of July 2026 — likely 1 or 2 July. The full Q2 2026 real estate statistics (including detailed regional breakdowns, rental index, and developer sales data) typically follow approximately three to four weeks later. The flash estimate gives a preliminary QoQ price change figure; the full release provides granular transaction and rental data. LovelyHomes will publish a dedicated analysis article as soon as the data is available.

What does the HDB resale -0.1% dip in Q1 2026 actually mean for sellers?

A -0.1% quarterly change in the HDB Resale Price Index is, in practical terms, negligible. On a S$600,000 flat, it represents a S$600 notional price movement — far smaller than the typical negotiation buffer in any individual transaction. What it signals is a shift in market psychology: buyers are less willing to pay premiums above valuation (Cash-Over-Valuation, or COV), and the exceptional seller’s market conditions of 2021–2024 have normalised. Sellers should still expect good prices — the index is 54% above its 2019 trough — but they should set realistic expectations and price to comparable transactions rather than aspirationally. For guidance on reading HDB data, see our HDB Resale Price Index Guide.

Is this a good time to buy a private property in Singapore?

This depends entirely on your personal financial circumstances, intended holding period, and purpose. If you are buying for genuine owner-occupation (primary home or long-term family residence), timing the market precisely is less important than buying within your means — ensuring your TDSR is comfortable, that you have adequate cash reserves, and that your loan tenor is appropriate. If you are buying as an investment (rental yield or capital appreciation), you need to stress-test the numbers at current mortgage rates (3.0–3.5%) and assess whether the rental yield justifies the carrying cost. For a personalised assessment, consult a licensed financial adviser and a property professional. See also our Singapore Property Financing Guide for a full breakdown of LTV, TDSR, and MSR rules.

How does the 2H 2026 GLS supply affect new launch prices?

The 2H 2026 Government Land Sales Confirmed List adds nine sites capable of yielding approximately 4,745 private and EC units. This is a substantial supply injection, particularly into the OCR and RCR. In theory, more supply means developers compete harder for buyers, which moderates launch prices. In practice, Singapore developers rarely slash prices — they tend to phase launches to match demand and hold firm on pricing. The more likely outcome is that new launches in 2H 2026 are priced at modest premiums (5%–8%) to recent comparables rather than at exceptional premiums. Buyers interested in specific sites such as Lentor Gardens Parcels A and B, Bayshore Road, or Tampines Street 94 should monitor the URA tender awards and developer launch announcements as they are made throughout 2H 2026. Full details of all 2H GLS sites are in our 2H 2026 GLS Programme Guide.

What is the ABSD rate for Singapore Citizens buying a second property in 2026?

A Singapore Citizen purchasing a second residential property pays 20% ABSD on the purchase price or market value, whichever is higher. This is paid in cash (CPF cannot be used for ABSD). For SC couples who own an HDB flat, the 20% ABSD on their second private property can be refunded under the SC Couple ABSD Remission Scheme, provided the HDB flat is sold within six months of the completion of the private property purchase. The full rules are detailed in our ABSD Remission Guide and Complete ABSD Singapore 2026 Guide.

How do I track the Singapore property market between official URA releases?

Between URA quarterly releases, you can monitor real-time trends through several free sources. The URA REALIS portal (accessible via My SingPass) provides transaction-level data for private residential properties. The HDB Resale Flat Prices portal shows individual HDB transactions. SRX Property and EdgeProp Singapore publish weekly market commentaries based on caveats lodged. The Business Times Real Estate section and Channel NewsAsia Property cover major announcements and tender results. For a guide on how to interpret the data you find, see our HDB Resale Price Index Guide and CCR RCR OCR Property Guide.

Related Articles

Disclaimer: This article is for general informational purposes only and does not constitute financial, investment, or property advice. All property market data is sourced from the Urban Redevelopment Authority (URA) and Housing Development Board (HDB) official releases as at Q1 2026. Property prices, interest rates, and government policies can change — readers should refer to the latest official URA (ura.gov.sg), HDB (hdb.gov.sg), MAS (mas.gov.sg), and IRAS (iras.gov.sg) publications and consult a licensed financial adviser or property professional before making any property-related decision. Past price performance is not indicative of future results.

Singapore Property Market Mid-Year Outlook 2026: Prices, Trends and What the Second Half Holds

Singapore Property Market Mid-Year Outlook 2026: Prices, Trends and What the Second Half Holds

Quick Answer: Singapore Property Market Mid-Year 2026

  • Private residential prices rose 0.9% in Q1 2026 — the sixth consecutive quarter of increase, with the price index reaching 208.8 (2009 Q1 = 100).
  • HDB resale prices edged down 0.1% in Q1 2026 — the first quarterly decline since Q1 2023, though the Resale Price Index remains at a historically elevated 183.1.
  • Suburbs (OCR) led price gains at 2.2% QoQ, outpacing the city fringe (RCR) at 0.8% and prime districts (CCR) at 0.3%.
  • 42,561 private units in the pipeline as at Q1 2026, with 17,032 remaining unsold — adequate supply is expected to keep price growth measured in 2H 2026.
  • Full-year 2026 forecast: industry research desks project approximately 3% private residential price growth, with suburban condominiums and mid-market segments continuing to outperform.
  • River Valley Green (Parcel C) tender closed today (18 June 2026) — award expected in approximately four weeks; signals continued institutional appetite for prime residential land.

Singapore’s property market enters the second half of 2026 in a state of cautious optimism. Prices are rising, but at a measured pace that reflects both MAS cooling measures and tighter buyer affordability. Transaction volumes have moderated, yet well-located new launches continue to see strong take-up at launch weekends. This mid-year analysis draws on URA and HDB Q1 2026 data — the most current available — to assess where the market stands and what the second half may hold.

Private Residential Market: Six Quarters of Unbroken Growth

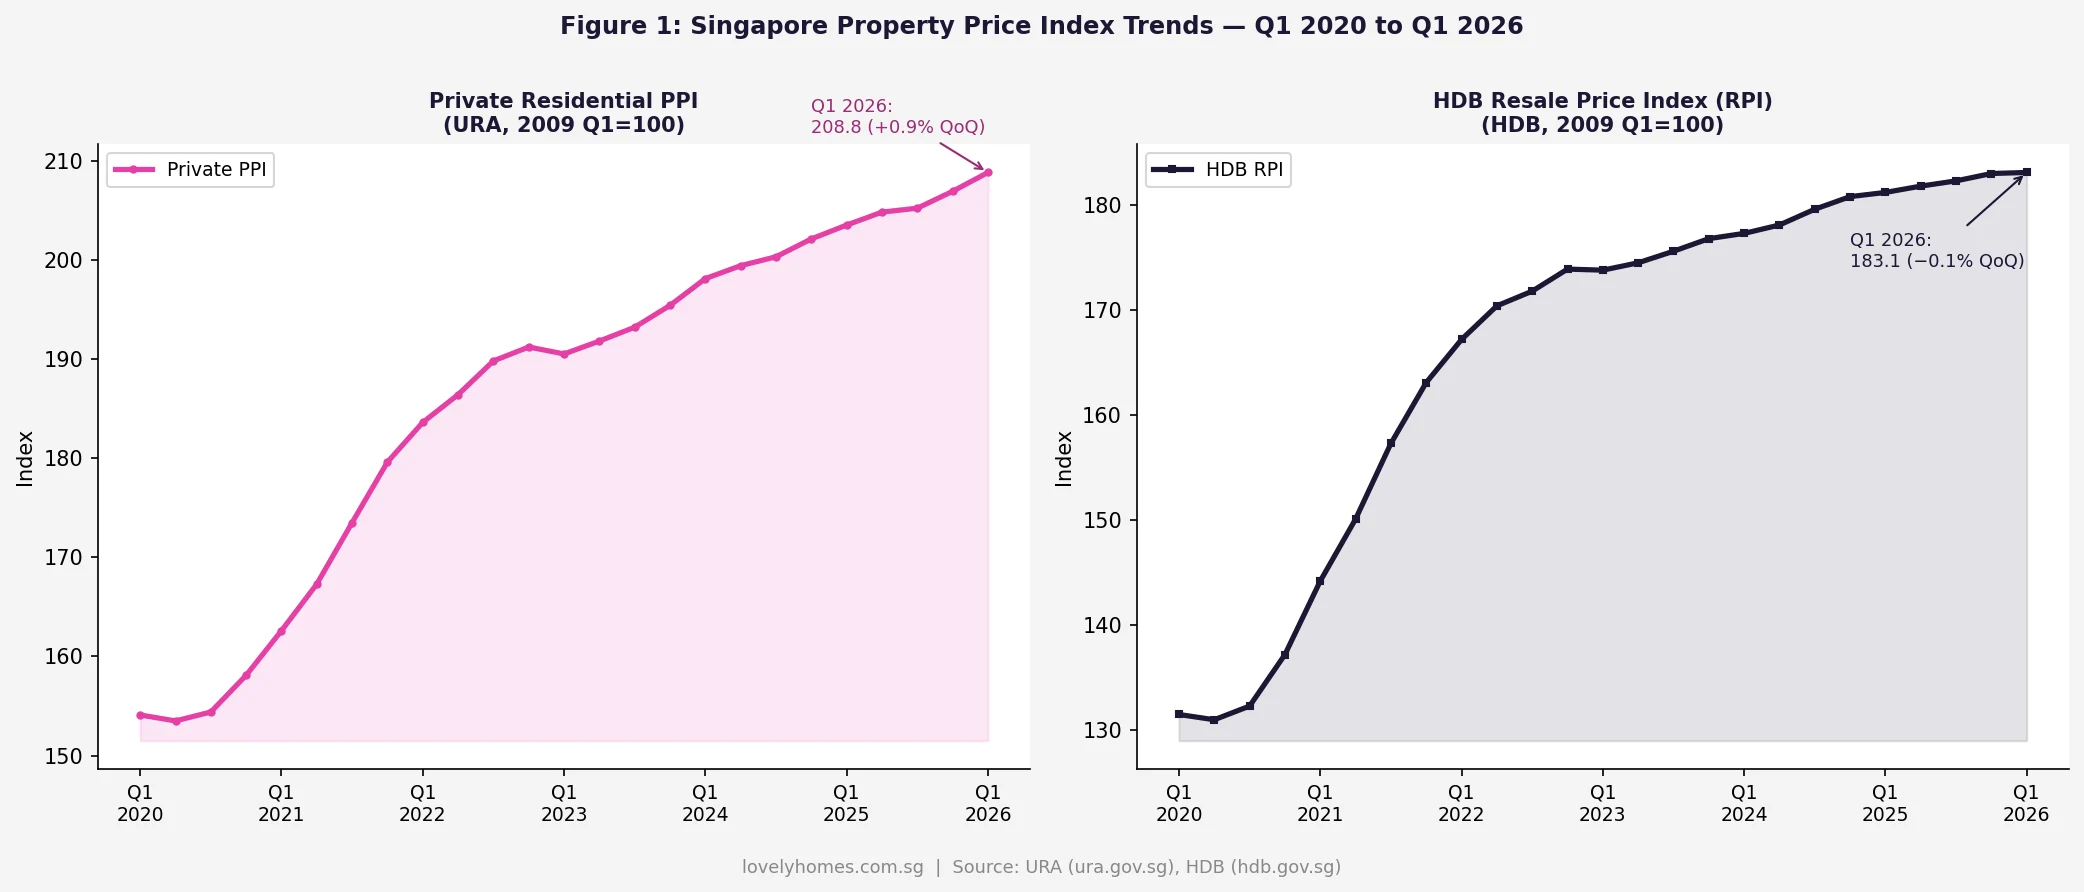
The URA Private Residential Property Price Index reached 208.8 in Q1 2026, up 0.9% from Q4 2025’s 206.9. This marks six consecutive quarters of positive growth — a run that began after the brief pause in Q1 2023 following the April 2023 cooling measure increase. The cumulative gain since Q1 2023 (190.5) stands at 9.6%, equivalent to a modest but consistent appreciation trajectory.

Singapore private residential price index PPI and HDB resale price index RPI trend Q1 2020 to Q1 2026
Figure 1: Singapore Private Residential Price Index (PPI) vs HDB Resale Price Index (RPI) — Q1 2020 to Q1 2026. Source: URA, HDB

The trajectory in Figure 1 reveals a key structural shift: the steep post-2021 rise has moderated into a gentle upward slope, suggesting that the market has absorbed the 2023 cooling measures and found a new equilibrium. Critically, prices have not corrected significantly — the cooling measures slowed momentum rather than reversed it.

OCR Leads: Suburban Condominiums Driving Growth

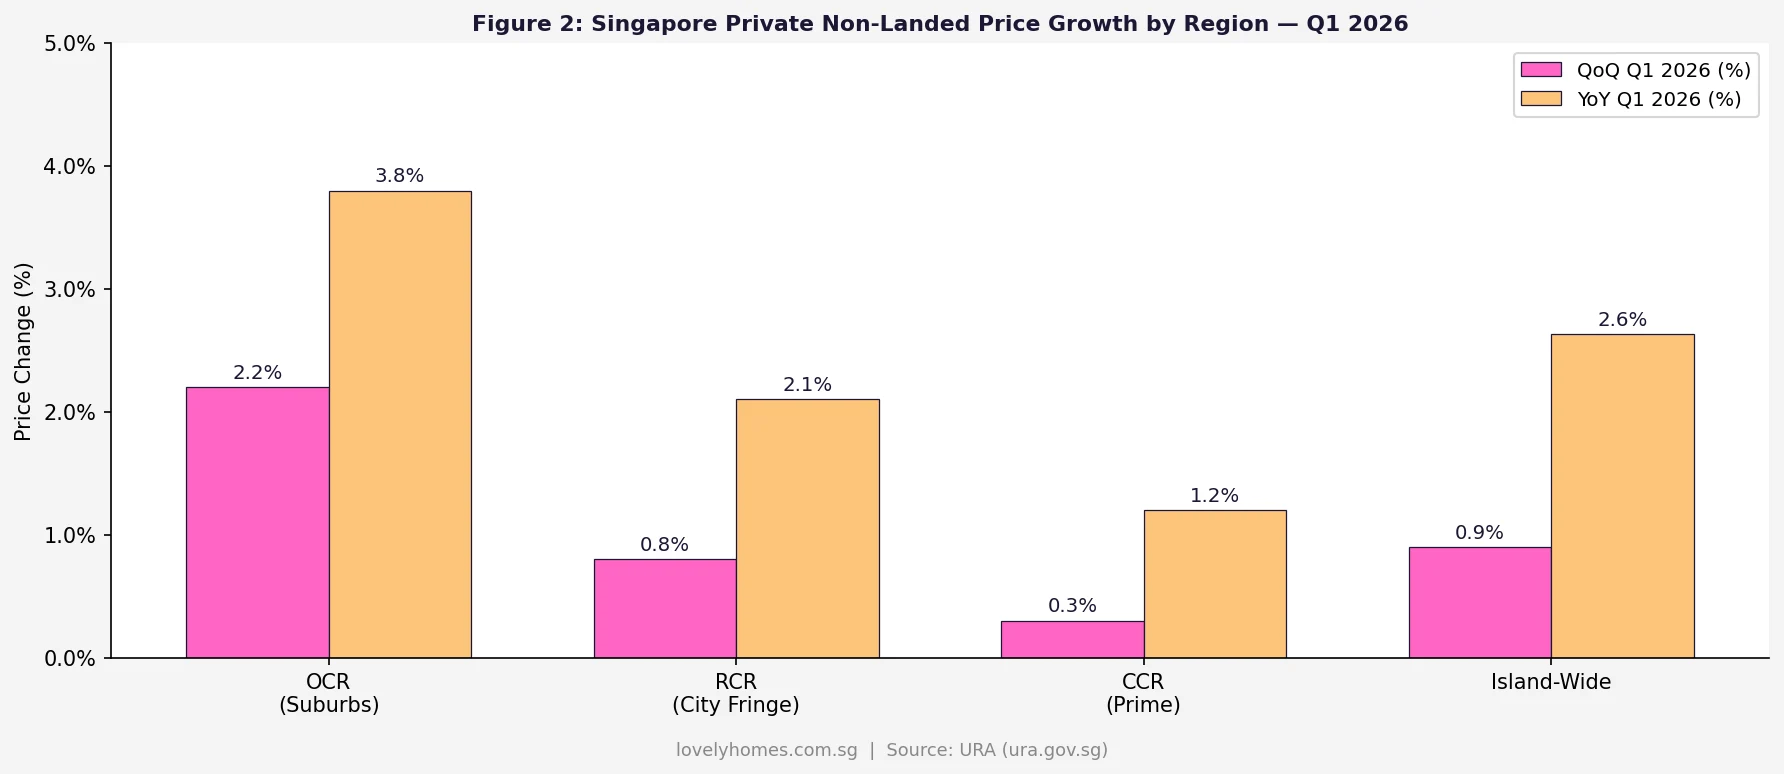
Not all segments of the private market moved equally in Q1 2026. The Outside Central Region (OCR) — encompassing HDB upgrader demand in the suburbs — recorded the strongest growth at 2.2% QoQ, against the Rest of Central Region (RCR) at 0.8% and the Core Central Region (CCR) at 0.3%. This pattern has been consistent since 2023 and reflects a structural demand driver: the large cohort of HDB flat owners whose Minimum Occupation Periods are maturing, giving them access to their CPF proceeds and equity to fund private property purchases.

Singapore private non-landed property price growth by region OCR RCR CCR Q1 2026
Figure 2: Singapore Private Non-Landed Price Growth by Region — Q1 2026 (QoQ and YoY). Source: URA

The year-on-year (YoY) figures reinforce the OCR leadership: at 3.8% YoY, suburban condominiums have outperformed the island-wide average of 2.63%. For buyers targeting long-term capital appreciation, the data continues to favour well-located OCR projects near MRT stations in growth corridors such as Punggol Digital District, Jurong Lake District, and Woodlands Regional Centre.

HDB Resale: The First Dip in Three Years

The HDB Resale Price Index registered a marginal -0.1% in Q1 2026 — the first quarterly decline since Q1 2023. This does not signal a market downturn; at 183.1, the RPI remains close to its all-time high (183.1 in Q4 2025) and the volume of million-dollar HDB transactions remained elevated in early 2026. Rather, the mild softening reflects a combination of factors: the additional 30-month wait for buyers with prior private property experience, the expanded HDB BTO supply pipeline, and general affordability pressure at the upper end of the HDB resale market.

For HDB upgraders, the moderation in resale prices may actually be beneficial — it reduces the risk of overpaying for an HDB flat just before a condo purchase, as the HDB asset they are selling remains close to peak value whilst the risk of further HDB price acceleration is tempered. Read our HDB Resale Flat Prices Guide 2026 for detailed data by flat type and town.

Supply: 42,561 Units in the Pipeline

As at Q1 2026, URA reports 42,561 private residential units (including Executive Condominiums) with planning approval, of which 17,032 remain unsold by developers. This inventory level is above the recent 5-year average of approximately 14,000 unsold units, providing a meaningful supply buffer against price spikes in 2H 2026 and into 2027.

Market Segment Q1 2026 Price Change (QoQ) YoY Change 2H 2026 View
Private Non-Landed (OCR) +2.2% +3.8% Continued support from HDB upgrader demand
Private Non-Landed (RCR) +0.8% +2.1% Selective strength; site-specific
Private Non-Landed (CCR) +0.3% +1.2% Muted; foreign buyer ABSD effect persists
Landed Residential +0.5% +1.8% Constrained supply; stable demand
HDB Resale (RPI) −0.1% +1.5% Mild moderation; supported by BTO delays

GLS Market: River Valley Green Parcel C Closes Today

The Government Land Sales (GLS) market provided a timely data point today (18 June 2026) as the tender for River Valley Green (Parcel C) closed at noon. This 11,516 sqm site next to Great World City MRT station — the last undeveloped plot in the River Valley Green enclave — is expected to yield approximately 470 residential units. The adjacent Parcel B attracted five bids when it closed in February 2025 at a land rate of $1,420 per square foot per plot ratio (psf ppr).

The tender award (expected in approximately 4 weeks) will be a closely watched indicator of developer confidence in the prime residential segment. A land rate above $1,500 psf ppr would signal continued appetite for CCR sites despite the 60% ABSD on foreign buyers. The 2H 2026 GLS programme, which HDB and URA released in June, continues to inject supply — particularly in the suburban corridors.

What Might Come Next: Second Half 2026 Outlook

The following is forward-looking analysis, not a price forecast or investment advice.

The consensus view from industry research desks points to full-year 2026 private residential price growth of approximately 3%, with OCR non-landed leading and CCR lagging. Three factors could alter this trajectory in either direction:

  • MAS interest rate environment: SORA-linked floating rates remain at approximately 3.0–3.4% as at June 2026. Any reduction in US Federal Reserve rates — expected by some analysts in late 2026 — would ease SORA and reduce effective mortgage costs for Singapore borrowers, potentially stimulating upgrader activity in Q4 2026 and Q1 2027.
  • ABSD policy review: The government has signalled no near-term review of ABSD rates. Any reduction of the SC second-property rate (currently 20%) would significantly unlock pent-up HDB upgrader demand. Conversely, any further increase would weigh on the OCR segment that has been the market’s growth engine.
  • New launch pipeline quality: Several large-scale OCR new launches are expected in 2H 2026 from GLS sites awarded in 2024–2025. Strong opening weekends at these launches would validate the upgrader demand thesis; weak take-up would signal affordability limits have been reached at current price points.

What This Means for Buyers in Mid-2026

For first-time buyers: the market is not cheap, but it is not in a speculative bubble either. Price growth is moderate, supply is adequate, and interest rates — whilst elevated versus 2021 — are stable. If your financial position qualifies you for a bank loan and your timeline is 5 years or longer, the current environment does not present an extraordinary risk of a sharp near-term correction.

For HDB upgraders: the HDB-to-private upgrade window remains open. HDB resale values are near peak, giving you maximum equity to deploy. The OCR condo segment continues to see the strongest demand from buyers in similar circumstances to yours — buy into quality, not just momentum. See our HDB Upgrader Condo Buying Guide 2026 for a full financial roadmap.

For investors: the rental market remained resilient through early 2026 despite earlier forecasts of rental corrections. Gross yields for well-located OCR condos are approximately 3.0–3.8%, providing a positive carry on leveraged purchases at current bank rates. Rental income is taxable — see our Singapore Property Rental Income Tax Guide 2026 for the full IRAS framework.

Frequently Asked Questions

Where can I find official Singapore property price data?

URA publishes quarterly private residential price statistics at ura.gov.sg. The Urban Redevelopment Authority releases flash estimates in the first week of each new quarter, followed by full statistics approximately 4–5 weeks later. HDB publishes its Resale Price Index and transaction data at hdb.gov.sg. Both datasets are freely available and updated quarterly.

What is the difference between the PPI and individual condo prices?

The URA Private Property Price Index (PPI) is a volume-weighted aggregate index of all private residential transactions island-wide. Individual condo prices can diverge significantly from the PPI — a new launch in a prime location may appreciate 10% in a year whilst the PPI rises 2%. Use the PPI as a broad directional indicator, but base purchase and sale decisions on comparable transaction (caveats) data for the specific development or district you are evaluating.

Will the River Valley Green Parcel C award affect condo prices in the area?

GLS land awards typically influence pricing in the surrounding micro-market. A high land rate at River Valley Green Parcel C would signal developer confidence in the Great World City / River Valley corridor and may support asking prices at nearby resale condos (including the completed Parcel A and Parcel B projects). However, new launch pricing from the awarded parcel is unlikely to enter the market for 3–4 years (construction to TOP), so the near-term impact on existing resale condos is mostly psychological.

Has the 30-month wait for private property sellers affected the resale market?

Yes. The 30-month wait — introduced in September 2022 — requires sellers of private residential properties to wait 30 months before they can purchase an HDB resale flat (if they intend to downgrade). This has reduced the supply of private resale properties from buyers who might otherwise have sold to downgrade into an HDB flat. The effect has been most visible in reducing transaction volume at the lower end of the condo market (1-bedroom to 2-bedroom units in the OCR priced below $1.5M), where owner-occupiers seeking to downgrade to HDB have been deterred from selling.

When will URA release Q2 2026 flash estimates?

URA typically releases quarterly flash estimates in the first week of the following quarter. Q2 2026 flash estimates are expected in the first week of July 2026, with full Q2 2026 statistics released approximately 4–5 weeks thereafter (likely early-to-mid August 2026). LovelyHomes will publish a full analysis immediately upon release — bookmark our Q2 2026 URA Flash Estimates page for that update.

Disclaimer: This analysis is based on publicly available data from URA and HDB as at Q1 2026 and does not constitute investment, financial, or property advice. Property prices can rise or fall; past performance is not indicative of future results. Consult a licensed financial adviser and accredited property agent before making any property investment decision. Official sources: ura.gov.sg, hdb.gov.sg, mas.gov.sg.
×

Click anywhere or press Esc to close

HDB Resale Market Q1 2026: First Price Decline in 7 Years — What It Means for Buyers and Sellers

HDB Resale Market Q1 2026: First Price Decline in 7 Years — What It Means for Buyers and Sellers

For the first time in nearly seven years, Singapore’s HDB resale prices fell — even if only fractionally. HDB’s Q1 2026 Public Housing Statistics, released in April 2026, showed the Resale Price Index (RPI) declining 0.1% quarter-on-quarter to 203.4, the first quarterly dip since Q2 2019. The data paints a nuanced picture: overall resale volumes are cooling, year-on-year price growth has slowed sharply to just 1.2%, and yet million-dollar transactions reached a record 412 in Q1 2026 — a paradox that reveals the two-speed market now operating in Singapore’s public housing segment.

Quick Answer — HDB Resale Q1 2026 at a Glance

  • HDB Resale Price Index (RPI): 203.4 — down 0.1% q-o-q (first quarterly decline since Q2 2019).
  • Year-on-year price growth: +1.2% — the slowest since Q3 2023.
  • Transaction volume: 6,179 resale transactions — down 4.5% year-on-year.
  • Million-dollar transactions: 412 in Q1 2026 — a record high.
  • MOP wave: approximately 13,480 HDB flats reached their 5-year MOP in 2026, nearly double the 2025 figure.
  • Private rental market linkage: rental softening is reducing the “upgrade and rent out HDB” incentive for some owners, contributing to reduced speculative resale demand.
  • Policy context: the Plus and Prime classification system (introduced in August 2023) is reshaping buyer segmentation as the first Plus/Prime resale eligibility windows approach.

The RPI Decline in Context: Seven Years of Unbroken Growth

From Q3 2019 onwards, the HDB Resale Price Index rose every single quarter — through the pandemic (with brief deceleration), through the post-COVID demand surge, through the April 2023 cooling measures, and through 2024 and 2025. The cumulative appreciation from Q2 2019 (RPI ~133) to Q4 2025 (RPI 203.6) was approximately 52.7% — an extraordinary run for a heavily regulated, subsidised housing segment. The Q1 2026 dip to 203.4 represents a moderation of 0.2 index points, or 0.1% — statistically a rounding event, but symbolically significant as the end of an uninterrupted run.

HDB resale price index RPI quarterly trend 2019 to 2026 first decline in 7 years Singapore
Figure 1: HDB Resale Price Index (RPI), Q2 2019 to Q1 2026. The Q1 2026 decline to 203.4 (highlighted in red) ends a 28-quarter run of uninterrupted quarterly growth. Source: HDB Public Housing Statistics Q1 2026.

HDB itself noted in its Q1 2026 release that the resale market had shown “a moderation in the rate of price increase over the past few quarters”, and that the supply of HDB flats reaching their Minimum Occupation Period (MOP) was rising sharply. The estimated 13,480 HDB flats reaching MOP in 2026 — nearly double the approximately 7,800 in 2025 — is the most consequential structural driver of the current cooling. As MOP-completed flat owners enter the market to sell and upgrade, both resale supply and demand are rising simultaneously, creating a more balanced trading environment.

The Million-Dollar Paradox: Record High Transactions, Cooling Overall

The headline number that appears contradictory is the record 412 million-dollar HDB transactions in Q1 2026. How can overall prices be falling while the number of million-dollar transactions is at an all-time high? The answer lies in market segmentation.

Million-dollar HDB transactions are concentrated in a narrow segment of premium units: large flats (5-room, maisonette, executive apartment) in high-value locations (Bukit Merah, Queenstown, Toa Payoh, Bishan, and the central belt broadly), often in high-floor, sought-after blocks with good views and remaining lease. In Q1 2026, the headline S$1.728M transaction for a Henderson Road flat set a new all-time record. These premium units are experiencing their own distinct supply constraint — there are simply very few of them coming onto the market in prime locations — and demand from upgraders and investors for these specific assets remains robust.

HDB million-dollar transactions count vs total resale volume quarterly Q1 2022 to Q1 2026 Singapore
Figure 2: Million-dollar HDB transactions (bars) vs total resale volume (line), Q1 2022 to Q1 2026. Record million-dollar count of 412 in Q1 2026 contrasts with falling total volume (6,179, down 4.5% year-on-year). Source: HDB, LovelyHomes research.

Meanwhile, in the broader resale market — the typical 4-room flat in a heartland town — the MOP wave is producing more supply than demand can fully absorb. Towns like Punggol, Sengkang, Tampines, and Woodlands are seeing increased listing volumes from the 2021 BTO cohort hitting their MOP, and buyers in these towns have more choices and more negotiating power than they did 12–18 months ago. The RPI dip is primarily a story of this broader heartland segment moderating, even as the premium central-belt segment continues to push records.

What This Means for HDB Resale Buyers and Sellers in 2026

Scenario Implication of Q1 2026 Data
Buyers — heartland towns (Punggol, Sengkang, Tampines, Woodlands) More favourable conditions: more listings, softer asking prices vs 2024–2025, more negotiating room on resale premium over valuation. This is the best entry environment in 2–3 years for buyers in these areas.
Buyers — prime belt (Bukit Merah, Queenstown, Toa Payoh, Bishan) Market still competitive for premium units. Sellers in these locations are holding firm given scarcity. Buyers should budget for cash-over-valuation (COV) at premium blocks. The RPI dip has not meaningfully softened these micro-markets.
Sellers — MOP-completing 2021 BTO cohort Act sooner rather than later: the 13,480 MOP-completions in 2026 will peak and then taper. By Q3–Q4 2026, listing competition from MOP-completers will be at its highest. Sellers who list in Q2 2026 face less competition than those who list later in the year.
Upgraders (HDB → private) The HDB-to-private upgrade path remains viable, but the ABSD 20% on a second property is unchanged. The cooling of HDB prices reduces the equity upgraders can extract from their resale. Careful timing of the sale-and-purchase sequence is critical — see our ABSD guide.
HDB landlords (subletting rooms) The private rental market softening (private rents +0.3% in Q1 2026, vs +4–6% in 2022) is reducing the “upgrade and rent out HDB” equation’s attractiveness. This has reduced one strand of speculative demand for large HDB flats.

Worked Example: Selling a Punggol 4-Room in the Current Market

The Lims purchased a BTO 4-room flat in Punggol in 2021 for S$380,000. Their MOP completes in mid-2026. They are considering selling to upgrade to a private condominium in Tampines. Based on current Q1 2026 market conditions in Punggol for a comparable unit, resale transacting prices are approximately S$550,000–S$580,000.

At a sale price of S$565,000 — a conservative estimate in the current softer market — the Lims would realise net cash proceeds after CPF OA refund (with accrued interest) and HDB loan repayment of approximately S$95,000–S$130,000 depending on their CPF usage and outstanding loan balance. This is a workable but not ample downpayment for a Tampines private condominium at S$1.2M–S$1.4M. They would need to factor in ABSD of 20% on the private condo if they buy before completing the HDB sale — a S$240,000–S$280,000 additional cost that would consume most or all of their available cash. The most prudent approach is to complete the HDB sale first, use the proceeds toward the condo downpayment, and then buy the private property as a first-time owner (0% ABSD).

What Might Come Next: HDB Resale Market Outlook for 2026–2027

The Q1 2026 dip is most likely the beginning of a gentle plateauing phase rather than a significant correction. The structural support for HDB resale prices remains robust: strong employment, sustained household formation, limited BTO supply in mature estates, and the continuing aspirational value of central-belt HDB flats. However, the MOP wave through 2026 and 2027 will keep resale supply elevated in growth towns, and the Plus/Prime classification’s subsidy-clawback rules are beginning to affect buyer eligibility calculations for units built post-August 2023.

URA’s Q1 2026 caution about “uncertain macroeconomic outlook” is a live risk variable — if global trade conditions deteriorate and employment sentiment weakens, discretionary HDB upgrade transactions are the first to soften. Conversely, if the June 2026 BTO ballot demand data shows continued oversubscription (particularly for the Bishan and Bukit Merah Prime sites), it would reinforce the view that underlying demand for well-located public housing remains structurally strong.

Related Articles

Frequently Asked Questions

Is the HDB resale market going to crash in 2026?

A 0.1% quarterly dip does not constitute a crash, and the structural conditions for a significant correction are not currently present. Singapore’s economy remains near full employment, household balance sheets are sound, and HDB resale prices are underpinned by genuine owner-occupier demand. The current softening reflects supply normalisation (MOP wave) and buyer prudence in an elevated-interest-rate environment, not a collapse in demand. A 5–10% correction over the next 12–18 months is plausible in the heartland segment if the MOP supply wave continues and macro conditions worsen, but this remains speculative.

Will the Government remove HDB cooling measures given the price decline?

Unlikely. The Government has historically been reluctant to loosen cooling measures on a 0.1% quarterly data point, preferring to see sustained trend evidence before adjusting policy. The current measures — wait-out periods, ABSD on second properties, LTV caps, TDSR/MSR constraints — are unlikely to be eased in 2026 absent a more significant downturn. It is worth noting that the April 2023 ABSD increase was applied when private prices were accelerating; a moderation in HDB prices would not typically trigger an ABSD reversal as the two markets are governed by separate policy rationales.

Why are million-dollar HDB transactions still rising if the market is cooling?

Million-dollar HDB transactions are driven by a specific micro-market: large units in premium central locations with long remaining leases, high floors, or exceptional views. This segment is structurally supply-constrained — fewer than 1% of HDB units meet these criteria — and demand from affluent Singaporean families who want to remain in public housing for cultural or financial reasons is sustained. The broader “average” market (heartland 4-room flats) is what the RPI captures, and this is where the cooling is most apparent. The two trends are not contradictory — they reflect the increasing stratification of Singapore’s public housing market.

How does the HDB RPI decline affect the CPF accrued interest I owe on my flat?

CPF accrued interest accumulates regardless of property prices — it is the notional interest (currently 2.5% per annum) that would have been earned had your CPF OA funds not been used for the property. On sale, the accrued interest must be returned to CPF before you can receive cash proceeds. A stagnating or declining property price does not reduce the accrued interest obligation; it simply means the gap between your sale proceeds and the CPF refund amount narrows. In extreme cases where a property value falls below the total CPF used (principal + accrued interest), there is a shortfall that buyers must make up from cash. This is called the CPF refund shortfall, and it is a genuine risk for buyers who purchased at peak prices with high CPF usage.

What towns are most affected by the MOP supply wave in 2026?

The 13,480 flats reaching MOP in 2026 are predominantly from the 2021 BTO launch cohort, which was particularly heavy in Punggol, Sengkang, Tengah (first wave), Tampines, Sembawang, and Woodlands. These OCR and fringe towns will see the highest relative increase in resale listing supply in 2026. Towns with fewer MOP-completers in 2026 — such as Bishan, Toa Payoh, and Queenstown, where BTO supply has been limited — are less exposed to the supply-side pressure and are likely to see more price stability or continued appreciation.


Disclaimer: This article is for general information and editorial analysis only and does not constitute financial, investment, or property advice. HDB market statistics are sourced from HDB’s Public Housing Statistics Q1 2026. Worked examples and projections are illustrative. Actual market conditions, prices, and policy parameters may differ. Consult a licensed property agent (CEA-registered) and a qualified financial adviser for personalised advice before making property decisions. LovelyHomes is not a licensed property agent and does not represent any developer, agency, or financial institution.

URA Q1 2026 Private Home Prices Rise 0.9% — Revised Up from +0.3% Flash, OCR Leads at +2.2%

URA Q1 2026 Private Home Prices Rise 0.9% — Revised Up from +0.3% Flash, OCR Leads at +2.2%

Singapore private home prices rose 0.9% in the first quarter of 2026 — almost three times the pace flagged in the URA flash estimate three weeks earlier. The final reading, published by the Urban Redevelopment Authority on 24 April 2026, marks the sixth consecutive quarter of growth in the private residential price index, and it tells a story that diverges sharply from the volume picture: prices firmed, but transactions slumped almost 40% quarter-on-quarter.

Quick Answer — what the URA Q1 2026 release shows

  • Overall private residential PPI: +0.9% q-o-q, sixth consecutive quarter of growth.
  • Sharp upward revision from the +0.3% flash estimate on 1 April.
  • Non-landed properties: +1.3%; landed: -1.8%, reversing the +3.4% prior quarter.
  • OCR led non-landed with +2.2%; RCR +0.8%; CCR +0.6%.
  • Transaction volume crashed: only 4,041 deals recorded by mid-March, -39.7% versus 4Q 2025.
  • Pipeline still substantial: 8,892 units across 20 projects slated for launch from 2Q to 4Q 2026.
URA Q1 2026 private home prices +0.9% — guide cover
URA Q1 2026 final release — private home prices revised up to +0.9%.

Flash to Final — A Substantial Upward Revision

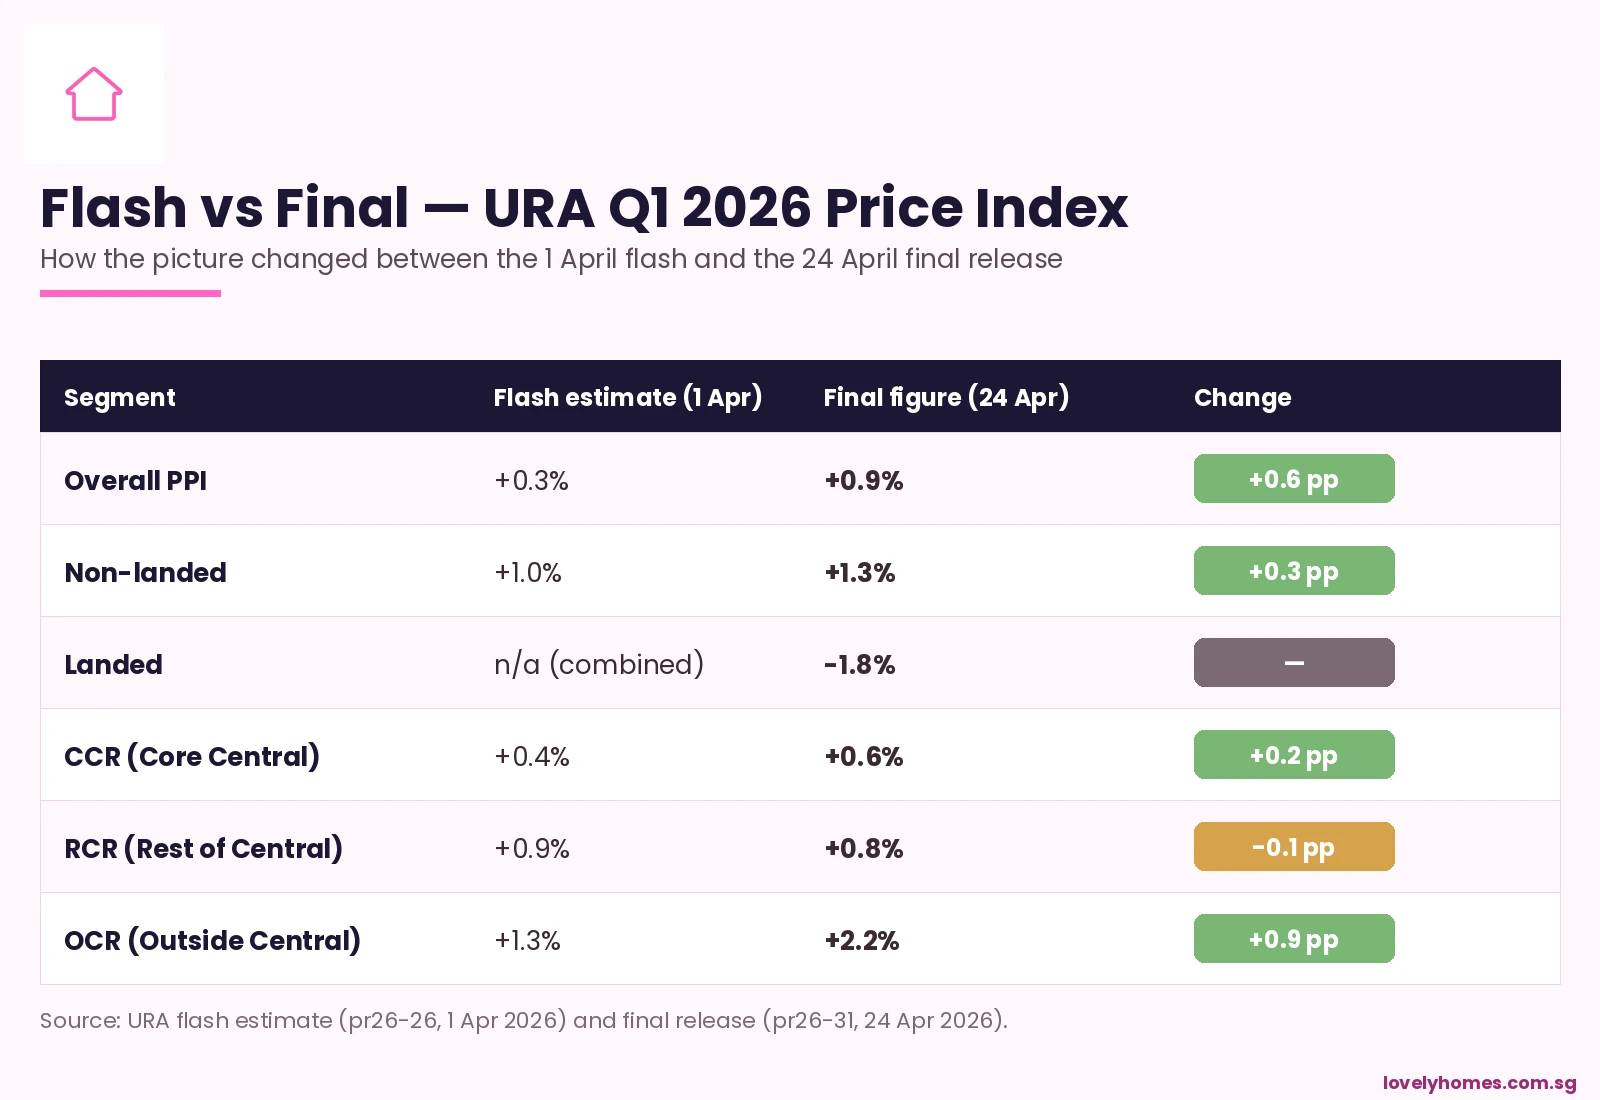
URA flash estimates are released on the first business day of every quarter, before the full transaction sample is in. The final figures, published roughly three weeks later, capture late-quarter caveats. In most quarters the gap between flash and final is small — perhaps 0.1 to 0.3 percentage points. In Q1 2026 the gap was larger than usual: from +0.3% to +0.9%.

URA Q1 2026 flash vs final by region — overall +0.3% revised to +0.9%, OCR +2.2%
Figure 1: Flash vs final — URA Q1 2026 PPI revisions by region.

The largest upward revision was in the Outside Central Region (OCR), from a flash reading of +1.3% to a final +2.2%. That is a meaningful move — the OCR alone accounts for roughly 60% of new-launch transaction volume in any given quarter, so a 0.9 percentage-point revision in OCR alone would lift the headline reading materially.

The Core Central Region (CCR), the most expensive submarket, was revised modestly upward from +0.4% to +0.6%, after a punishing -3.5% in 4Q 2025. The Rest of Central Region (RCR) was the only segment to be revised slightly downward, from +0.9% to +0.8%.

Why Were OCR Numbers Revised So Sharply?

Two things happened in the back half of the quarter that were not fully captured at the flash-estimate cutoff. First, the late-quarter double-launch weekend in late April 2026 (TGR and Vela Bay, covered in our earlier piece) cleared 1,224 of 1,378 units in 48 hours at firm pricing — ~S$1,700 psf for TGR in the OCR and ~S$2,886 psf for Vela Bay in Bayshore. Both sets of transactions dragged up the OCR PPI when finally captured.

Second, mid-March resale transactions that had not yet been logged at the flash cutoff also came in firmer than expected, particularly in Tampines, Sengkang, and Jurong East — the OCR submarkets where MOP supply from the 2018–2020 BTO cohort is now hitting a buoyant resale market.

The Volume Story — A 39.7% Crash

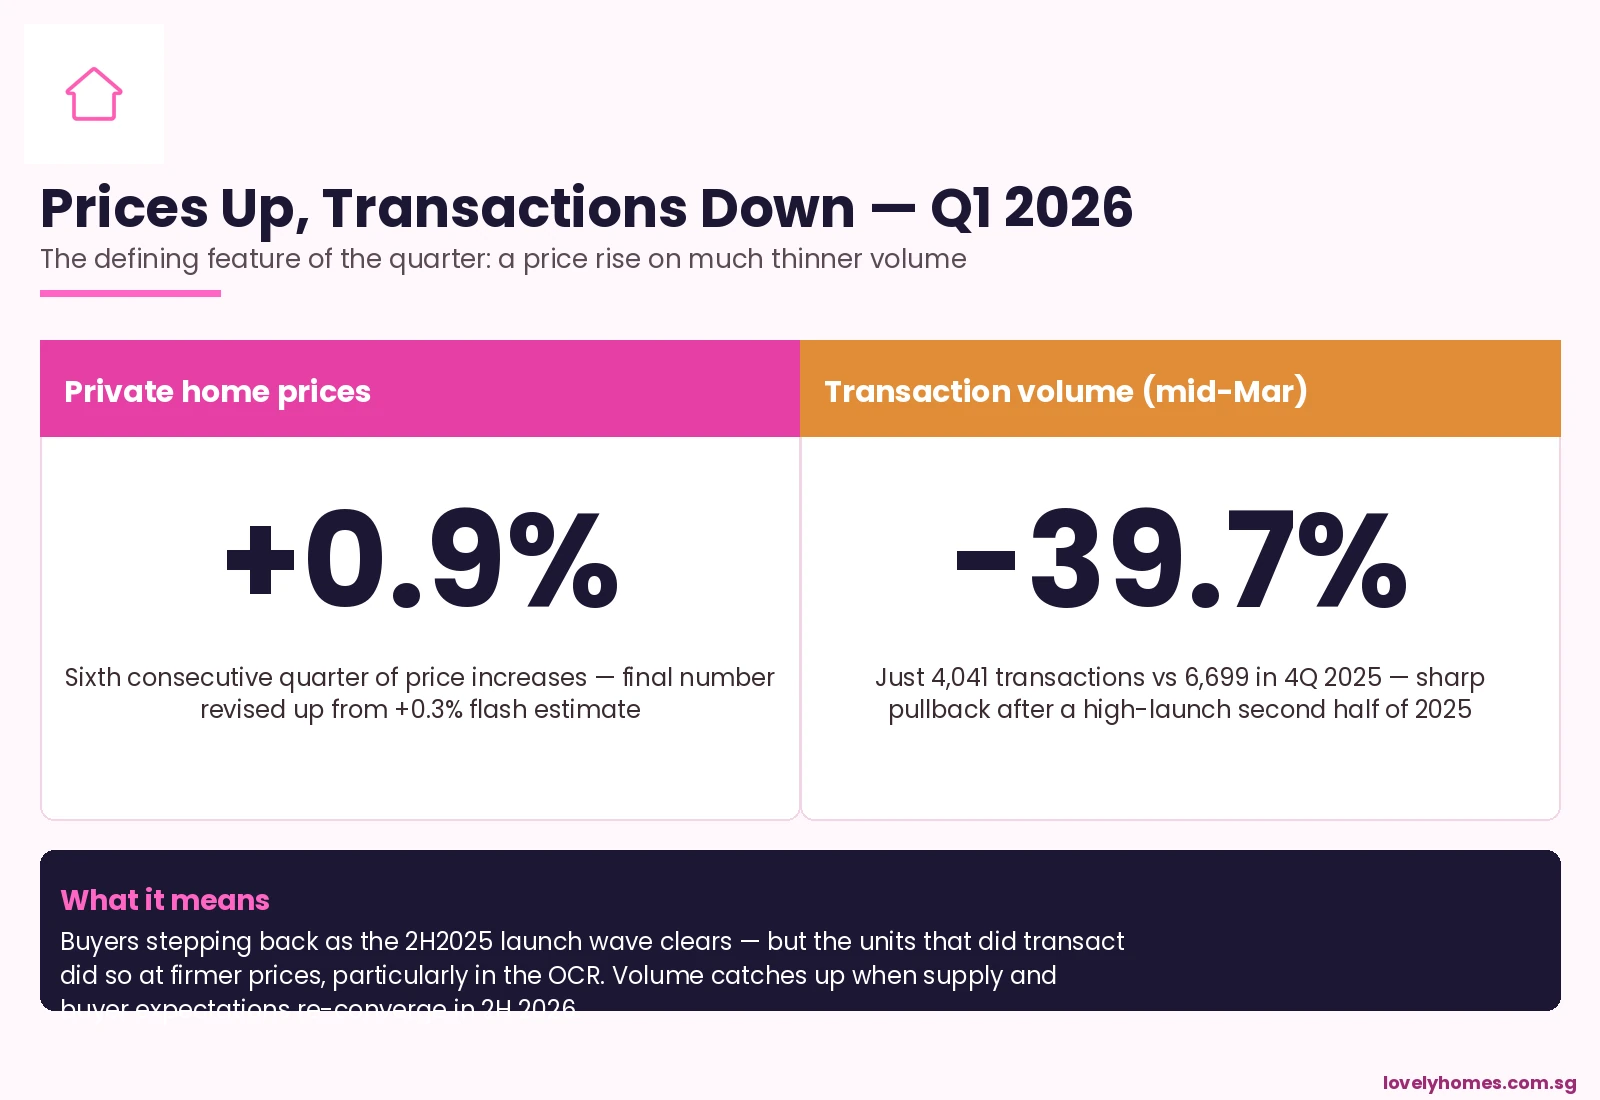
The price firming has to be read against a steep drop in activity. Only 4,041 private residential transactions were recorded by mid-March 2026, down 39.7% versus the 6,699 transactions in 4Q 2025. That is the lowest quarterly transaction count in nearly two years.

URA Q1 2026 prices +0.9% but transactions -39.7% — divergence chart
Figure 2: The defining tension of Q1 2026 — firmer prices on much thinner volume.

The volume drop has two readable causes. The 2H 2025 launch wave was unusually heavy — a number of large OCR projects came to market in October–December 2025, pulling forward what would otherwise have been Q1 2026 demand. Q1 2026 was always going to look soft on volume by comparison.

The second cause is sentiment. Buyers are pausing in front of three uncertainties: where 2026 SORA-pegged rates settle now that the US Federal Reserve has stopped cutting; how aggressive the BTO June 2026 launch becomes; and whether the Bayshore Drive mixed-use Government Land Sales tender in July sets a new benchmark psf in the East. Volume usually returns once these three questions get answered.

Landed -1.8% — Mean-Reverting After a Hot 4Q

The landed segment swung from +3.4% in 4Q 2025 to -1.8% in Q1 2026, a 5.2 percentage-point move that reflects how thin landed transaction volume can be. Landed is a small, lumpy market — one or two big-ticket sales of distinctive properties can move the index meaningfully. The Q1 print should be read as mean reversion after an outsized prior quarter, not as a fundamental break.

Rental Index +0.3% — Stabilising After 2024 Cool-Off

The private residential rental index ticked up 0.3% in Q1 2026 after the multi-quarter cool-off through 2024 and early 2025. Yields on private condos remain in the 3.0–3.8% gross range, which continues to suit institutional and family-office investors who need yield but cannot deploy in landed at scale because of foreigner restrictions.

What Comes Next — The Q2 to Q4 Pipeline

Indicator Q1 2026 reading What it implies for the rest of 2026
Overall PPI +0.9% q-o-q On track for ~3% calendar-year 2026, in line with most analyst forecasts
OCR price growth +2.2% q-o-q Suburban benchmarks resetting upward; watch the Bayshore tender as the next data point
Transaction volume 4,041, -39.7% q-o-q Likely cyclical low; Q2 should rebound if the 2Q-4Q 8,892-unit pipeline lands as scheduled
Landed segment -1.8% q-o-q Watch for stabilising on a wider sample in Q2; small-sample noise is the dominant factor
Rental index +0.3% q-o-q Yields steady; institutional appetite for buy-to-let condos persists

What This Means for Buyers — The Counter-Cyclical Window

For end-user buyers who have been waiting on the sidelines, Q1 2026 is the kind of moment that historically gets revisited as a buying window. Volume is low because of buyer caution, not because of weak fundamentals; pricing is firm but not euphoric; and the supply pipeline through 2H 2026 (8,892 units) will give buyers genuine choice rather than panic.

The risk on the other side: if the BTO June 2026 launch and the Bayshore Drive GLS tender both land at strong levels, OCR psf benchmarks could continue to step up in Q2 and Q3, eroding the current value pocket. Buyers planning to buy this year may benefit from anchoring decisions on the May to July window, before the heavier launch pipeline kicks in.

Frequently Asked Questions

Why was the upward revision from flash to final so large this quarter?

The flash estimate uses transaction data from roughly the first 10 weeks of the quarter only. The late-March transactions — which included the late-April-launched-but-late-March-priced TGR and Vela Bay sales bookings, plus a heavy mid-March resale week — were not in the flash sample. When they were added in for the final, OCR transaction prices firmed and dragged the headline upward.

Does this change the 2026 full-year forecast?

Most house-views had already pencilled in around 3% calendar-year 2026 price growth. Q1 at +0.9% is broadly consistent with that pace — not a beat, not a miss. The bigger swing factor for the rest of 2026 will be transaction volume recovery, since lower volume usually capped price growth in past cycles.

If volume is so weak, why are prices going up at all?

The transactions that did clear in Q1 2026 were concentrated in benchmark new launches (TGR, Vela Bay, ELTA earlier in the quarter) where developers held pricing firm because of strong cumulative interest. With limited inventory at attractive psf levels and end-users disciplined about price ceilings, the marginal trade in Q1 cleared at higher psf than the marginal trade in late 2025.

What does this mean for HDB upgraders?

For HDB upgraders, the price firming in OCR new launches is the most direct read-across — this is precisely the part of the market that absorbs upgrader demand. The flip side, however, is that HDB resale prices dipped 0.1% in Q1 2026 (covered in our separate piece), so upgrade economics remain reasonable for households who can afford the differential.

Does the URA Q1 2026 release affect cooling-measure expectations?

Almost certainly not. +0.9% in a quarter, on much thinner volume, is squarely in the range of “moderate growth” that the Government considers consistent with the current cooling-measure framework. Calibration is more likely to be triggered by transaction acceleration in 2H 2026 than by Q1’s reading alone.

How much new supply is coming?

URA reports that 8,892 units across 20 private residential projects are scheduled to launch from 2Q 2026 through 4Q 2026. That is a substantial pipeline, weighted to the OCR. Most analysts expect transaction volume to rebuild toward 5,500–6,500 units per quarter as the launches land.

Related Articles

Disclaimer

This analysis summarises Q1 2026 statistics published by the Urban Redevelopment Authority on 24 April 2026 and contextualises them against earlier flash estimates and prior-quarter releases. Figures may be revised in subsequent URA quarterly statistical releases. The piece does not constitute investment, tax, or legal advice. For authoritative figures consult URA, HDB, the Monetary Authority of Singapore, the Inland Revenue Authority of Singapore, CPF Board, and SingStat. Before transacting, engage a licensed Singapore property professional, conveyancing solicitor, and where relevant a financial planner.

Translate »