URA 1H 2026 GLS Programme: All 9 Confirmed List Sites Analysed — Supply, Locations and Price Outlook
Quick Answer — 1H 2026 GLS Confirmed List at a Glance
9 sites on the 1H 2026 Confirmed List: 6 private residential, 1 mixed-use, 2 EC plots
Total supply: 3,940 private residential units + 635 EC units = 4,575 units via confirmed list
Bayshore Drive mixed-use site is the headline parcel — 1,280 residential units + 22,500 sqm commercial
Holland Plain (2nd site) sole bid received: Sim Lian at S$1,491 psf ppr (tender closed 7 May 2026)
Peck Hay Road (Newton CCR) tender closes 11 June 2026; River Valley Green Parcel C closes 18 June 2026
1H 2026 confirmed list private supply is ~50% above the 10-year average — Government signalling adequate pipeline
Two EC sites at Canberra Drive (185 units) and Sembawang Drive (450 units) — now subject to 10-year MOP post-8 May reforms
The Urban Redevelopment Authority’s Government Land Sales (GLS) programme is the primary tool through which Singapore manages its private residential and executive condominium housing pipeline. Every new launch condo you see advertised — from Vela Bay to Tengah Garden Residences — originates with a developer winning a GLS tender years earlier. Understanding what is on the 1H 2026 confirmed list, where those sites sit, and what developers are likely to pay for them tells you a great deal about where new private supply will come from in 2028 and beyond.
This analysis covers all nine confirmed list sites from the 1H 2026 GLS programme, tracking tender timelines, indicative psf ppr ranges, expected launch pricing implications, and the macro supply picture. We cross-reference each site’s outcome against the most recent tender awards to give the clearest picture available as at 17 May 2026.
The 9 Confirmed List Sites — Overview and Unit Yield
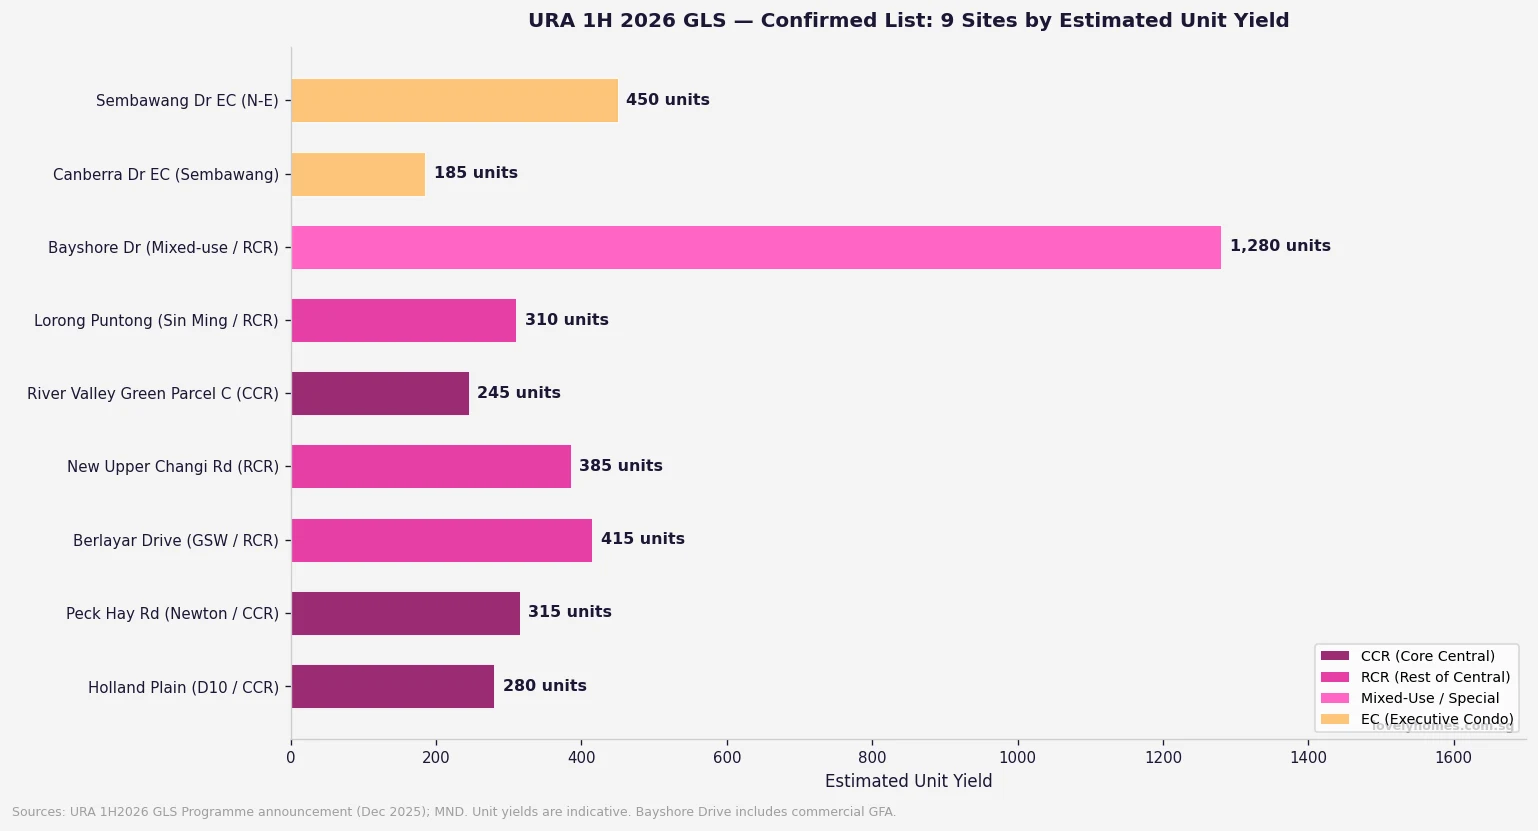
Figure 1: URA 1H 2026 GLS Confirmed List — all 9 sites by estimated unit yield, colour-coded by market segment (CCR, RCR, Mixed-Use, EC). Sources: URA, MND, December 2025.
Site
Location / Region
Units
Tender Status (May 2026)
Indicative Launch PSF
Holland Plain (2nd site)
D10 / CCR, Bukit Timah
~280
Closed 7 May; Sim Lian sole bid S$1,491 psf ppr
S$2,800–S$3,200+
Peck Hay Road
Newton / CCR
~315
Tender closes 11 June 2026
S$3,200–S$3,800+
Berlayar Drive
Gr Southern Waterfront / RCR
~415
Tender open / result pending
S$2,400–S$2,900
New Upper Changi Road
Bedok / RCR-adjacent OCR
~385
Tender open / result pending
S$2,100–S$2,500
River Valley Green Parcel C
River Valley / CCR
~245
Tender closes 18 June 2026
S$3,500–S$4,000+
Lorong Puntong (Sin Ming)
Bishan–AMK / RCR
~310
Tender open / result pending
S$2,400–S$2,800
Bayshore Drive (Mixed-Use)
Bayshore / RCR-adjacent
~1,280
Tender just opened; est. closes Jul 2026
S$2,750–S$3,100
Canberra Drive EC
Sembawang / North
~185
Tender result pending
S$1,400–S$1,600 (EC)
Sembawang Drive EC
Sembawang / North-East
~450
Tender result pending
S$1,350–S$1,550 (EC)
The Supply Context — Is 1H 2026 GLS Generous or Restrained?
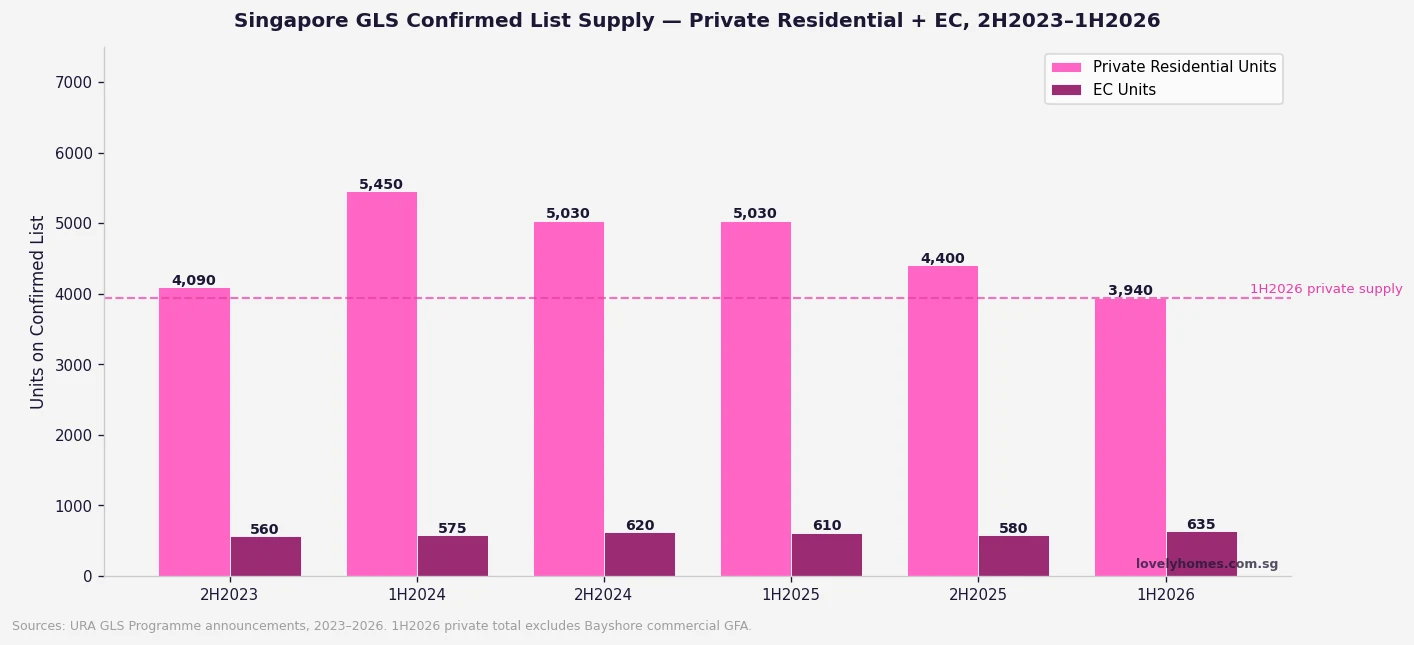
Figure 2: Singapore GLS Confirmed List supply, 2H2023–1H2026 — private residential and EC units. Sources: URA GLS Programme announcements.
The 1H 2026 confirmed list private residential supply of 3,940 units is approximately 50% above the 10-year average for a half-year GLS confirmed list, according to URA’s own commentary on the programme at announcement in December 2025. The Government has explicitly stated that this elevated supply is intended to “provide adequate housing options to cater to housing demand” and to moderate price growth — particularly after private residential prices rose 0.9% in Q1 2026 (following 0.6% in Q4 2025), driven by outside central region (OCR) outperformance.
However, the 3,940 private units across six sites is still meaningfully below the 5,450 units offered in 1H 2024 (the cyclical peak). The pattern reflects the Government’s calibrated approach: high enough to signal commitment to supply, but not so aggressive as to flood the pipeline and depress developer sentiment. The Reserve List (which requires developer applications to activate) provides an additional buffer of approximately 5,200 private units that can be unlocked if demand signals warrant it.
Site-by-Site Analysis
Holland Plain (2nd Site) — A Sole Bid That Surprised Analysts
The second Holland Plain site drew a single bid from Sim Lian Group at S$1,491 psf ppr (S$454 million) when the tender closed on 7 May 2026. Analysts had expected three to five bidders; the sole bid reflects elevated construction cost pressure, the lingering premium already embedded in District 10 pricing, and the fact that Sim Lian already holds the adjacent first Holland Plain site. A sole bid does not automatically mean the site will be awarded — URA typically evaluates whether the bid meets the reserve price — but Sim Lian’s continued strategic interest in Holland Plain is clear.
If awarded at S$1,491 psf ppr, market observers indicate a launch PSF of approximately S$2,800–S$3,200 would be needed for the developer to achieve a reasonable margin. This would mark a modest premium to recent CCR resale comparables in the D10 corridor, but is not out of step with the broader trajectory of central region new launches.
Peck Hay Road — Newton’s Newest CCR Site (Closes 11 June 2026)
The Peck Hay Road site is arguably the most competitively positioned residential plot in the 1H 2026 programme. Located in the Newton MRT interchange area (North South and Downtown Lines), the 0.55-hectare former transitional office site is expected to yield approximately 315 units. Newton is one of Singapore’s most liquid and sought-after CCR sub-markets; recent comparable projects in the vicinity have transacted at S$3,000–S$3,800 psf for new launches.
The tender closes 11 June 2026. Given Newton’s track record with competing bids — the area consistently attracts four to six developers per tender — this is likely to be one of the more competitive tenders of the half. A top bid in the S$1,600–S$1,900 psf ppr range is plausible.
River Valley Green Parcel C — CCR Premium Pricing (Closes 18 June 2026)
River Valley Green Parcel C is the third plot in the River Valley Green precinct and sits within Singapore’s prime residential core. The previous two parcels in this precinct were awarded at S$1,246 psf ppr (Parcel A, 2023) and S$1,402 psf ppr (Parcel B, 2024). Parcel C is expected to follow this upward trajectory, with a likely bid range of S$1,450–S$1,700 psf ppr. At those land costs, launch pricing of S$3,500–S$4,000+ psf is feasible. The tender closes 18 June 2026.
Bayshore Drive Mixed-Use — The Billion-Dollar Site
Bayshore Drive is the marquee site of the 1H 2026 programme. As a mixed-use parcel combining 1,280 residential units with 22,500 sqm of commercial space and a direct underground link to Bayshore MRT station (Thomson-East Coast Line), it is the largest and most complex tender in the current cycle. URA and EdgeProp analysis suggests bids of S$1.2–S$2 billion are plausible — making it one of the largest single GLS transactions in Singapore’s history if realised at the upper end. The tender was recently opened and is expected to close around July 2026. We will report on the results as they emerge. See our full Bayshore Drive analysis published 17 May 2026 for detailed site-level commentary.
The Two EC Sites — First Launches Under the New Rules
Canberra Drive (185 units, Sembawang) and Sembawang Drive (450 units) are the first EC tender sites to be marketed entirely under the 8 May 2026 rule changes — specifically the 10-year MOP, 90% first-timer quota, Normal Payment Scheme only, and 15-year privatisation. Developers bidding for these sites must now price in a longer hold requirement and potentially reduced secondary-market liquidity for buyers, which may moderate land bids slightly relative to pre-May 2026 EC tenders. That said, the 90% first-timer quota actually increases base demand, partially offsetting the downward pricing pressure from the MOP extension.
Worked Example — How GLS Land Cost Translates to Launch Price
To understand why these GLS tender outcomes matter for buyers, consider a simple breakeven analysis. If Peck Hay Road is awarded at S$1,750 psf ppr (the psf per plot ratio applied to the maximum permissible gross floor area), a developer builds 315 units on a 0.55 ha site with a plot ratio of approximately 3.5 (hypothetical). Total land cost per unit: approximately S$960,000–S$1,100,000 per unit across a mix of 1-bedroom to 3-bedroom formats.
Adding construction costs (approximately S$450–S$550 psf of GFA in 2026), financing costs (~5–7% of total development cost over 4–5 years), professional fees, and developer margin (~15–18% on cost), the resulting launch price to achieve commercial viability is approximately S$3,200–S$3,600 psf for a typical Newton CCR new launch. This is the arithmetic that underpins the price forecasts in our summary table above.
For buyers, the practical implication is straightforward: land acquired in 1H 2026 tenders will yield projects launching in approximately 2028–2029. The prices you see in those launch brochures will reflect today’s land cost, construction cost inflation over the next two years, and developer expectations for market conditions at launch.
What to Watch in 2H 2026
The three immediate milestones for the GLS programme are: the Peck Hay Road tender result (11 June), River Valley Green Parcel C result (18 June), and the Bayshore Drive tender outcome (expected ~July 2026). Each will provide a live read on developer appetite, construction cost pressures, and land pricing at different market segments.
The 2H 2026 GLS programme (expected to be announced in June 2026) will also be watched closely for whether the Government adjusts the confirmed list size up or down — a signal of its read on both housing demand and developer capacity. Given Q1 2026’s 0.9% private price rise, any material reduction in the 2H confirmed list would likely be read as a market-positive signal by developers and investors alike.
Frequently Asked Questions
What is the GLS programme and how does it affect property prices?
The Government Land Sales (GLS) programme is the mechanism through which URA and HDB release state land for private and public housing development. Developers bid competitively for confirmed list sites, and the winning bid establishes the land cost that feeds through into eventual new-launch pricing approximately 3–5 years after the tender award. A higher volume of GLS sites — and more competitive bidding — generally anchors the supply pipeline and moderates price growth. Conversely, a lean GLS programme or weak bidding signals supply tightening and can anticipate future price pressure. For buyers of new launch condominiums, understanding the GLS pipeline helps set realistic expectations for the prices and supply timing of projects coming to market in 2027–2029.
Why did Holland Plain attract only one bid?
The sole bid for the Holland Plain second site reflects a combination of factors: (1) construction costs remain elevated in Singapore, squeezing developer margins on premium CCR land; (2) Sim Lian already holds the adjacent first Holland Plain site, giving them a strategic advantage that reduces other developers’ relative competitiveness; (3) rising interest rates globally (despite Singapore’s SORA decline) have increased the cost of development financing; and (4) the site’s expected launch PSF of S$2,800–S$3,200 sits in a segment where buyer depth (given ABSD and TDSR constraints) is more limited than in the OCR. A sole bid is unusual but not unprecedented in CCR tenders.
What is the Bayshore Drive mixed-use site and why is it significant?
The Bayshore Drive site is a 3.4-hectare mixed-use parcel that combines 1,280 residential units with 22,500 sqm of commercial gross floor area and a direct underground pedestrian connection to Bayshore MRT (Thomson-East Coast Line). Its significance lies in scale (it is among the largest single GLS parcels offered in several years), location (the emerging Bayshore precinct next to East Coast Park), and mixed-use zoning (which adds commercial value alongside residential). If awarded at estimated values of S$1.2–S$2 billion, it will be one of the highest-value individual land sales in Singapore’s GLS history. See our Bayshore Drive GLS Tender 2026 piece for full site analysis.
How does the 1H 2026 GLS supply compare to previous years?
The 3,940 private residential units on the 1H 2026 confirmed list is approximately 50% above the 10-year average for a half-year confirmed list, but below the 5,450-unit peak seen in 1H 2024. URA has explicitly framed the elevated supply as a measure to ensure adequate pipeline and moderate price growth. Combined with the 12-site reserve list providing a further ~5,200 private units that can be activated on demand, total potential supply from the 1H 2026 GLS programme is approximately 9,185 units — a robust buffer against near-term supply shortfalls.
Should I wait for GLS results before buying a new launch?
GLS results affect new launches that will be built and sold approximately 3–5 years from now — they do not directly affect the pricing of projects already in the market today (such as Bayshore Parcel A, Tengah Garden Residences, or projects under construction). If you are considering a new launch purchase in 2026, the relevant supply is what is already available and selling, not what developers will bid for land this year. That said, monitoring GLS demand (bid volumes, psf ppr paid) gives a useful forward signal: when developers bid aggressively, they believe in future demand and pricing — which is supportive for current buyers. When they bid conservatively or not at all (as with Holland Plain’s sole bid), it may suggest more caution about the premium segment’s near-term outlook.
Disclaimer: This analysis is for general informational and commentary purposes only and does not constitute financial, investment, or property advice. GLS tender outcomes, indicative unit yields, and launch price projections are estimates based on publicly available data from URA, MND, and industry commentary as at 17 May 2026, and are subject to change. Actual tender results, awarded prices, and developer launch strategies may differ materially from projections. Always conduct independent research and consult a licensed conveyancing lawyer, financial adviser, or property consultant before making any investment decision. For official data, refer to URA.gov.sg, MND.gov.sg, and HDB.gov.sg.
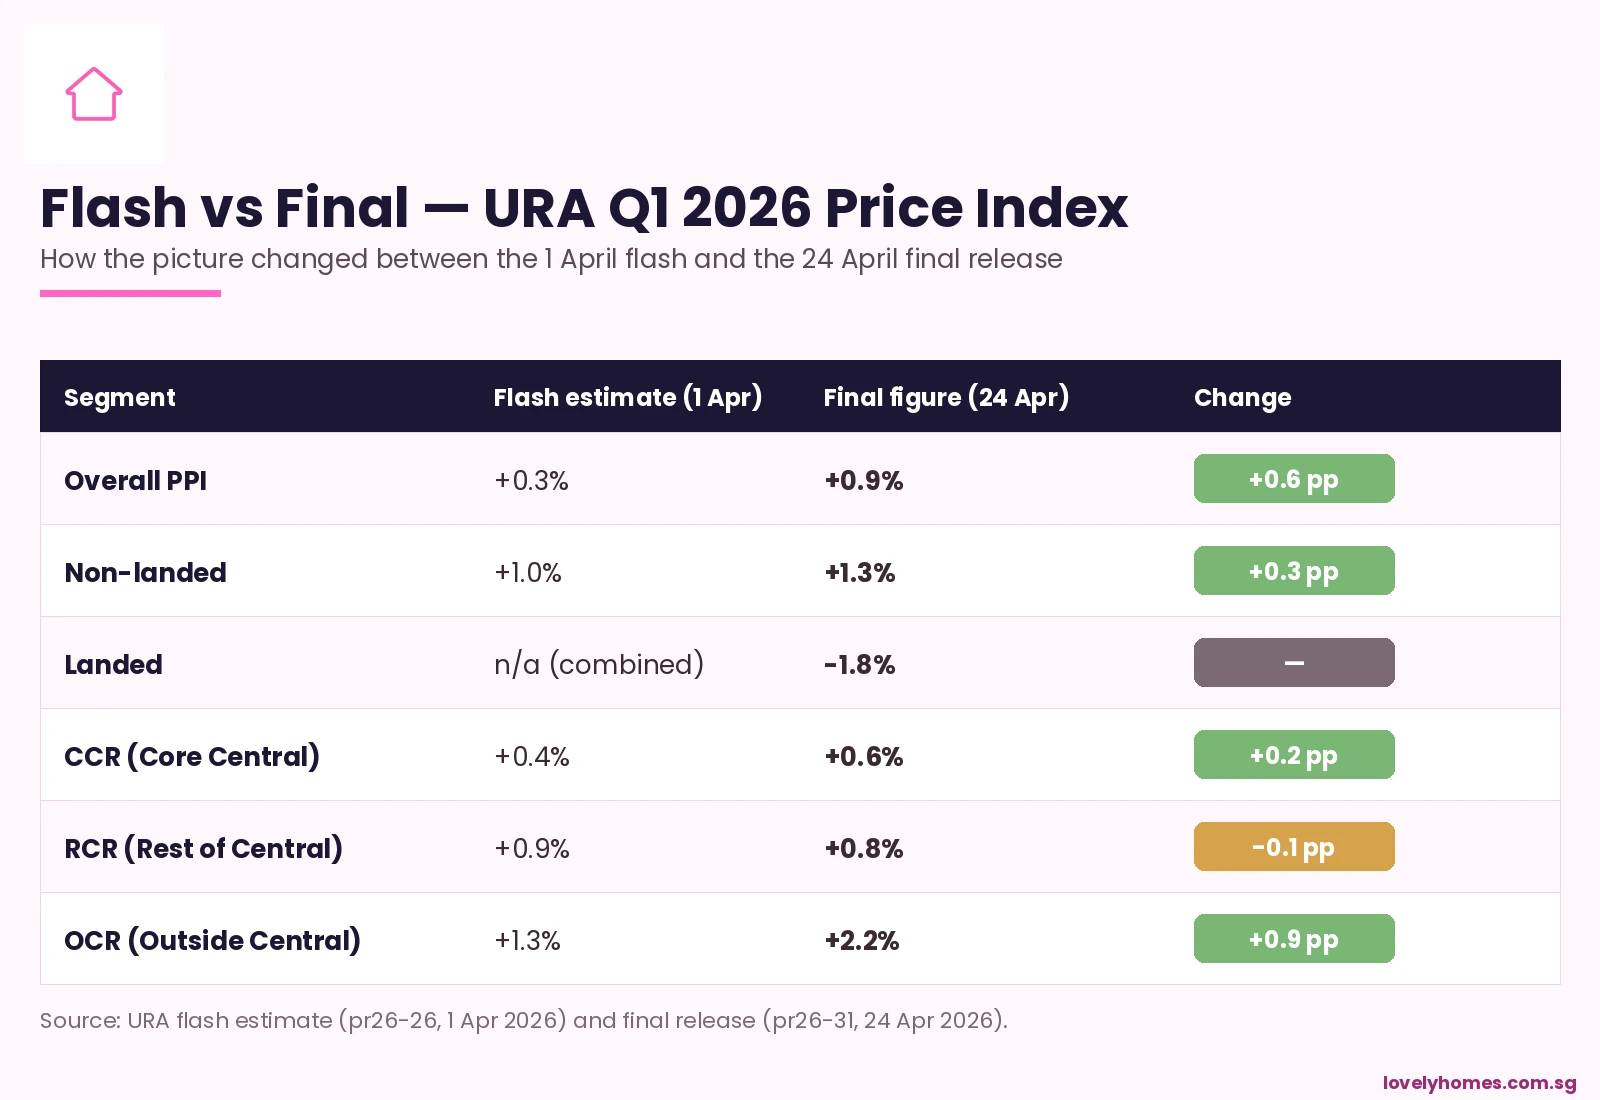
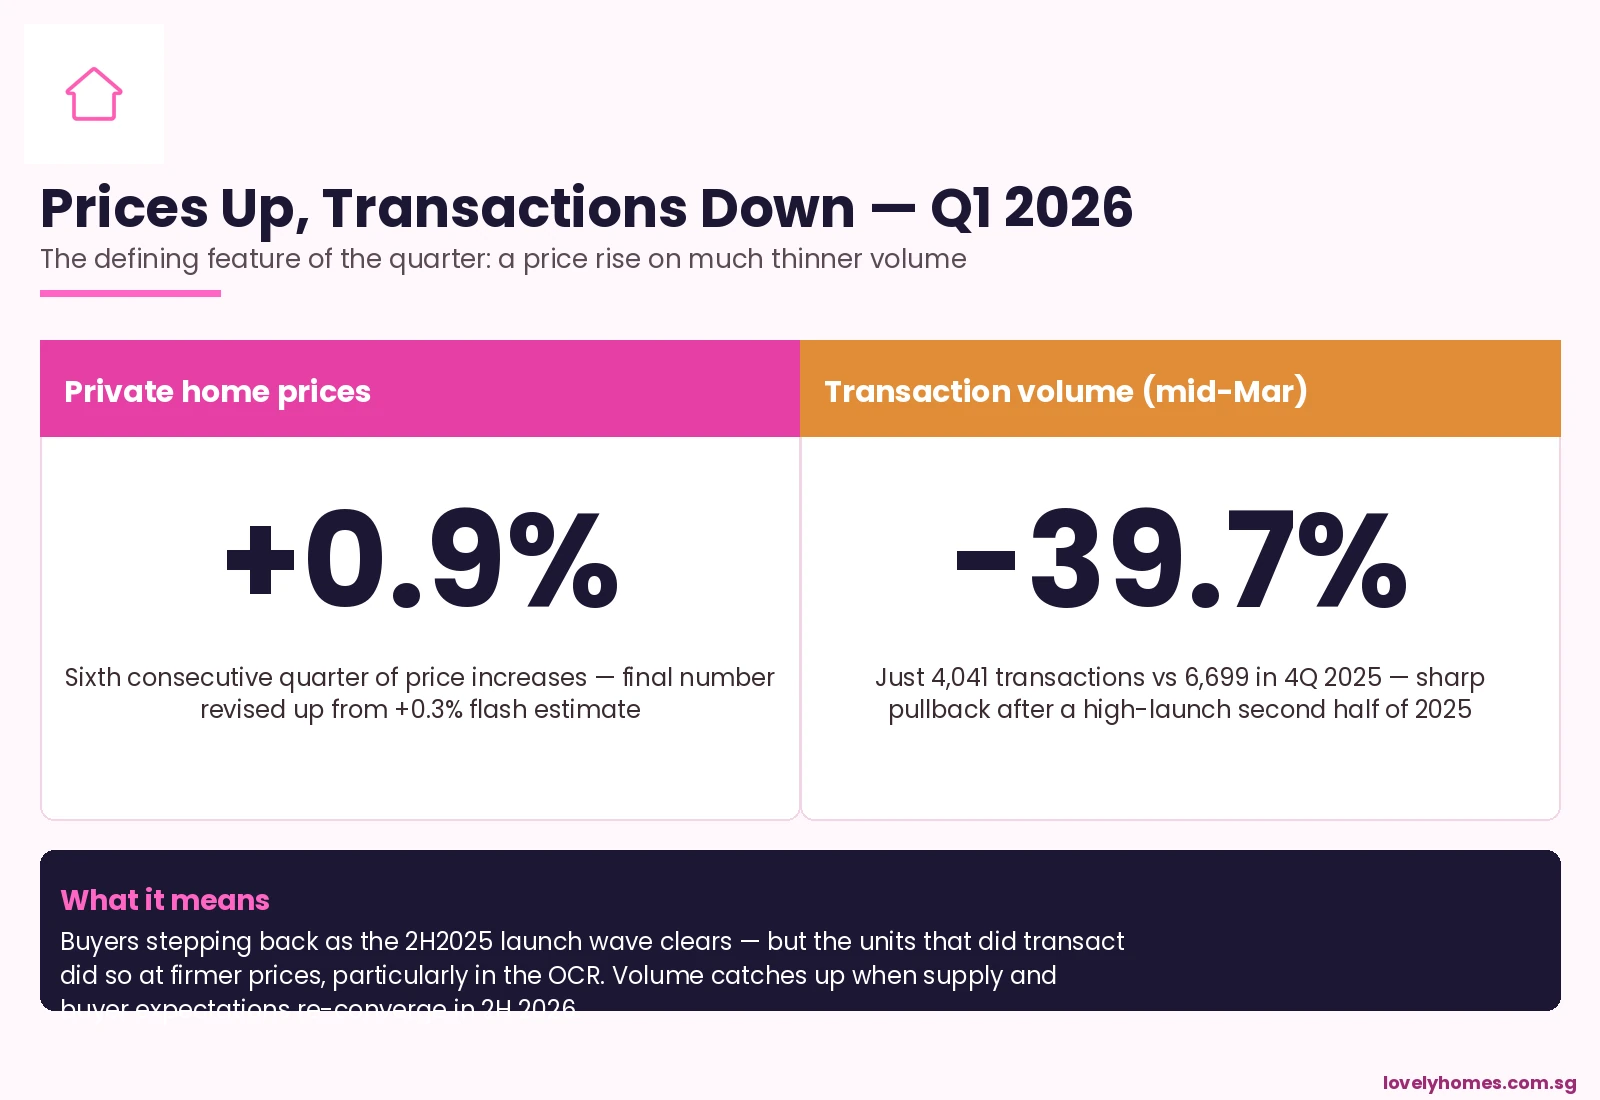
Singapore private home prices rose 0.9% in the first quarter of 2026 — almost three times the pace flagged in the URA flash estimate three weeks earlier. The final reading, published by the Urban Redevelopment Authority on 24 April 2026, marks the sixth consecutive quarter of growth in the private residential price index, and it tells a story that diverges sharply from the volume picture: prices firmed, but transactions slumped almost 40% quarter-on-quarter.
Sharp upward revision from the +0.3% flash estimate on 1 April.
Non-landed properties: +1.3%; landed: -1.8%, reversing the +3.4% prior quarter.
OCR led non-landed with +2.2%; RCR +0.8%; CCR +0.6%.
Transaction volume crashed: only 4,041 deals recorded by mid-March, -39.7% versus 4Q 2025.
Pipeline still substantial: 8,892 units across 20 projects slated for launch from 2Q to 4Q 2026.
URA Q1 2026 final release — private home prices revised up to +0.9%.
Flash to Final — A Substantial Upward Revision
URA flash estimates are released on the first business day of every quarter, before the full transaction sample is in. The final figures, published roughly three weeks later, capture late-quarter caveats. In most quarters the gap between flash and final is small — perhaps 0.1 to 0.3 percentage points. In Q1 2026 the gap was larger than usual: from +0.3% to +0.9%.
Figure 1: Flash vs final — URA Q1 2026 PPI revisions by region.
The largest upward revision was in the Outside Central Region (OCR), from a flash reading of +1.3% to a final +2.2%. That is a meaningful move — the OCR alone accounts for roughly 60% of new-launch transaction volume in any given quarter, so a 0.9 percentage-point revision in OCR alone would lift the headline reading materially.
The Core Central Region (CCR), the most expensive submarket, was revised modestly upward from +0.4% to +0.6%, after a punishing -3.5% in 4Q 2025. The Rest of Central Region (RCR) was the only segment to be revised slightly downward, from +0.9% to +0.8%.
Why Were OCR Numbers Revised So Sharply?
Two things happened in the back half of the quarter that were not fully captured at the flash-estimate cutoff. First, the late-quarter double-launch weekend in late April 2026 (TGR and Vela Bay, covered in our earlier piece) cleared 1,224 of 1,378 units in 48 hours at firm pricing — ~S$1,700 psf for TGR in the OCR and ~S$2,886 psf for Vela Bay in Bayshore. Both sets of transactions dragged up the OCR PPI when finally captured.
Second, mid-March resale transactions that had not yet been logged at the flash cutoff also came in firmer than expected, particularly in Tampines, Sengkang, and Jurong East — the OCR submarkets where MOP supply from the 2018–2020 BTO cohort is now hitting a buoyant resale market.
The Volume Story — A 39.7% Crash
The price firming has to be read against a steep drop in activity. Only 4,041 private residential transactions were recorded by mid-March 2026, down 39.7% versus the 6,699 transactions in 4Q 2025. That is the lowest quarterly transaction count in nearly two years.
Figure 2: The defining tension of Q1 2026 — firmer prices on much thinner volume.
The volume drop has two readable causes. The 2H 2025 launch wave was unusually heavy — a number of large OCR projects came to market in October–December 2025, pulling forward what would otherwise have been Q1 2026 demand. Q1 2026 was always going to look soft on volume by comparison.
The second cause is sentiment. Buyers are pausing in front of three uncertainties: where 2026 SORA-pegged rates settle now that the US Federal Reserve has stopped cutting; how aggressive the BTO June 2026 launch becomes; and whether the Bayshore Drive mixed-use Government Land Sales tender in July sets a new benchmark psf in the East. Volume usually returns once these three questions get answered.
Landed -1.8% — Mean-Reverting After a Hot 4Q
The landed segment swung from +3.4% in 4Q 2025 to -1.8% in Q1 2026, a 5.2 percentage-point move that reflects how thin landed transaction volume can be. Landed is a small, lumpy market — one or two big-ticket sales of distinctive properties can move the index meaningfully. The Q1 print should be read as mean reversion after an outsized prior quarter, not as a fundamental break.
Rental Index +0.3% — Stabilising After 2024 Cool-Off
The private residential rental index ticked up 0.3% in Q1 2026 after the multi-quarter cool-off through 2024 and early 2025. Yields on private condos remain in the 3.0–3.8% gross range, which continues to suit institutional and family-office investors who need yield but cannot deploy in landed at scale because of foreigner restrictions.
What Comes Next — The Q2 to Q4 Pipeline
Indicator
Q1 2026 reading
What it implies for the rest of 2026
Overall PPI
+0.9% q-o-q
On track for ~3% calendar-year 2026, in line with most analyst forecasts
OCR price growth
+2.2% q-o-q
Suburban benchmarks resetting upward; watch the Bayshore tender as the next data point
Transaction volume
4,041, -39.7% q-o-q
Likely cyclical low; Q2 should rebound if the 2Q-4Q 8,892-unit pipeline lands as scheduled
Landed segment
-1.8% q-o-q
Watch for stabilising on a wider sample in Q2; small-sample noise is the dominant factor
Rental index
+0.3% q-o-q
Yields steady; institutional appetite for buy-to-let condos persists
What This Means for Buyers — The Counter-Cyclical Window
For end-user buyers who have been waiting on the sidelines, Q1 2026 is the kind of moment that historically gets revisited as a buying window. Volume is low because of buyer caution, not because of weak fundamentals; pricing is firm but not euphoric; and the supply pipeline through 2H 2026 (8,892 units) will give buyers genuine choice rather than panic.
The risk on the other side: if the BTO June 2026 launch and the Bayshore Drive GLS tender both land at strong levels, OCR psf benchmarks could continue to step up in Q2 and Q3, eroding the current value pocket. Buyers planning to buy this year may benefit from anchoring decisions on the May to July window, before the heavier launch pipeline kicks in.
Frequently Asked Questions
Why was the upward revision from flash to final so large this quarter?
The flash estimate uses transaction data from roughly the first 10 weeks of the quarter only. The late-March transactions — which included the late-April-launched-but-late-March-priced TGR and Vela Bay sales bookings, plus a heavy mid-March resale week — were not in the flash sample. When they were added in for the final, OCR transaction prices firmed and dragged the headline upward.
Does this change the 2026 full-year forecast?
Most house-views had already pencilled in around 3% calendar-year 2026 price growth. Q1 at +0.9% is broadly consistent with that pace — not a beat, not a miss. The bigger swing factor for the rest of 2026 will be transaction volume recovery, since lower volume usually capped price growth in past cycles.
If volume is so weak, why are prices going up at all?
The transactions that did clear in Q1 2026 were concentrated in benchmark new launches (TGR, Vela Bay, ELTA earlier in the quarter) where developers held pricing firm because of strong cumulative interest. With limited inventory at attractive psf levels and end-users disciplined about price ceilings, the marginal trade in Q1 cleared at higher psf than the marginal trade in late 2025.
What does this mean for HDB upgraders?
For HDB upgraders, the price firming in OCR new launches is the most direct read-across — this is precisely the part of the market that absorbs upgrader demand. The flip side, however, is that HDB resale prices dipped 0.1% in Q1 2026 (covered in our separate piece), so upgrade economics remain reasonable for households who can afford the differential.
Does the URA Q1 2026 release affect cooling-measure expectations?
Almost certainly not. +0.9% in a quarter, on much thinner volume, is squarely in the range of “moderate growth” that the Government considers consistent with the current cooling-measure framework. Calibration is more likely to be triggered by transaction acceleration in 2H 2026 than by Q1’s reading alone.
How much new supply is coming?
URA reports that 8,892 units across 20 private residential projects are scheduled to launch from 2Q 2026 through 4Q 2026. That is a substantial pipeline, weighted to the OCR. Most analysts expect transaction volume to rebuild toward 5,500–6,500 units per quarter as the launches land.
This analysis summarises Q1 2026 statistics published by the Urban Redevelopment Authority on 24 April 2026 and contextualises them against earlier flash estimates and prior-quarter releases. Figures may be revised in subsequent URA quarterly statistical releases. The piece does not constitute investment, tax, or legal advice. For authoritative figures consult URA, HDB, the Monetary Authority of Singapore, the Inland Revenue Authority of Singapore, CPF Board, and SingStat. Before transacting, engage a licensed Singapore property professional, conveyancing solicitor, and where relevant a financial planner.
Wait-Out Period: Private property owners must wait 15 months before buying HDB resale without grant.
What are Singapore’s Property Cooling Measures?
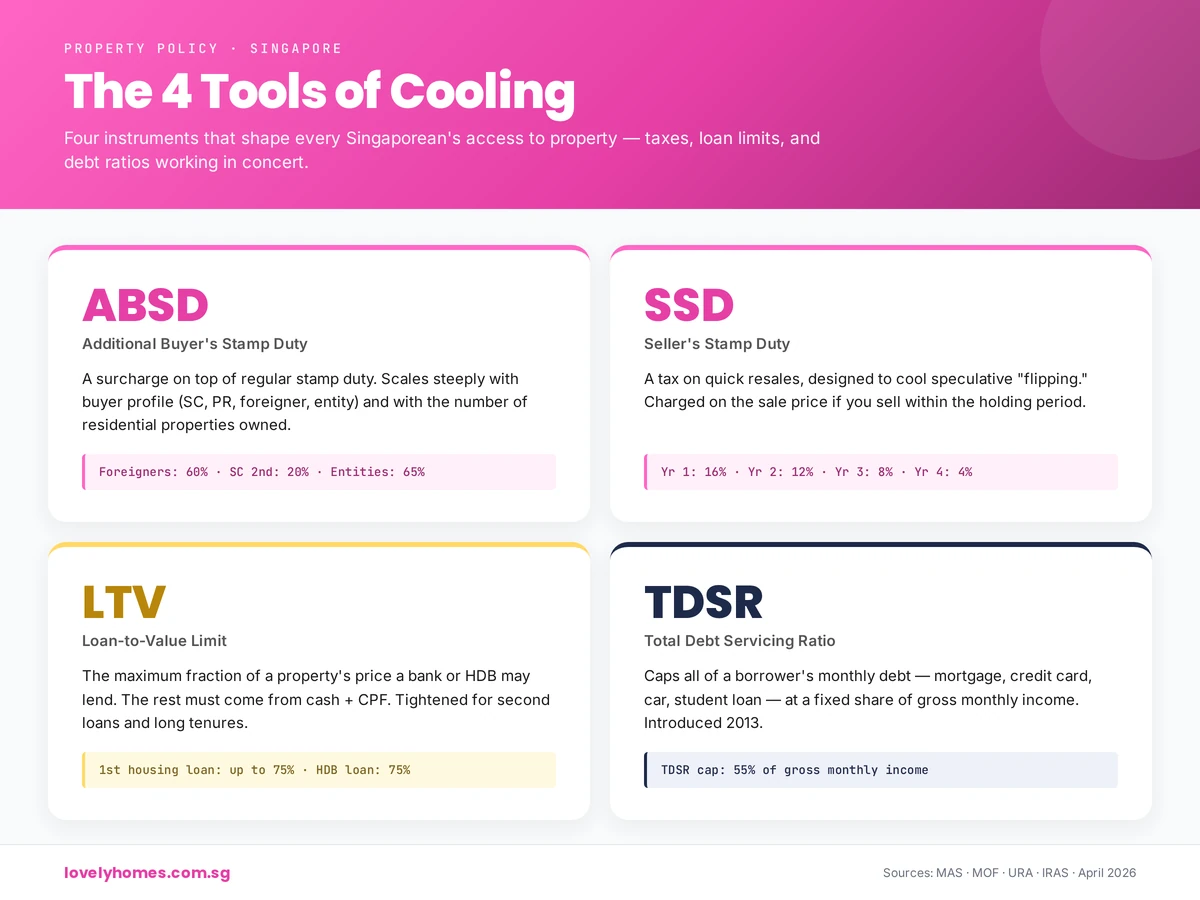
Singapore’s property cooling measures are a suite of policy tools designed to moderate demand, curb speculation, and ensure housing remains affordable. They exist because rapid property price growth can outpace wage growth, lock first-time buyers out of the market, and create unsustainable bubbles. Four key agencies administer these measures: the Monetary Authority of Singapore (MAS), the Urban Redevelopment Authority (URA), the Inland Revenue Authority of Singapore (IRAS), and the Housing and Development Board (HDB). Together, they apply tools such as stamp duties, loan limits, affordability tests, and holding periods to regulate the market and protect both buyers and the broader economy.
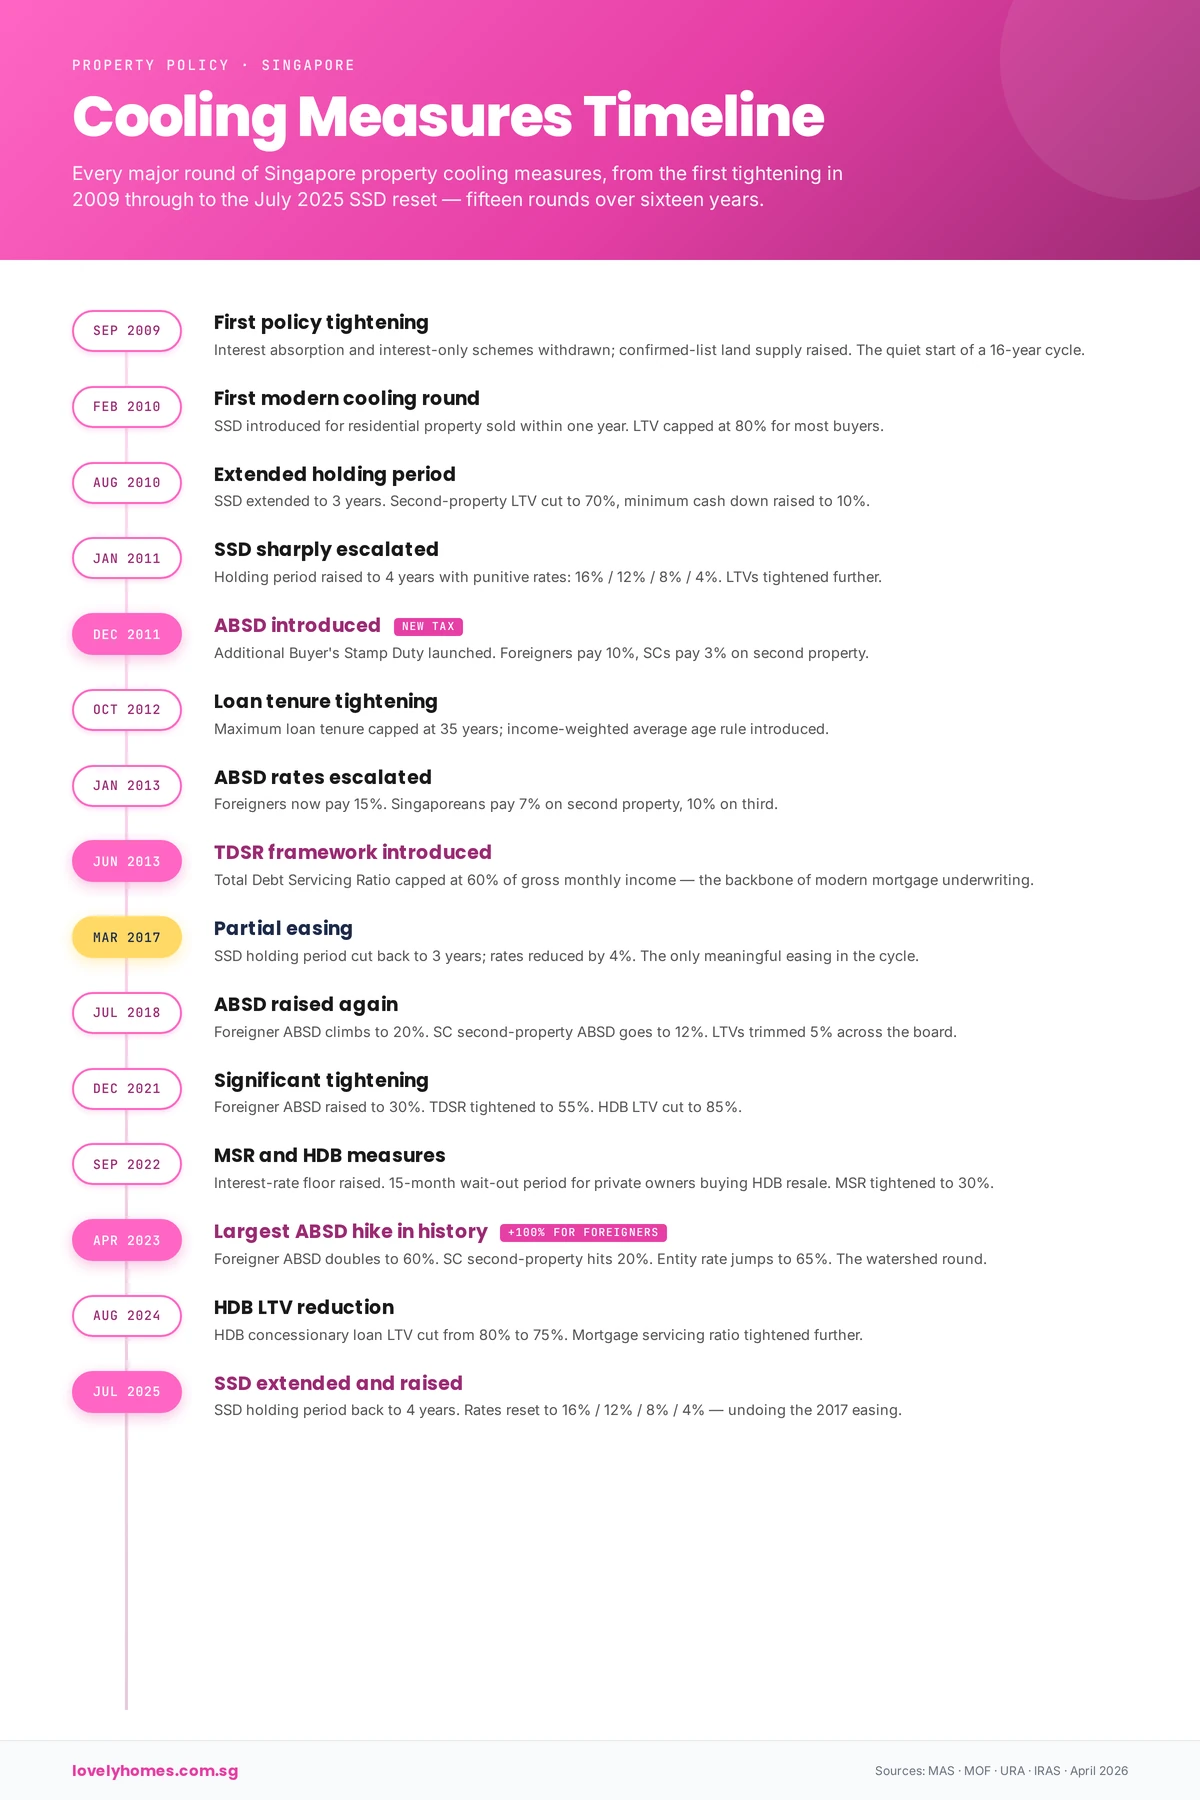
Figure 1: The 15 major rounds of Singapore property cooling measures, 2009–2026.
September 2009: The First Policy Tightening
Before the modern cooling era, the government moved to restrict lending practices. In September 2009, the Monetary Authority of Singapore (MAS) disallowed two risky loan products: the Interest Absorption Scheme (IAS) and Interest-Only Housing Loans (IOL). These products had allowed borrowers to defer principal repayment during the early years of a mortgage, increasing default risk during rate rises. By banning them, the government signalled a preference for prudent, full-amortising loans and set the stage for the more comprehensive cooling measures that would follow.
February 2010: The First Modern Cooling Round
On 20 February 2010, Singapore introduced its first comprehensive cooling package, reflecting rapid price growth and surging demand. The government introduced two major tools:
Seller’s Stamp Duty (SSD): Properties sold within one year were hit with a 3% SSD. The intent was to discourage “flipping”—rapid resale for short-term gain.
Loan-to-Value (LTV) limit: Reduced from 90% to 80%, requiring buyers to put down at least 20%. This reduced lender exposure and made buyers more cautious.
These measures reflected a key insight: when buyers can leverage heavily and exit quickly, prices can spiral. By raising the entry cost and the holding cost, the government aimed to attract only genuine buyers.
August 2010: Extended Holding Period
By mid-2010, demand remained strong. On 19 August 2010, the government extended the SSD holding period from 1 year to 3 years, raising the cost of short-term resale. For those with existing loans, the LTV limit tightened further to 70%, and cash downpayment requirements rose, particularly hurting leveraged investors.
January 2011: Sharp SSD Escalation
Recognising that the market was still overheating, the government on 8 January 2011 escalated the SSD significantly. The new structure was:
Year 1: 16%
Year 2: 12%
Year 3: 8%
Year 4: 4%
The rationale was unmistakable: hold for less than a year and lose a sixth of your sale price. LTV limits were also tightened to 60% for those with existing loans, making it much harder for property investors to string together multiple mortgages.
December 2011: ABSD Introduced
On 8 December 2011, Singapore introduced the Additional Buyer’s Stamp Duty (ABSD), its most powerful tool. ABSD was a second layer of stamp duty on top of the normal Buyer’s Stamp Duty (BSD), calibrated to buyer type:
Singapore Citizens buying a 2nd+ property: 3%
Singapore Citizens buying a 3rd+ property: 3%
Permanent Residents buying a 2nd+ property: 3%
Foreigners: 10%
Corporate entities: 10%
ABSD was revolutionary because it directly attacked investment demand, particularly from overseas. It signalled that Singapore prioritised homeownership for citizens over investment returns for outsiders.
October 2012: Loan Tenure Tightening
The Monetary Authority of Singapore further tightened lending on 19 October 2012. The maximum loan tenure was capped at 35 years, with a penalty: if LTV remained above 60% after 30 years, the LTV would be capped at 40% in year 31 onwards. This forced borrowers to repay principal faster, reducing their borrowing power and making loans less attractive.
January 2013: ABSD Escalation
On 11 January 2013, the government raised ABSD across the board:
Singapore Citizens (2nd property): 7%
Singapore Citizens (3rd+ property): 10%
Permanent Residents (2nd+ property): 10%
Foreigners: 15%
Entities: 15%
The hike reflected continued demand, particularly from foreign investors and corporate buyers. Cash downpayment requirements also rose, targeting multiple-property owners and entities.
June 2013: TDSR Framework Introduced
On 28 June 2013, the Monetary Authority of Singapore introduced the Total Debt Servicing Ratio (TDSR) framework. TDSR capped total monthly debt repayments (mortgage, car loan, credit cards, personal loans, etc.) at 60% of gross monthly income. The intention was to prevent over-leverage: even if house prices were rising, a banker couldn’t lend to someone whose entire income was going to debt service.
This was a game-changer because it wasn’t about house prices directly—it was about borrower health. It also forced banks to stress-test loans, assuming interest rates would rise, to ensure borrowers could survive a shock.
March 2017: Partial Easing
By 2016–2017, prices had stabilised and growth had slowed. On 5 March 2017, the government eased some measures:
SSD holding period reduced from 4 years to 3 years, though rates remained steep (12%/8%/4% for years 1–3).
TDSR and ABSD eased slightly for refinancing.
This signalled a shift: the government was confident the market was no longer overheating and could afford marginal relief.
July 2018: ABSD Raised Again
By mid-2018, there were signs of renewed speculative interest, particularly from foreign and corporate buyers. On 6 July 2018, the government raised ABSD sharply:
LTV limits also tightened by 5 percentage points across all categories, making down payments larger and borrowing power lower.
December 2021: Significant Tightening
After years of near-zero interest rates post-COVID, demand surged again. On 16 December 2021, the government announced a comprehensive tightening:
ABSD raised again: foreigners to 30%; entities to 35%; PR 2nd property to 20%.
TDSR tightened from 60% to 55% of gross monthly income.
Interest-rate floor for TDSR/MSR calculations raised to 3.5% for private bank loans (previously 3%).
HDB LTV limits reduced across the board.
This was a significant hardening, reflecting real concern about affordability following three years of price growth.
September 2022: MSR and HDB Measures
On 30 September 2022, the government introduced new measures targeting the HDB resale market, where first-time buyers (and upgraders) primarily shop:
Mortgage Servicing Ratio (MSR) introduced: For HDB and Executive Condominium (EC) loans, monthly mortgage payments cannot exceed 30% of gross income—stricter than TDSR’s 55%.
15-month wait-out period: Private property owners must wait 15 months after selling before buying an HDB resale flat, curbing investor demand for subsidised public housing.
Interest-rate floor for TDSR/MSR raised from 3% to 3.5% for private loans; 3% for HDB loans.
These moves directly sheltered first-time HDB buyers from investor competition.
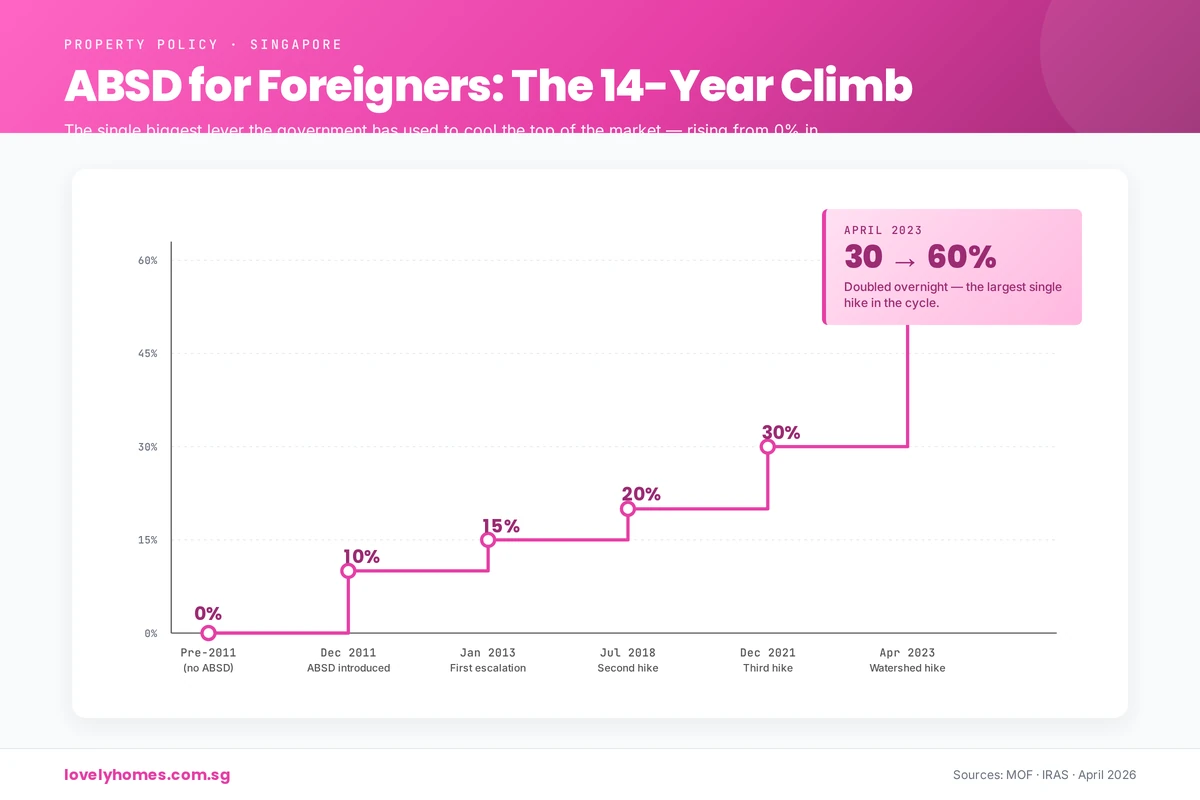
Figure 3: Foreigner ABSD climbed from 0% in 2011 to 60% in April 2023 — the largest single hike in the cycle.
April 2023: Largest ABSD Hike in History
On 27 April 2023, faced with renewed price acceleration in Q1 2023 (especially among owner-occupiers), the government announced its largest ABSD increase:
This was the most aggressive escalation since ABSD’s introduction, reflecting the government’s determination to prioritise homeownership for citizens and slow speculation. A foreign buyer purchasing a S$2 million condo now faced S$1.2 million in ABSD—an enormous barrier.
August 2024: HDB LTV Reduction
On 20 August 2024, the government reduced the Loan-to-Value (LTV) limit for HDB-granted housing loans from 80% to 75%. This meant HDB buyers now needed a 25% down payment instead of 20%, directly reducing borrowing power for this segment. Concurrently, higher CPF Housing Grants were introduced for first-time buyers to offset the impact, retaining affordability.
July 2025: SSD Extended and Raised
On 3 July 2025, the government responded to a spike in “flipping”—buyers purchasing uncompleted units (off-plan) and reselling before completion or soon after. The SSD holding period was extended from 3 years to 4 years, and rates were raised across the board by 4 percentage points:
Year 1: 20% (from 16%)
Year 2: 16% (from 12%)
Year 3: 12% (from 8%)
Year 4: 8% (from 4%)
This further discouraged short-term speculation while allowing long-term owners to exit penalty-free after four years.
Current Cooling Measures Framework (April 2026)
The current cooling-measures framework, established by the 27 April 2023 ABSD hike and subsequently adjusted by the 20 August 2024 HDB LTV reduction and the 4 July 2025 SSD restructure, remains in force as at April 2026. MAS, MND, URA and HDB jointly review the framework regularly and have repeatedly indicated they will recalibrate the measures — either tightening or easing — in response to market conditions.
Figure 2: The four core cooling tools — taxes (ABSD, SSD), loan limits (LTV) and debt ratios (TDSR) working in concert.
Let’s illustrate the impact with a hypothetical Singapore Citizen (SC) buying a second property valued at S$2 million:
Year
ABSD Rate
ABSD Cost (S$)
BSD + ABSD Total
2010 (Feb)
0%
S$0
~S$20,000 (BSD only)
2013 (Jan)
7%
S$140,000
~S$160,000
2018 (July)
7%
S$140,000
~S$160,000
2023 (April)
20%
S$400,000
~S$420,000
2026 (April)
20%
S$400,000
~S$420,000
Notice the leap from 2013 to 2023: the cost of buying a second home more than doubled in stamp duty alone, while the property value remained constant. This is the direct impact of cooling measures: they make property ownership more expensive, not by changing the property itself, but by raising friction and entry costs.
Why Have Cooling Measures Worked?
Singapore’s housing market has not crashed, despite aggressive cooling measures—a fact some cite as evidence of failure. But that misses the point. Cooling measures are designed to slow, not stop, price growth; to reduce speculation, not eliminate it; and to align prices with incomes, not freeze them.
Consider the evidence:
Slower growth: Private residential property annual price gains have typically stayed in the 2–5% range post-2013, compared to double-digit growth in the early 2010s. This moderation reflects a market rebalancing, where price appreciation has settled into a more sustainable trajectory aligned with economic fundamentals such as wage growth and rental yields.
Affordability preserved: First-time buyers, particularly HDB upgraders, have continued to buy; median house prices have not become so extreme relative to median incomes that the market has fractured. The price-to-income ratio in Singapore remains among the most manageable in developed Asia, allowing younger buyers to enter the market without undue hardship.
Comparison to global peers: Hong Kong, Vancouver, and Sydney have seen much steeper price-to-income ratios despite less stringent cooling measures. In Hong Kong, for example, a property may cost 20–30 times annual median household income; in Vancouver and Sydney, the ratio exceeds 12–15. Singapore’s pragmatic approach has kept the ratio at a more sustainable 8–10 times, making the market more accessible.
Investor activity moderated: The share of property transactions by investors (vs. owner-occupiers) has declined, indicating cooling measures are successfully crowding out speculative demand. This shift is crucial: when investors withdraw, price volatility typically decreases and stability improves.
Market resilience: The market has absorbed multiple rounds of tightening—seven major cooling packages since 2009—without experiencing a crash. This speaks to the underlying strength of Singapore’s economy and the government’s ability to calibrate policy precisely, neither so tight as to stifle the market nor so loose as to permit excess.
In short, cooling measures have succeeded in their core mission: managed, sustainable growth that preserves homeownership as an achievable goal for Singaporeans whilst safeguarding financial stability.
What Might Come Next?
Predicting future cooling measures is speculative, but several potential levers exist if the market overheats again. The government has shown it is willing to adjust policy swiftly when conditions warrant, and the following measures are within the realm of possibility:
Further LTV tightening: LTV could drop below 75% for HDB and 70% for private, forcing larger down payments. This would particularly affect HDB first-time buyers, though offsetting grants could mitigate the impact.
ABSD escalation on entities: Corporate and foreign entity purchases could face rates exceeding 70%, further discouraging institutional investors and offshore funds from treating Singapore residential property as an alternative asset class.
TDSR reduction: The 55% threshold could tighten to 50%, limiting borrowing power even further. This would reduce the quantum of debt banks could extend and force buyers to increase down payments or reduce property search prices.
Extended hold periods: SSD holding could extend beyond four years; MSR wait-out could lengthen beyond 15 months. A 5–7 year SSD period would effectively end short-to-medium-term flipping as an investment strategy.
Targeted HDB measures: Given HDB’s social mission, the government could ring-fence HDB buying further (e.g., longer wait-out periods for private owners, stricter owner-occupancy rules for upgrade purchases).
Differentiated ABSD by property type: Separate ABSD rates for landed (houses, land) vs. non-landed (condos, ECs) to focus cooling where prices are most extreme. Landed property prices have historically appreciated faster than condominiums, making them a natural target for stricter cooling.
Interest-rate floor adjustments: The MAS could raise the notional interest-rate floor used in TDSR/MSR calculations from the current 4% (private) to 4.5% or 5%, making loans seem more expensive during qualification, thereby reducing lending volumes.
These possibilities are illustrative, not predictions. The Government has consistently emphasised that cooling measures are reviewed against prevailing market conditions, and that any further recalibration — tightening or easing — will be driven by the data. Buyers and sellers should plan on the framework in force today and monitor MAS, URA, MND, IRAS and HDB announcements for updates.
Frequently Asked Questions
1. What’s the difference between ABSD and SSD?
ABSD (Additional Buyer’s Stamp Duty) is a tax paid by the buyer when purchasing a property (typically 2nd or 3rd+). It’s calibrated by buyer type (citizen, PR, foreigner, entity) and aims to dampen investment demand. SSD (Seller’s Stamp Duty) is a tax paid by the seller when selling within a holding period; it discourages flipping. Both reduce demand, but ABSD targets entry; SSD targets exit.
2. Are cooling measures permanent?
No. All cooling measures are policy tools, not constitutional laws. They can be eased or tightened depending on market conditions. For example, SSD was partially eased in March 2017, and TDSR has been adjusted twice (60% → 55%). The Government reviews the framework regularly against market conditions.
3. Can you appeal a cooling-measure penalty (e.g., SSD)?
No. Cooling measures are statutory levies applied uniformly. Once a property is sold within the SSD holding period, the duty is automatically calculated and due. There is no appeal mechanism, though you can seek professional tax advice if you believe your classification is incorrect. Early repayment of SSD (before expiry) is not available.
4. How do cooling measures affect HDB owners?
Cooling measures affect HDB owners primarily when upgrading (selling to buy private) or downgrading (selling private to buy HDB resale). HDB owners upgrading to private face ABSD. Private owners downgrading to HDB resale face a 15-month wait-out period and stricter MSR limits (30% vs. TDSR 55%). Cooling measures have also reduced HDB LTV to 75%, requiring larger down payments.
5. Do foreigners face the toughest measures?
Yes, unambiguously. Foreigners pay 60% ABSD (vs. 20% for SC 2nd property), and are excluded from some HDB categories altogether. The government’s policy framework explicitly prioritises owner-occupation for citizens and PRs over foreign investment. A foreigner buying a S$2M property pays S$1.2M in ABSD alone, making foreign residential investment significantly less attractive.
6. Will the government remove cooling measures if the market drops?
Possibly, but history suggests a “last in, first out” approach. When prices fell during COVID-19, cooling measures were retained (some were even tightened). The government views cooling measures as structural policy, not cyclical. However, if prices fell sharply and sustained (e.g., 15% decline year-on-year), measures like ABSD could be eased to stimulate demand. The government’s current stance (April 2026) is that stabilisation is preferable to rollback, unless emergency conditions warrant it.
This guide is for general information only and does not constitute legal, tax, or financial advice. Cooling measures are subject to change at any time by the relevant authorities (MAS, URA, IRAS, HDB). Interest rates, property values, and policy frameworks are subject to modification. Before entering into any property transaction, verify the current ABSD rates, SSD holding periods, LTV limits, TDSR/MSR thresholds, and any other applicable cooling measures with the Inland Revenue Authority of Singapore (IRAS), the Housing and Development Board (HDB), or the Monetary Authority of Singapore (MAS). Consult a licensed conveyancing lawyer and a qualified mortgage specialist or financial adviser to assess your personal circumstances and borrowing capacity. LovelyHomes.com.sg takes no responsibility for losses or liabilities arising from reliance on this article.