⚡ Key Numbers — URA Q2 2026 Private Residential PPI Flash Estimate
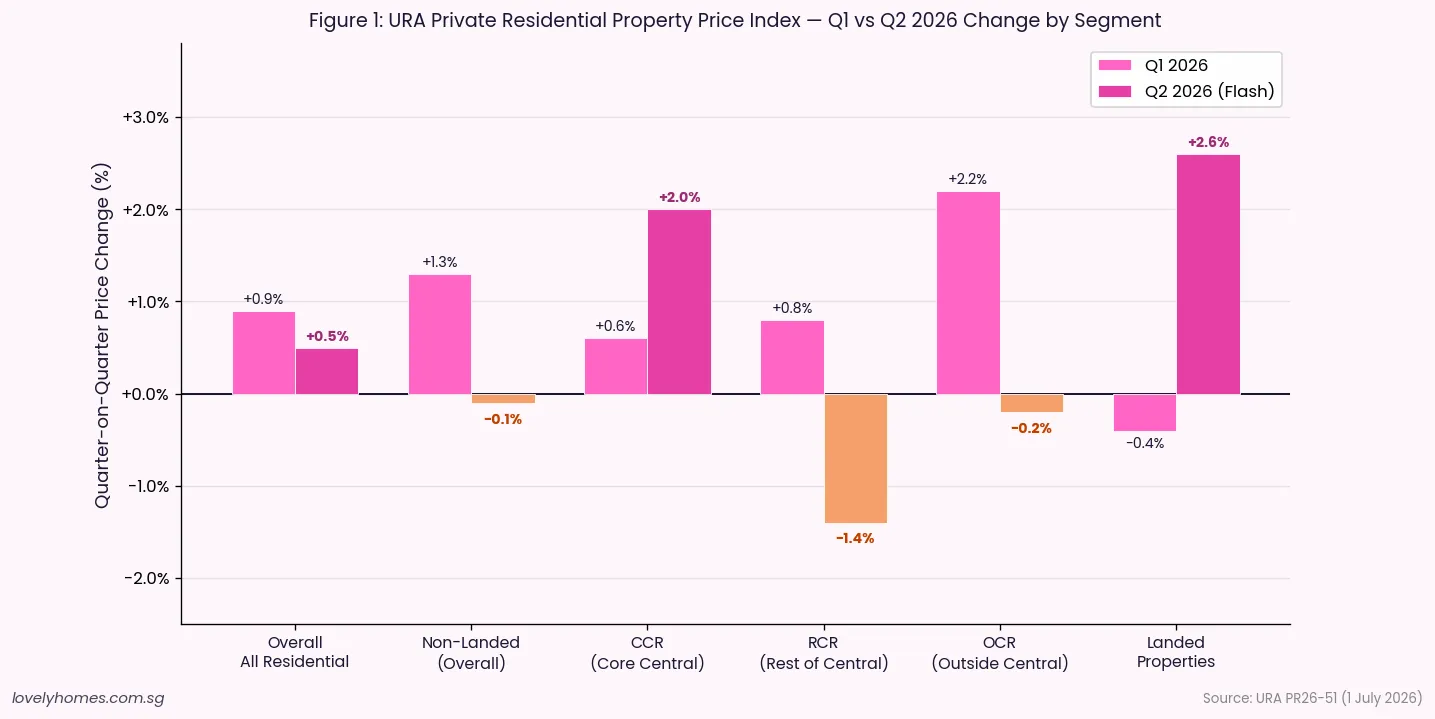
Overall PPI: +0.5% quarter-on-quarter in Q2 2026, decelerating from +0.9% in Q1 2026.
Non-landed properties (overall): –0.1% in Q2 (vs +1.3% in Q1) — a broad softening across the mass and mid-tier segments.
Core Central Region (CCR): +2.0% in Q2 (vs +0.6% in Q1) — the only non-landed segment to accelerate, driven by luxury demand.
Rest of Central Region (RCR): –1.4% in Q2 (vs +0.8% in Q1) — the weakest segment this quarter.
Outside Central Region (OCR): –0.2% in Q2 (vs +2.2% in Q1) — sharply slower after the strong new-launch-driven Q1 performance.
Landed properties: +2.6% in Q2 (vs –0.4% in Q1) — a notable reversal and the strongest segment in Q2.
Transaction volume: 5,420 units (up to mid-June 2026), broadly flat versus 5,413 in Q1.
Full Q2 statistics to be released by URA on 24 July 2026.
What the URA Flash Estimate Tells Us About Q2 2026
On 1 July 2026, the Urban Redevelopment Authority (URA) released the flash estimate of Singapore’s private residential property price index (PPI) for the second quarter of 2026. The headline figure — a 0.5% quarter-on-quarter increase — confirms a continuing but moderating upward trend in private home prices. The deceleration from Q1’s 0.9% gain reflects a more complex underlying picture: diverging fortunes between CCR luxury units and the mid-tier and mass-market segments, alongside a significant turnaround in landed property pricing.
Flash estimates are compiled from stamp duty submissions and developer sales data covering 1 April to mid-June 2026. URA notes that past estimates have differed from final figures and advises the public to interpret them with caution. The full Q2 dataset — including rental, vacancy and supply statistics — will be released on 24 July 2026.
Figure 1: URA Private Residential Property Price Index — quarter-on-quarter change by segment, Q1 vs Q2 2026. Source: URA Press Release PR26-51 (1 July 2026).
Segment-by-Segment Breakdown
CCR: Luxury Demand Re-Emerges
The Core Central Region posted the strongest non-landed performance in Q2 2026 at +2.0%, up from a modest +0.6% in Q1. The CCR comprises Districts 9, 10, 11 and the Downtown Core and Sentosa Cove — Singapore’s prime and ultra-prime residential markets. The acceleration reflects continued interest from overseas buyers (particularly those from Southeast Asia and Europe), ABSD-resilient demand at the upper end, and limited new launch supply in the CCR pipeline for the remainder of 2026. Several analysts had anticipated a softer CCR following the 60% ABSD rate for foreigners introduced in April 2023; instead, those who remain in the market appear to be purchasing at higher price points.
RCR: Sharpest Correction
The Rest of Central Region posted the weakest result at –1.4% after a +0.8% gain in Q1. The RCR — encompassing the city fringe and established residential neighbourhoods — had benefited strongly from new launch activity in 2024 and early 2025. With fewer significant launches pricing in during Q2 2026 and buyers digesting earlier purchases, the RCR has retreated modestly. This is not unusual: RCR prices tend to be more launch-driven and can oscillate more sharply quarter-to-quarter than the CCR or OCR.
OCR: Post-Launch-Boom Cooling
The Outside Central Region, which drove Singapore’s 2024–2025 private property rally on the back of strong new BTO and EC launches drawing first-timer upgraders, slipped 0.2% in Q2 after a 2.2% surge in Q1. The normalisation is expected — Q1’s exceptional OCR performance was partly attributable to a cluster of well-received project launches recording strong take-up in the Jan–Mar window. Q2’s mild correction suggests that pricing has reached a level where buyers are exercising greater selectivity.
Landed: The Standout Performer
Landed property — comprising detached houses, semi-detached homes and terraces — rebounded sharply to +2.6% in Q2, reversing a –0.4% dip in Q1. The landed market is structurally limited in supply (foreigners cannot purchase landed property without Singapore Land Authority approval, and government resale restrictions apply to certain categories) and tends to recover quickly from short-term softness. The Q2 bounce aligns with a pickup in transaction volumes observed in the Good Class Bungalow (GCB) and semi-detached segments in prime districts.
Supply Context: Record GLS Output in 2026
URA simultaneously highlighted the Government’s sustained GLS (Government Land Sales) programme as the key supply-side stabiliser. The 2H2026 Confirmed List adds 4,745 private residential units, bringing the full-year 2026 Confirmed List total to 9,320 units — more than 50% above the 10-year annual average. When combined with the Reserve List, the total GLS pipeline for 2026 is the largest in over a decade.
Metric
Value
Overall PPI change, Q2 2026
+0.5% q-o-q
Non-landed overall
–0.1% q-o-q
CCR (non-landed)
+2.0% q-o-q
RCR (non-landed)
–1.4% q-o-q
OCR (non-landed)
–0.2% q-o-q
Landed properties
+2.6% q-o-q
Sale volume (to mid-Jun 2026)
5,420 units
Q1 2026 volume (full quarter)
5,413 units
2H2026 GLS Confirmed List
4,745 units
Full-year 2026 Confirmed List
9,320 units (>50% above 10-yr avg)
Expected completions (next few years)
~61,000 units (incl. ECs)
Full Q2 statistics release
24 July 2026
What This Means for Buyers and Investors
📈 Analytical Note
The Q2 2026 flash estimate presents a nuanced picture rather than a simple upward or downward trend. The headline +0.5% masks significant divergence: CCR and landed properties are moving upward while the broader non-landed market (RCR, OCR) has softened or retreated modestly. For buyers, this suggests that bargaining power has returned somewhat in the mid-tier and mass-market segments, while CCR and prime landed command a premium and show no signs of price fatigue.
The record GLS supply pipeline — 61,000 units expected to complete over the next several years — is the most important structural factor for 2027 onwards. High supply typically dampens rental yields and constrains capital appreciation. Investors underwriting strong rental yield assumptions should pressure-test those models against the forthcoming supply wave.
MAS’s advisory to “exercise prudence” in the context of “highly uncertain macroeconomic outlook” is a consistent boilerplate, but the macro context in mid-2026 is genuinely uncertain: US tariff policy, global growth deceleration, and potential further geopolitical shocks could all affect Singapore’s export-dependent economy and, by extension, household income and property demand.
FAQ: URA Q2 2026 Flash Estimate
Why is the Q2 2026 flash estimate only partial data?
Flash estimates are compiled from stamp duty payment data submitted to IRAS and developer sales figures covering only the first two and a half months of the quarter (1 April to approximately mid-June). They do not include all transactions completed in June and cannot account for late-filed stamp duty submissions. URA releases full statistics, including rental, vacancy and pipeline data, at the end of July. The flash estimate is intended to give early market guidance, not a definitive picture.
What is driving CCR’s outperformance in Q2 2026?
CCR outperformance typically reflects foreign buyer demand, ultra-high-net-worth activity, and limited new supply in prime districts. Despite the 60% ABSD on foreign purchases introduced in April 2023, a residual pool of buyers for whom ABSD is not prohibitive — often high-net-worth individuals from Southeast Asia, India and Europe — continues to underpin CCR pricing. Domestic demand for CCR properties has also been relatively firm among Singapore Citizens and PRs trading up from large OCR condominiums.
Is the OCR correction a sign of a broader market downturn?
A –0.2% quarter-on-quarter movement is well within normal volatility for the OCR segment and does not signal a broad downturn. OCR prices tend to be more sensitive to the timing and reception of specific new launch projects; a quarter with fewer strong launches will naturally produce softer headline numbers. The underlying driver of OCR demand — the HDB upgrader pipeline, which remains robust given the volume of BTO completions expected in 2025–2027 — is structurally intact.
How does the GLS supply pipeline affect property prices?
High GLS supply expands the stock of private housing over a 3–5 year horizon as sites are tendered, developed and completed. More completions increase rental supply, which typically compresses rental yields, and adds to the inventory available for resale. Historically, URA has calibrated the GLS programme to balance supply and demand; a 9,320-unit Confirmed List in 2026 signals the government’s intent to sustain supply-side pressure on prices and rents. The full impact on capital values will depend on how quickly completions translate into market inventory and how strongly household formation and investment demand absorb the new supply.
When will the full Q2 2026 URA statistics be released?
URA has stated that the full set of real estate statistics for Q2 2026 will be released on 24 July 2026. The full release will include the definitive PPI (which may differ from the flash estimate), rental index, vacancy rates, pipeline supply and transaction volume by district and property type. LovelyHomes will publish a detailed analysis of the full Q2 2026 data upon release.
Disclaimer: This article is based on URA’s flash estimate press release PR26-51 dated 1 July 2026. Flash estimates are preliminary and may differ from final Q2 2026 statistics to be released on 24 July 2026. This article is for informational purposes only and does not constitute property, financial or investment advice. Readers should refer to official data at ura.gov.sg and consult a licensed property professional before making any purchase or investment decision.
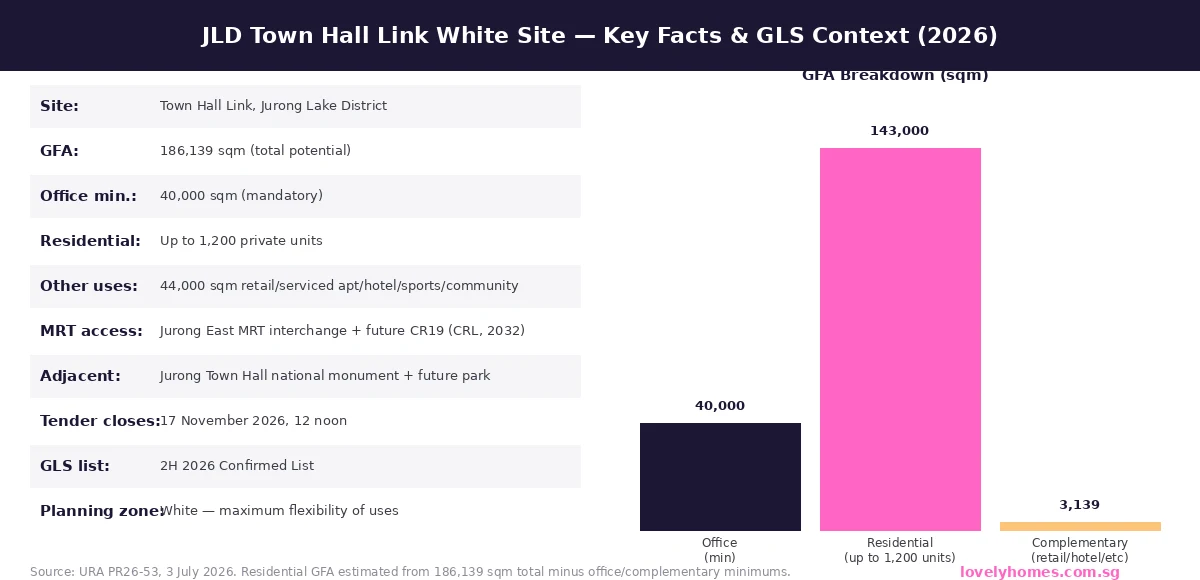
Singapore’s Jurong Lake District (JLD) took a significant leap forward on 3 July 2026 when the Urban Redevelopment Authority (URA) launched the tender for a major White site at Town Hall Link under the second-half 2026 Government Land Sales (GLS) Confirmed List. The site, adjacent to the Jurong Town Hall national monument and flanked by two MRT lines, is earmarked for up to 1,200 private residential units and a minimum of 40,000 sqm of office space within a total potential Gross Floor Area (GFA) of 186,139 sqm. It is the most significant new residential supply announcement for JLD in several years, and it reinforces the Government’s long-standing commitment to transforming the Jurong corridor into Singapore’s largest mixed-use business district outside the city centre.
Quick Answer — JLD White Site at a glance
What: URA has launched a GLS tender for a White site at Town Hall Link, Jurong Lake District.
Scale: 186,139 sqm total GFA — minimum 40,000 sqm office, up to 1,200 residential units, 44,000 sqm complementary uses.
MRT access: Direct connection to Jurong East MRT interchange (EWL + NSL + JRL) and the future CR19 Cross Island Line station (2032).
Context: Part of Singapore’s decentralisation strategy; JLD is targeted to become the largest mixed-use business node outside the CBD.
Tender close: 17 November 2026, 12 noon.
Property implication: First major new private residential supply in the JLD precinct for several years; expect strong developer interest and premium pricing on award.
What Is the JLD White Site and Why Does It Matter?
A White site in Singapore’s GLS framework is a land parcel where the developer is given significant flexibility in determining the mix of uses, subject to minimum requirements. At Town Hall Link, the developer must deliver at least 40,000 sqm of office space (non-negotiable) and may add up to 1,200 private residential units alongside 44,000 sqm of complementary commercial uses such as retail, serviced apartments, hotel, sports and recreational facilities, community spaces, medical clinics, or visitor attractions. The White classification is typically reserved for strategically significant sites where the Government wants the market to determine the optimal product mix — making this tender a test of developer confidence in the JLD vision.
The significance of this announcement extends well beyond the site itself. JLD has been a Government-backed transformational project for more than a decade, anchored by the relocation of Singapore’s second CBD away from the congested city core. The area has seen the revitalisation of the 90-hectare Jurong Lake Gardens, the completion of the Jurong Region Line (JRL), and plans for the Cross Island Line (CRL) station at CR19 in the heart of the precinct (targeted for opening in 2032). The Town Hall Link White site is “seamlessly connected” to the Jurong East MRT interchange via multi-level pedestrian linkages, according to URA.
Figure 1: JLD Town Hall Link White Site — Key Facts and GFA Breakdown (Source: URA PR26-53, 3 July 2026)
The JLD Vision: Decentralisation in Action
Singapore’s decentralisation strategy is a long-held urban planning objective. Concentrating economic activity exclusively in the Central Business District and Orchard Road corridor creates congestion, inflates commercial rents, and forces workers into lengthy commutes. JLD is the flagship expression of the alternative vision: a large-scale, self-sustaining regional centre in the west of Singapore, integrating employment, retail, housing, and recreational space in a single walkable precinct.
The Government has invested heavily in the infrastructure backbone. The Jurong Lake Gardens, opened in phases from 2019, provides 90 hectares of recreational greenery wrapping around Jurong Lake and the Chinese and Japanese Gardens. The JRL, opened in stages from 2026, connects the precinct to Tengah, Choa Chu Kang, and Boon Lay. The forthcoming CR19 station on the Cross Island Line will add a further orbital connection in 2032, making JLD one of the best-connected suburban nodes in Singapore’s rail network.
Complementing the White site, two major anchor projects are already under development nearby: the New Science Centre (relocating from its Jurong East home of four decades) and the Jurong Gateway Hub, an integrated development comprising a bus interchange, offices, shops, a library, a community club, and sports facilities. Together with the White site, these projects will define the physical character of the precinct for the next generation.
What the White Site Means for Property Buyers and Investors
Dimension
Detail
Property Implication
New supply
Up to 1,200 private residential units at Town Hall Link
First significant new private supply in the JLD precinct for several years; relieves latent demand from west Singapore buyers
Price premium
JLD White site is likely an RCR or OCR premium location; comparable JLD projects (J’den, Lake Grande) have traded at S$2,000–S$2,500 psf
Expect developer ask price in the S$2,200–S$2,800 psf range on new launch; potential for appreciation as JLD matures
MRT connectivity
Jurong East interchange (3 lines) + future CR19 (CRL, 2032)
Transport connectivity among the best in any non-central precinct; key demand driver for both owner-occupiers and investors
Tender timeline
Tender closes 17 November 2026; award ~January 2027; launch likely 2027–2028; TOP ~2032–2033
Buyers planning a JLD purchase should not expect keys before 2032; factor progressive payment schedule and interim housing into planning
Office anchor
Min. 40,000 sqm office must be delivered; targets MNC tenants and financial/professional services firms
Office anchor strengthens daytime population and amenity spending, supporting residential values in the precinct
Government commitment
New Science Centre, Jurong Gateway Hub, JRL, CRL CR19 all delivering 2026–2032
Infrastructure already committed; limited execution risk vs speculative master plans in other regions
JLD Property Market Context
The private residential market in the JLD corridor has been characterised by limited new supply in recent years. J’den (formerly JEM 2 / Jurong Point 2 site), launched in 2023, sold briskly at an average of approximately S$2,450 psf at launch, underscoring demand from west Singapore buyers seeking integrated development proximity. Older condominiums in the area (Lake Grande, Parc Westlake, Lakeville) have traded resale at lower psf levels but have appreciated meaningfully over their launch prices.
The White site at Town Hall Link is a different proposition: a larger, more prominent, and better-connected site adjacent to both heritage (Jurong Town Hall) and nature (the future park). Developers tendering for this site will need to deliver a mixed-use product integrating office, residential, and retail — a complex brief that typically appeals to the largest developers with integrated development track records. The 1,200-unit residential cap, while meaningful, represents a medium-density residential component within a predominantly commercial site.
For buyers tracking west Singapore property, the White site tender provides a clear signal: JLD is still an active, Government-supported investment in Singapore’s urban future. The tender award (expected early 2027) and any subsequent launch announcement will be significant market events for the west corridor.
What to Watch Next
The tender closes on 17 November 2026. Bids are expected from Singapore’s major developers, and possibly consortia given the scale and complexity of the White site requirements. The tender award will reveal the market’s view of JLD land value — a key data point for pricing expectations on the eventual new launch. Any premium bid above market expectations would signal high developer confidence in JLD residential absorption; a cautious single bidder would suggest more measured enthusiasm.
Separately, the full Q2 2026 URA private residential data release (expected ~24 July 2026) will include CCR, RCR, and OCR transaction data that contextualises JLD’s position in the wider market. The Q2 flash estimate showed overall prices up +0.5% with CCR leading — a context in which a well-connected, large-scale JLD development arriving in 2027–2028 could attract strong demand from both upgraders and investors seeking alternatives to pricier CCR addresses.
Frequently Asked Questions About the JLD White Site
What is a White site in Singapore’s GLS programme?
A White site is a land parcel sold by URA under the Government Land Sales programme where the developer has flexibility to incorporate a range of uses — residential, commercial, hotel, recreational, and community — subject to minimum requirements set by URA. The White classification is used for strategic locations where the Government wants the private market to determine the most commercially viable use mix, while ensuring a minimum anchor use (in this case, 40,000 sqm of office) is delivered to support the Government’s planning goals. White sites are typically larger and more complex than single-use residential or commercial sites, and they attract the largest and most financially capable developers.
When will the JLD White site residential units be available for purchase?
The tender closes on 17 November 2026. Following award (likely early 2027), the developer will typically spend 12–18 months on design, approvals, and construction preparation before launching for sale. A reasonable estimate for launch to the public is late 2027 to 2028. Construction of a mixed-use development of this scale typically takes 4–5 years, suggesting Temporary Occupation Permit (TOP) around 2032–2033 — which coincides with the opening of the CR19 Cross Island Line station in the heart of JLD. Buyers interested in this project should plan for a progressive payment schedule over this period and interim housing arrangements.
How does the JLD White site compare to other west Singapore property options?
The JLD White site will deliver a qualitatively different product from most west Singapore residential projects. Its direct connection to the Jurong East interchange (which currently serves the East-West Line, North-South Line, and Jurong Region Line) and the future CR19 station makes it exceptionally well-connected — comparable connectivity exists in only a handful of suburban locations in Singapore. The adjacent Jurong Town Hall national monument and future park provide irreplaceable location attributes. However, buyers should note that the residential component is capped at 1,200 units within a larger commercial development, meaning the residential element is not a standalone condominium but part of an integrated mixed-use project — similar to Duo Residences in Bugis or Marina One Residences at Marina Bay. Pricing will reflect this premium integrated product positioning.
Is Jurong Lake District a good area for property investment?
JLD has strong structural fundamentals as a long-term investment: committed Government infrastructure, rail connectivity improving through 2032, a large employment base (Jurong East, International Business Park, Biopolis in one-stop range), and a diversified demographic base. The risk factors are the long development timeline (appreciation is gradual rather than immediate), competition from other west corridor supply (Tengah, Bukit Batok, Jurong East BTO supply is meaningful), and execution risk on the commercial components of the mixed-use development. Industry analysts generally view JLD as a medium-term (5–10 year) capital appreciation story rather than a short-term trading position. The announcement of the White site tender strengthens the longer-term investment case. As with all property investments, buyers should assess their own holding capacity and financial position carefully before committing.
What is the Cross Island Line and why does it matter for JLD?
The Cross Island Line (CRL) is a new MRT line currently under construction by the Land Transport Authority. It will run across Singapore from Changi in the east to Jurong in the west, passing through several major nodes including Clementi, Jurong Lake District, and Ang Mo Kio. The CR19 station, located in the heart of JLD, is planned to open in 2032. When operational, CR19 will add a key orbital connection to the existing East-West Line and North-South Line services at Jurong East interchange, effectively giving JLD three distinct MRT lines through the precinct. This level of rail connectivity is rare outside the central area of Singapore, and it is a significant long-term demand driver for both commercial and residential property in JLD.
Disclaimer: This article is based on URA press release PR26-53 dated 3 July 2026 and publicly available Government data. Residential unit count, GFA figures, and MRT opening dates are as stated by URA and LTA and are subject to change. Price projections, investment analysis, and developer interest assessments represent editorial analysis only and do not constitute financial advice. Readers should conduct their own due diligence and consult licensed professionals before making any property purchase decision. For the authoritative site details, visit URA Land Sales. LovelyHomes does not provide financial or property advisory services.
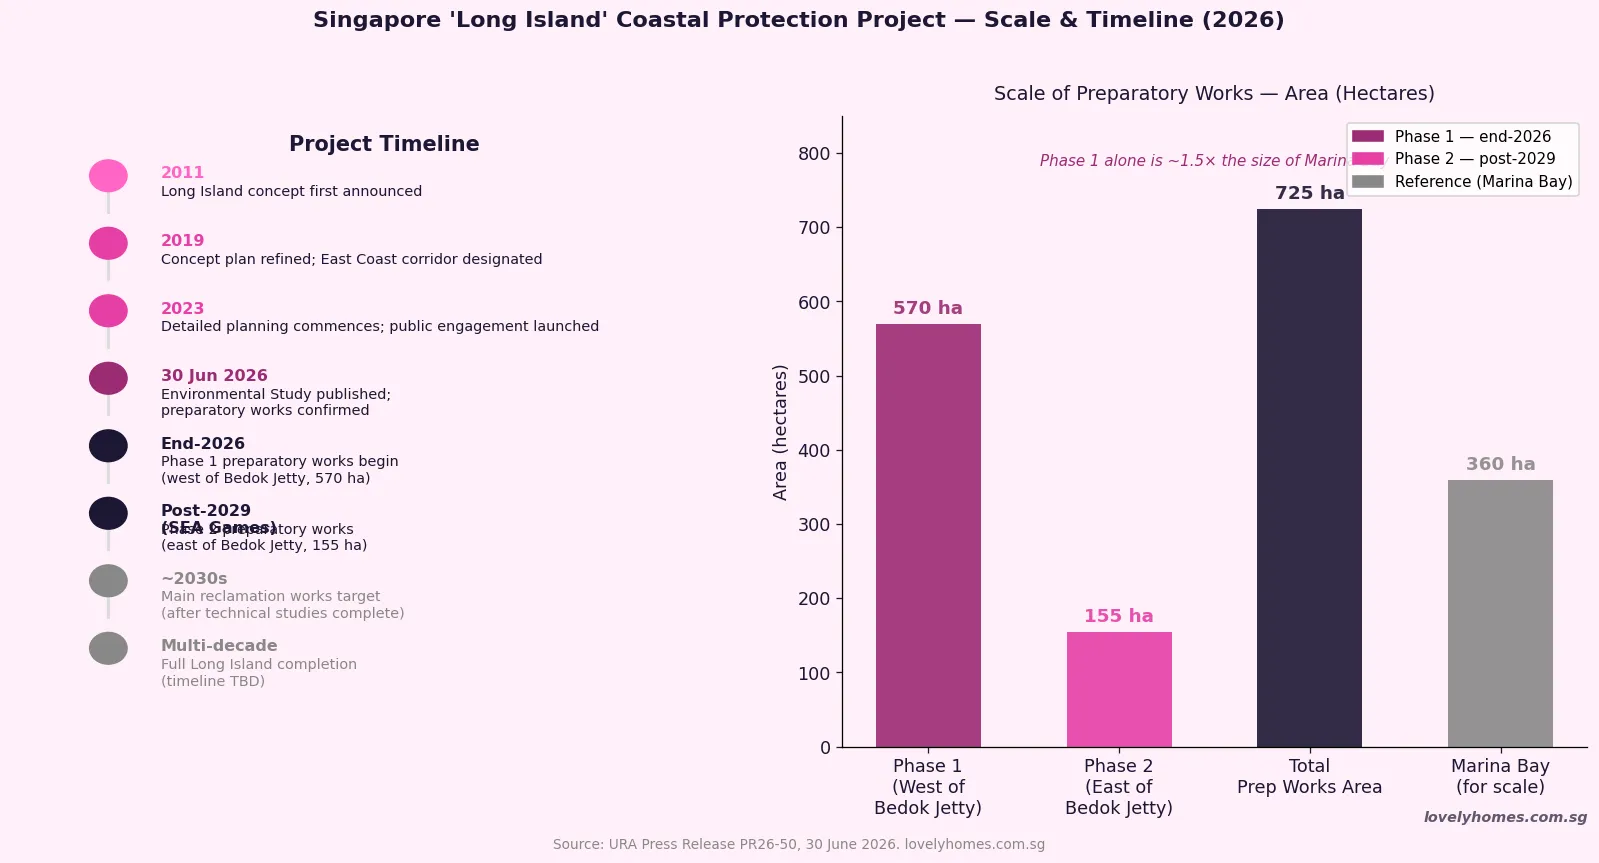
Singapore’s most ambitious infrastructure undertaking in a generation took a concrete step forward on 30 June 2026, when the Urban Redevelopment Authority (URA) and the Housing & Development Board (HDB) announced that preparatory works for ‘Long Island’ — the Government’s large-scale coastal protection strategy for the East Coast — will commence from end-2026. For property owners, investors, and anyone watching the long arc of Singapore’s planning, this announcement sets a firm starting gun on a project that will reshape the East Coast’s future land supply, flood resilience, and lifestyle amenities over the next several decades.
‘Long Island’ is not simply a reclamation project — it is Singapore’s primary response to the threat of rising sea levels to its low-lying East Coast. The Government has long signalled that without proactive intervention, the East Coast’s beaches, parks, and existing development would become increasingly vulnerable as global sea levels rise. Long Island will ultimately create a new landmass off the East Coast, incorporating a reservoir, an expanded coastal park, and mixed-use development land — but that is decades away. What changes now is that the ground work begins.
Quick Answer — Long Island: What You Need to Know
Preparatory works (seabed clearing, sand bunds, sand infilling) begin end-2026, in the waters west of Bedok Jetty.
Phase 1 covers approximately 570 hectares — roughly 1.5 times the size of Marina Bay — spanning about 7km east-to-west and up to 1km wide.
Phase 2 (east of Bedok Jetty, ~155 ha) begins only after the 2029 SEA Games.
Beaches and parks along East Coast Park remain fully open throughout the preparatory works; near-shore swimming and jogging/cycling paths are unaffected.
Main reclamation works will only begin after further technical studies and public engagement — likely the early 2030s at the earliest.
The completed Long Island will include a new reservoir, a larger coastal park, and new urban land — potentially adding thousands of residential and commercial units in the long term.
An Environmental Study published alongside the announcement found no significant water quality impact and only localised, short-term biodiversity effects from the preparatory works.
The public has until 28 July 2026 to submit feedback on the Environmental Study report at go.gov.sg/long-island.
What Are the Preparatory Works — and Why Now?
The preparatory works announced on 30 June 2026 are a precursor to the main reclamation. They involve three primary activities: removal of seabed obstructions (existing cables, pipelines, and debris), construction of temporary sand bunds (underwater embankments to contain the work area), and sand infilling to begin building up the seabed. These are engineering prerequisites — the seabed must be cleared and stabilised before full-scale reclamation can proceed.
The timing reflects two pressures. First, the Government has identified that sea level rise poses an increasingly urgent risk to the East Coast, and delaying the preparatory works extends the timeline for protection. Second, the 2029 SEA Games — to be hosted partly at East Coast Park — limits when Phase 2 can begin. By starting Phase 1 now and phasing Phase 2 to avoid disrupting the Games, the Government has threaded the needle between urgency and community impact.
The preparatory works will take place at least 130 metres from the shoreline and will be demarcated by silt screens and floating barriers. HDB, as the appointed reclamation agent, will monitor water quality, sediment levels, noise, and dust throughout.
Figure 1: Long Island project timeline from concept to preparatory works commencement, and scale of the Phase 1 and Phase 2 preparatory works areas relative to Marina Bay. Source: URA Press Release PR26-50, 30 June 2026.
Environmental Impact — What the Study Found
HDB commissioned an Environmental Study specifically for the preparatory works phase. The study’s key findings provide important context for how the works will affect the surrounding environment:
On water quality: no significant changes are expected. Water quality will continue to meet prevailing marine water quality criteria throughout the works. Silt screens will contain sediment plumes.
On marine biodiversity: there is up to minor impact on some coral and seagrass beds near the works site, with potential short-term and localised effects from sediment plumes. The majority of coral and seagrass in the vicinity — including Sisters’ Islands Marine Park — are assessed to be largely unaffected. This will reassure the nature community, which had concerns about the proximity of Phase 1 to some of the East Coast’s more ecologically sensitive zones.
On sea sports: kiteboarding will be the most affected activity, with moderate displacement from the reduced sea space. Other sea sport users face minor to moderate impact. Agencies have committed to working with affected sea sport users to find alternative sites for the interim period.
The Environmental Study report is open for public feedback for four weeks from 30 June 2026. An Environmental Monitoring and Management Plan (EMMP) will be put in place to manage environmental conditions throughout the works.
What This Means for East Coast Property
Long Island will be one of the most significant drivers of East Coast property values over the coming decade — but it is a slow-burn catalyst rather than an immediate price mover. Here is the framework LovelyHomes uses to think about the property implications:
Short term (2026–2030): Neutral to slightly negative. The preparatory works bring marine vessels, sand infilling activity, and restricted sea space off the East Coast. Buyers considering East Coast properties — particularly those with sea-facing units or sea-sports lifestyle utility — should factor in construction-adjacent disruption. This is unlikely to cause price falls (East Coast fundamentals remain strong), but it may dampen the marginal premium that sea-view units command during this period.
Medium term (2030s): Watch for planning signals. When the detailed reclamation plans are released — expected after the technical studies are completed in the early 2030s — the market will get clarity on the eventual land profile, the new waterfront layout, the reservoir location, and potential residential zones. This is when the property market will begin to price in the Long Island uplift meaningfully. Marine Parade, Bedok, and Siglap properties in particular may benefit from the signal that the East Coast will gain a significant new green and waterfront amenity.
Long term (2040s and beyond): Transformative. If Long Island proceeds as currently envisaged — a new coastal park, a freshwater reservoir, and new urban land — it represents the creation of entirely new prime East Coast real estate. The precedent is Bishan, which was built on former agricultural land and is now one of Singapore’s most sought-after mature estates. Long Island’s eventual waterfront development could command premium valuations similar to the Marina Bay waterfront, which today represents some of Singapore’s highest residential and commercial values.
Long Island in Context — Singapore’s Coastal Planning History
This is not the first time Singapore has reclaimed land to address long-term needs. Marina Bay itself was reclaimed over several decades — the land that now hosts Marina Bay Sands, the financial district, and Gardens by the Bay was once open sea. Jurong Island was created by amalgamating seven smaller islands for petrochemical use. Changi Airport’s runways sit on reclaimed land. What is different about Long Island is its explicit dual purpose: it is simultaneously a climate adaptation measure (coastal protection) and a land creation exercise — and it is being planned with unusually extensive public engagement, reflecting a more consultative planning era.
The Government’s message is clear: Long Island is going ahead, and it will be built in a way that is sensitive to the environment, the existing East Coast community, and the interests of future residents. For property investors, that certainty has real value — it means the East Coast’s long-term trajectory is upward.
Summary — Long Island Key Facts
Item
Detail
Lead agencies
URA (planning), HDB (reclamation agent)
Purpose
Coastal protection from sea level rise; new land supply
Phase 1 start
End-2026, west of Bedok Jetty
Phase 1 area
~570 ha (7km long × up to 1km wide)
Phase 2 start
After 2029 SEA Games, east of Bedok Jetty
Phase 2 area
~155 ha
Main reclamation start
TBD — after technical studies (early 2030s est.)
Beach/park access
Fully maintained throughout works
Feedback period
4 weeks from 30 June 2026 (closes ~28 July 2026)
Frequently Asked Questions
Will Long Island be built for housing? When will new homes be available?
The Government has said Long Island will include new urban land — but has not yet confirmed the mix of residential, commercial, industrial, or recreational uses. Given the project timeline, any new housing on Long Island is at least 20–30 years away. The more immediate property implication is the uplift to existing East Coast properties as the project progresses and its final scope becomes clear. The Government’s track record — Marina Bay, Bidadari — suggests Long Island’s eventual homes will be well-planned and high-quality, but buyers looking for a near-term supply injection from this project will be disappointed.
Does the Long Island announcement affect East Coast Park access?
No. URA and HDB have explicitly confirmed that beaches, jogging and cycling paths, and near-shore swimming areas along East Coast Park will remain open and accessible throughout the preparatory works. Works are at least 130 metres from the shoreline. The main restriction is on certain sea sports users — particularly kiteboarding — who will need to use alternative sea space during the Phase 1 period. East Coast Park itself, as a recreational asset, is unaffected.
Will the preparatory works affect sea views from East Coast condominiums?
In the near term, marine vessels, sand bunds, and floating barriers will be visible from East Coast properties with sea views — particularly during active infilling operations. However, these are temporary structures for the preparatory phase. The visual impact during preparatory works is expected to be significant from units with direct sea views but modest from properties further back. The more important long-term consideration is that once Long Island is reclaimed, those “sea view” units may have their sightlines altered permanently — a factor that discerning buyers of high-floor sea-facing East Coast units should factor into their purchase decision today.
How does this compare to Singapore’s previous reclamation projects?
Long Island is comparable in scale to the Tuas reclamation (which expanded Singapore’s western coast for industrial use) and the Changi East reclamation (which expanded Changi Airport). In terms of residential property impact, the closest precedent is Marina Bay — which transformed from open sea to the city’s premier commercial and residential address. Long Island’s combination of climate resilience purpose and mixed-use development potential makes it perhaps the most strategically significant reclamation in Singapore since Marina Bay, with a potentially larger impact on the East Coast residential market than any single policy change in recent memory.
Where can I read the full Environmental Study and submit feedback?
The Environmental Study report for the preparatory works is available at go.gov.sg/long-island. The public feedback period runs for four weeks from 30 June 2026, closing approximately 28 July 2026. Feedback can be submitted via the portal at that link. URA and HDB have committed to evaluating feedback thoroughly and incorporating suitable suggestions before finalising the mitigation measures for the preparatory works.
This article is an editorial analysis produced by LovelyHomes based on URA Press Release PR26-50 (30 June 2026) and publicly available government planning documents. All timelines, area figures, and project details are drawn from official URA and HDB sources. Property market analysis represents LovelyHomes’ editorial view and does not constitute investment advice. Readers should conduct their own due diligence and consult a licensed property professional before making any purchase decision. For official information about the Long Island project, visit go.gov.sg/long-island.
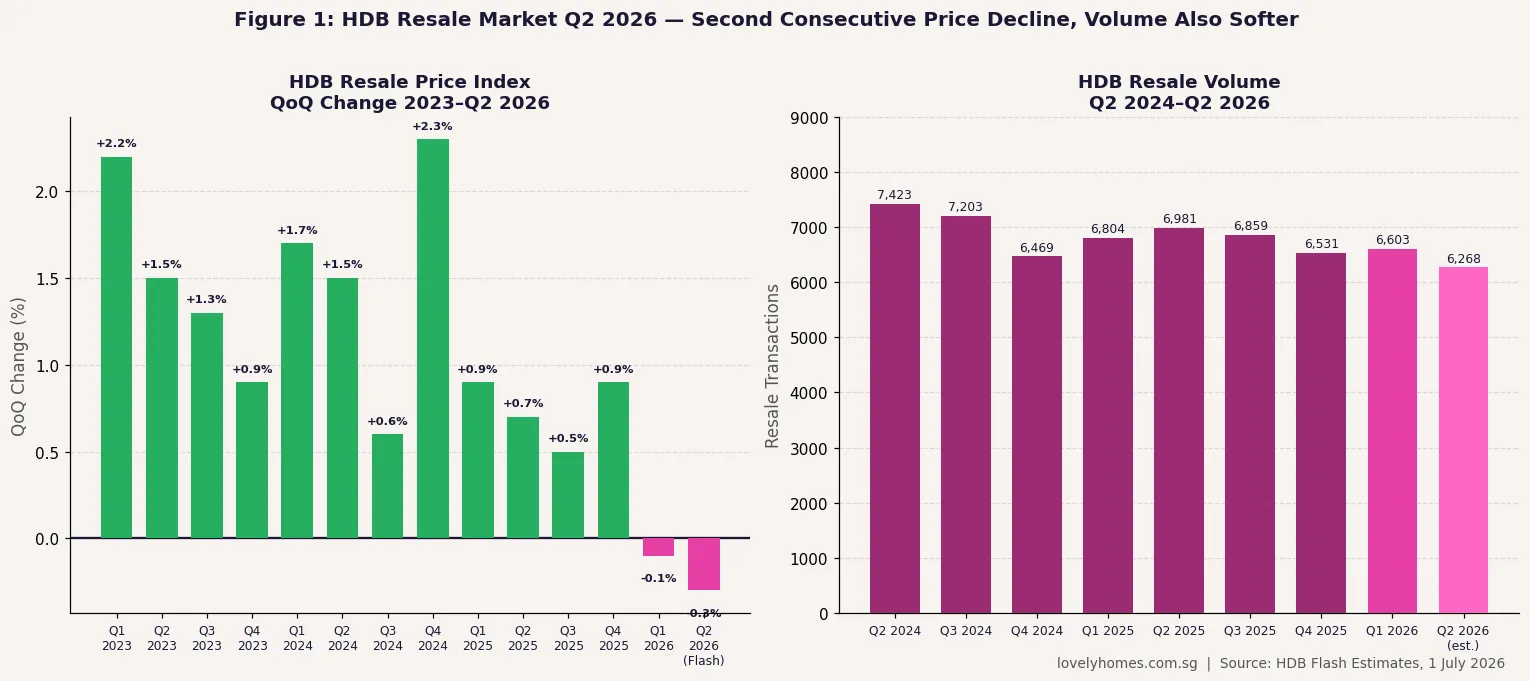
The HDB Resale Price Index (RPI) fell 0.3% in Q2 2026 (flash estimate, 1 July 2026), following a 0.1% decline in Q1 2026.
This marks the first back-to-back quarterly RPI decline since early 2019 — a meaningful shift after a 12-quarter streak of price growth from mid-2020.
Estimated transactions: ~6,268 in Q2 2026 (as at 29 June 2026), down about 10.2% versus Q2 2025’s 6,981 transactions.
The full Q2 data from HDB — including town-level breakdowns and flat-type analysis — is expected by 23 July 2026.
Meanwhile, private residential prices rose 0.5% in Q2 2026 (URA flash estimate), a divergence between public and private markets.
The October 2026 BTO exercise (~8,000 flats, 7 projects) and a growing private pipeline should continue to moderate resale demand in 2H 2026.
HDB Resale Prices Fall for a Second Consecutive Quarter in Q2 2026
The Housing & Development Board released its Q2 2026 flash estimate on 1 July 2026, showing the Resale Price Index (RPI) declined 0.3% quarter-on-quarter — deepening the 0.1% dip recorded in Q1 2026. The two consecutive quarterly declines are the first since early 2019, ending a remarkable run of price growth that had seen the RPI climb more than 30% from its 2020 post-pandemic lows.
The data point comes on the same day as URA’s Q2 2026 private residential flash estimate, which showed a more modest picture: private home prices rising 0.5%, with gains concentrated in the Core Central Region (+2.0%) and landed segment (+2.6%), while the Rest of Central Region (-1.4%) and Outside Central Region (-0.2%) softened. The divergence between the two markets — private prices edging up while HDB resale prices retreat — is a notable feature of Singapore’s mid-2026 property landscape.
Figure 1: (Left) HDB Resale Price Index QoQ change, Q1 2023 to Q2 2026. Two consecutive declines in Q1 and Q2 2026 mark the first back-to-back quarterly retreat since early 2019. (Right) Estimated resale transaction volume, Q2 2024 to Q2 2026 — Q2 2026 volume (~6,268) is the softest in the chart window. Source: HDB Flash Estimates, 1 July 2026.
Why Are HDB Resale Prices Softening?
Several structural forces are bearing down on HDB resale demand in mid-2026. First, the sheer volume of BTO supply entering the market is creating competition at the margins. HDB launched approximately 19,600 BTO flats across 2026, with the October exercise alone adding close to 8,000 units across seven projects — including two projects at Bayshore (Prime classification, 2,500 units combined), Caldecott (Prime, 1,430 units), and Yishun Chencharu (Standard, 1,580 units). Buyers who might previously have turned to the resale market for faster access to housing in desired towns now have BTO options that, while involving a wait of several years, offer meaningful subsidies.
Second, resale volume has been declining. An estimated 6,268 transactions in Q2 2026 represents a drop of approximately 10.2% compared to 6,981 in Q2 2025. Fewer transactions mean fewer comparable sales pushing prices higher — the resale market is losing the self-reinforcing momentum it enjoyed during 2021–2024.
Third, the cooling measures introduced in 2022–2023 — the 15-month wait-out period for private property owners wanting to buy HDB resale flats, tightened income ceilings under the HFE framework, and the introduction of Plus and Prime classifications — have added friction for demand that was previously unconstrained. The Ethnic Integration Policy (EIP) also continues to block transactions in certain blocks, narrowing the effective buyer pool in popular mature estates.
What the Divergence Between Private and HDB Prices Means
The contrast between private (+0.5%) and HDB resale (-0.3%) prices in Q2 2026 reflects different demand profiles. Private residential demand in Singapore is increasingly driven by upgraders, high-net-worth individuals, and (at the CCR end) wealthy foreigners paying the 60% ABSD — a buyer cohort that is relatively insensitive to BTO supply. HDB resale demand, by contrast, comes principally from first-timers who cannot get a BTO (due to ballot failure, income ceiling, or timing), second-timers who have completed their MOP and want a larger resale flat before upgrading, and PRs who have been resident long enough to qualify. This segment is more directly substitutable with BTO supply.
The CCR’s 2.0% private price gain in Q2 2026 also reflects some flight-to-quality within the private market — buyers who can afford CCR are moving upstream as OCR and RCR sentiment softens. This bifurcation is a characteristic of a market entering a more discerning phase after broad-based appreciation.
Context: Is This a Correction or a Reset?
A 0.3% quarterly decline does not in isolation constitute a correction — it represents a modest pullback after an extended run-up. The HDB RPI reached its cycle high in Q4 2025 or Q1 2026 (the full data will clarify the exact peak). From cycle trough in Q2 2019 to approximate peak in Q4 2025, the RPI gained roughly 30%+ over six years. A mild two-quarter retreat is, from a long-term perspective, a normalisation.
Industry figures suggest the retreat is orderly rather than distressed. Median resale flat prices remain close to or at multi-year highs on an absolute basis — it is the rate of growth that has reversed, not a broad-based collapse. The Bidadari estate’s record S$945,000 resale transaction (a 3-room flat at 118A Alkaff Crescent in June 2026, as reported by LovelyHomes) shows that premium locations can still command record prices even as the broader index softens.
What to Watch in 2H 2026
The full Q2 2026 HDB statistics (expected 23 July 2026) will provide the town-level and flat-type breakdown that the flash estimate lacks. Market participants will be looking at whether the price softening is concentrated in particular flat types (5-room and executive flats, which saw the sharpest run-up) or distributed across the board. The MOP unlock pipeline — the volume of BTO flats reaching their 5-year MOP in 2026 — is also a factor: a large cohort of flats from 2019–2021 BTO launches reaching MOP simultaneously could add resale supply.
With the October BTO exercise applications opening in September 2026 (HFE deadline 15 September 2026), buyer attention is likely to shift toward the BTO market in 3Q 2026, further dampening resale activity near term. The 2H 2026 private pipeline includes several significant new launches — any softening in developer sales could, through the upgrader channel, reduce demand for HDB resale from MOP-cleared flat owners looking to cash out for a private upgrade.
Frequently Asked Questions
Does the -0.3% RPI mean my flat is worth less than last quarter?
At a market level, yes — the flash estimate indicates that the average resale flat transacted in Q2 2026 sold at prices approximately 0.3% lower than the average in Q1 2026. However, individual flat values depend on estate, block, floor, flat condition, and proximity to amenities. A Bidadari flat in a sought-after block may still have appreciated even as the overall index dipped. The RPI is a market-level index, not a valuation of your specific flat. For an accurate current valuation, engage an HDB-registered salesperson for a Comparative Market Analysis or use HDB’s official transaction data portal.
Why are private prices rising while HDB resale prices fall?
The two markets have different demand drivers. Private residential demand in Singapore is partly sustained by high-income upgraders, global wealth, and CCR buyers who are relatively insulated from BTO supply effects. HDB resale demand, by contrast, is more directly substitutable with BTO supply — buyers who want an HDB flat can increasingly choose a new BTO over a resale flat, especially with the expanded supply in 2026. The 15-month wait-out period also constrains one source of HDB resale demand (private property sellers downsizing). The result is diverging price trends.
Should I wait to buy an HDB resale flat if prices are declining?
Market timing in housing is notoriously difficult, and the decision to buy an HDB resale flat should primarily be driven by your housing needs, financial readiness, and family circumstances — not by short-term RPI movements. A 0.3% quarterly decline is small relative to the transaction costs of delaying a purchase (rental costs, stamp duties). That said, if you are financially able to wait and are flexible on timing, the 2H 2026 market may offer a wider selection at steady or modestly lower prices given the pipeline of October BTO and new private launches drawing attention away from resale. Always work with a qualified professional and check your HFE letter status before making any commitment.
When will the full Q2 2026 HDB data be released?
HDB typically releases the full quarterly resale statistics approximately three weeks after the flash estimate — so the full Q2 2026 data (with flat-type and town-level breakdowns, median transaction prices, and complete volume figures) is expected around 23 July 2026. LovelyHomes will publish an in-depth analysis when the full data is available. The full URA Q2 2026 private residential statistics are also expected on 25 July 2026.
Is this the start of a bigger HDB resale price correction?
Based on Q2 2026 flash data alone, it is premature to call a structural correction. Two consecutive quarters of mild declines (−0.1% and −0.3%) are consistent with a soft landing rather than a downturn. The HDB government remains committed to ensuring an adequate supply of BTO flats and has levers — including BTO supply pacing and eligibility criteria — to manage the market. Historical context is useful: the last significant HDB resale correction (2013–2019) saw the RPI decline approximately 13% over six years, driven by a deliberate policy supply surge. The current situation — a mild two-quarter pullback within a broadly healthy economy — does not yet suggest a repeat of that trajectory.
The data in this article is drawn from HDB and URA flash estimates released on 1 July 2026. Flash estimates are preliminary and subject to revision when the full quarterly statistics are published. Transaction volume figures (as at 29 June 2026) are unaudited estimates. This article is not financial or investment advice. For current HDB resale data, visit hdb.gov.sg. For URA private residential data, visit ura.gov.sg.
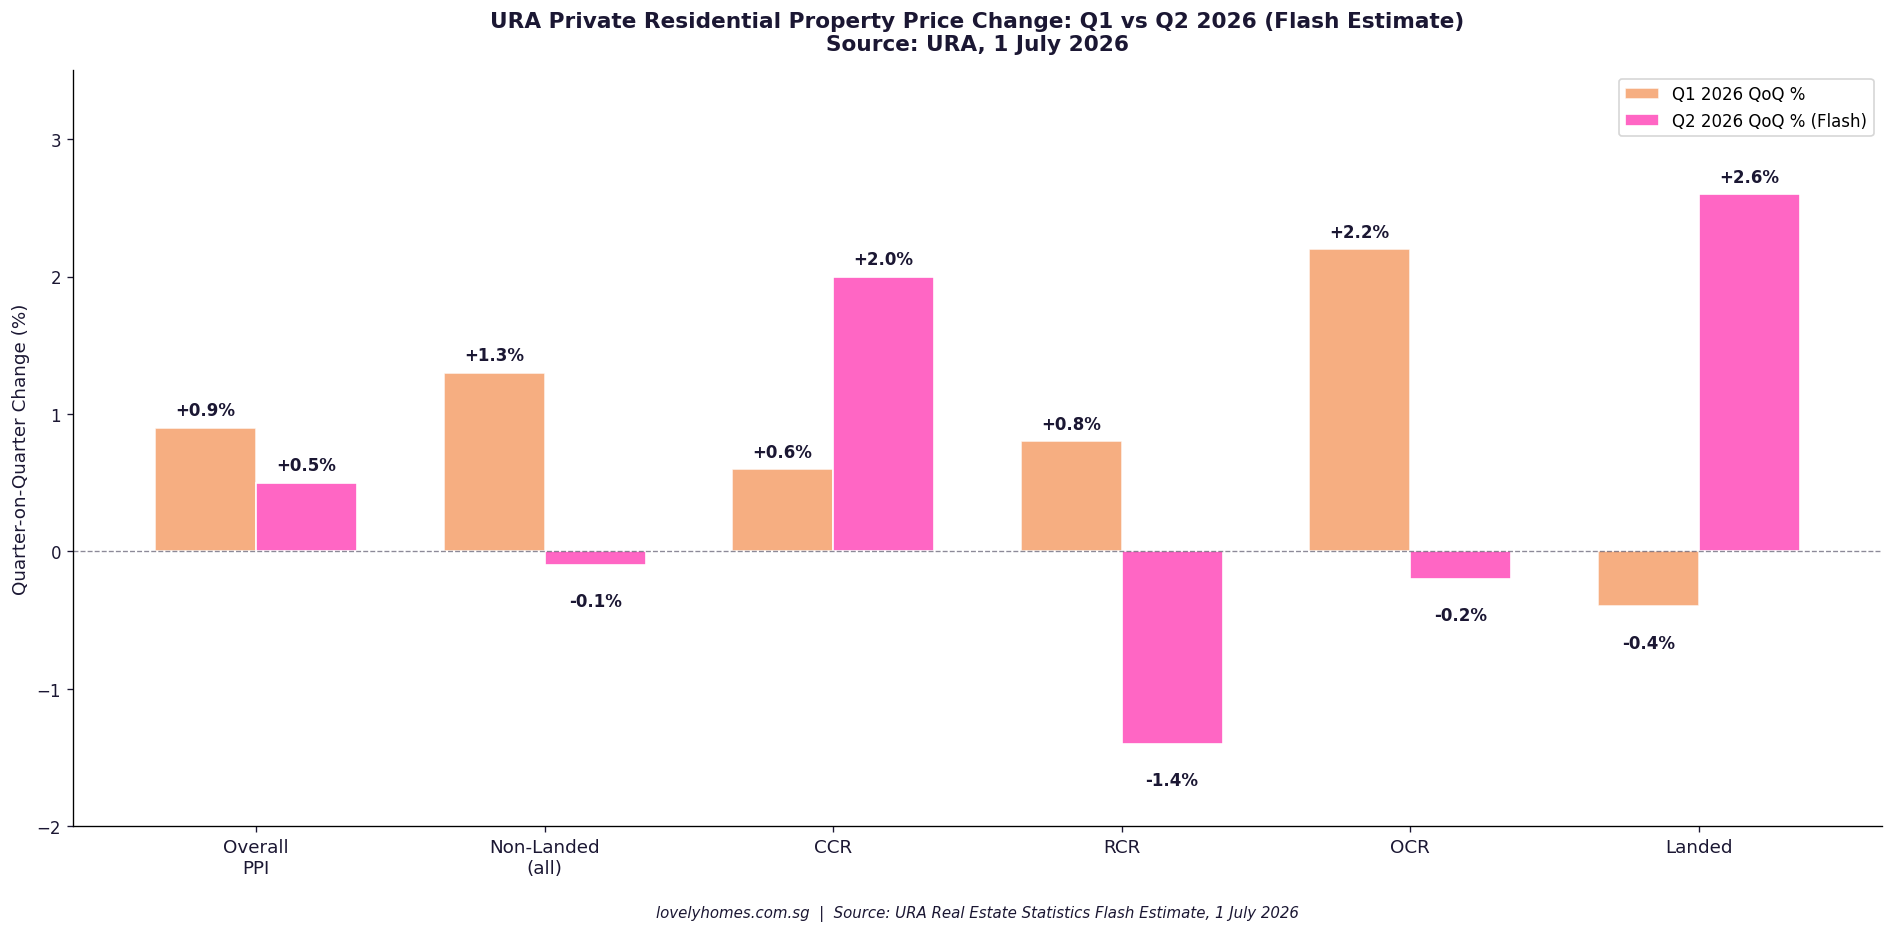
The Urban Redevelopment Authority (URA) released the flash estimate for the private residential property price index for 2nd Quarter 2026 on 1 July 2026. The headline number — a +0.5% quarter-on-quarter (QoQ) increase — represents a notable deceleration from the +0.9% recorded in Q1 2026, and is driven by diverging performances across market segments: the Core Central Region (CCR) surging, while the Rest of Central Region (RCR) and the Outside Central Region (OCR) softened on a quarterly basis.
Quick Answer — Key Numbers
Overall PPI: +0.5% QoQ in Q2 2026 (vs +0.9% in Q1 2026).
Non-landed (overall): -0.1% QoQ (vs +1.3% in Q1 2026).
Core Central Region (CCR): +2.0% QoQ — the strongest performing segment.
Rest of Central Region (RCR): -1.4% QoQ — the weakest performing segment.
Outside Central Region (OCR): -0.2% QoQ (vs +2.2% in Q1 2026).
Landed properties: +2.6% QoQ — a sharp reversal from -0.4% in Q1 2026.
Transaction volume: 5,420 units (up to mid-June 2026) — broadly comparable to 5,413 in Q1 2026.
Full-year 2026 GLS Confirmed List: 9,320 units — over 50% above the 10-year annual average.
Full Q2 2026 real estate statistics are due from URA on 24 July 2026.
The Q2 2026 Flash Estimate in Context
Flash estimates are preliminary figures compiled by URA based on stamp duty data and developer sales data from 1 April 2026 to mid-June 2026. They are inherently incomplete — the final figures released on 24 July 2026 will incorporate the full quarter’s transactions and typically differ by a modest margin from the flash estimate. URA cautions that “the public is advised to interpret the flash estimates with caution.”
With that caveat noted, the Q2 2026 flash estimate signals a meaningful shift in the composition of price growth. After a broad-based Q1 2026 rally — where OCR non-landed prices surged +2.2% and the overall index rose +0.9% — Q2 2026 shows the market rotating: luxury and landed properties strengthened, while mass-market and mid-tier segments gave back some of Q1’s gains.
Segment-by-Segment Analysis
Figure 1: Quarter-on-quarter price change by market segment — Q1 2026 actual vs Q2 2026 flash estimate. Source: URA Real Estate Statistics Flash Estimate, 1 July 2026.
Core Central Region (CCR) — +2.0% QoQ: The prime districts (Districts 1–4 and 9–11) outperformed all other segments in Q2 2026. The CCR had been relatively subdued in Q1 2026 (+0.6% QoQ) as the 60% ABSD for foreigners continued to dampen overseas buyer interest. The Q2 2026 rebound suggests domestic high-net-worth and upgrader demand — supported by declining SORA rates from their 2023–2024 peaks — is reasserting itself. The CCR also benefits from limited new supply relative to other segments. This is consistent with the observed trend of luxury landed and GCB (Good Class Bungalow) transactions picking up in the first half of 2026.
Rest of Central Region (RCR) — -1.4% QoQ: The RCR — covering areas such as Toa Payoh, Bishan, Tiong Bahru, and Queenstown — recorded the sharpest quarterly decline. This is likely a partial correction after strong new launch activity in prior quarters pushed RCR prices higher. As developers digested existing inventory and new launch momentum slowed, transacted prices softened. The RCR remains well above its Q1 2025 levels on a year-on-year basis.
Outside Central Region (OCR) — -0.2% QoQ: The OCR, which includes suburban regions such as Jurong, Tampines, Sengkang, and Punggol, saw a modest dip after its strong Q1 2026 performance (+2.2% QoQ). This retreat is consistent with the broader pattern of HDB upgrader demand normalising as the pool of HDB households completing the five-year MOP works through the system. Developer sales volumes in the OCR remained healthy, but headline prices moderated.
Landed properties — +2.6% QoQ: Landed homes (terraced houses, semi-detached, bungalows, and Good Class Bungalows) posted the strongest quarterly gain and reversed the -0.4% QoQ decline recorded in Q1 2026. Landed supply is structurally limited — only Singapore Citizens can purchase most landed property — and demand from citizens seeking generational family homes has remained firm. The combination of limited new landed supply, declining mortgage rates, and resilient household wealth among long-tenured Singapore Citizens supported this rebound.
Segment
Q1 2026 QoQ
Q2 2026 QoQ (Flash)
Key Driver
Overall PPI
+0.9%
+0.5%
Deceleration; landed and CCR offset OCR/RCR softening
Sale transaction volume in Q2 2026 stood at approximately 5,420 units (up to mid-June 2026), compared to 5,413 in Q1 2026. URA describes this as “broadly comparable,” indicating that buyer activity has not meaningfully contracted despite the overall price deceleration. This stable transaction count, combined with decelerating prices, is consistent with a market that is finding equilibrium rather than declining.
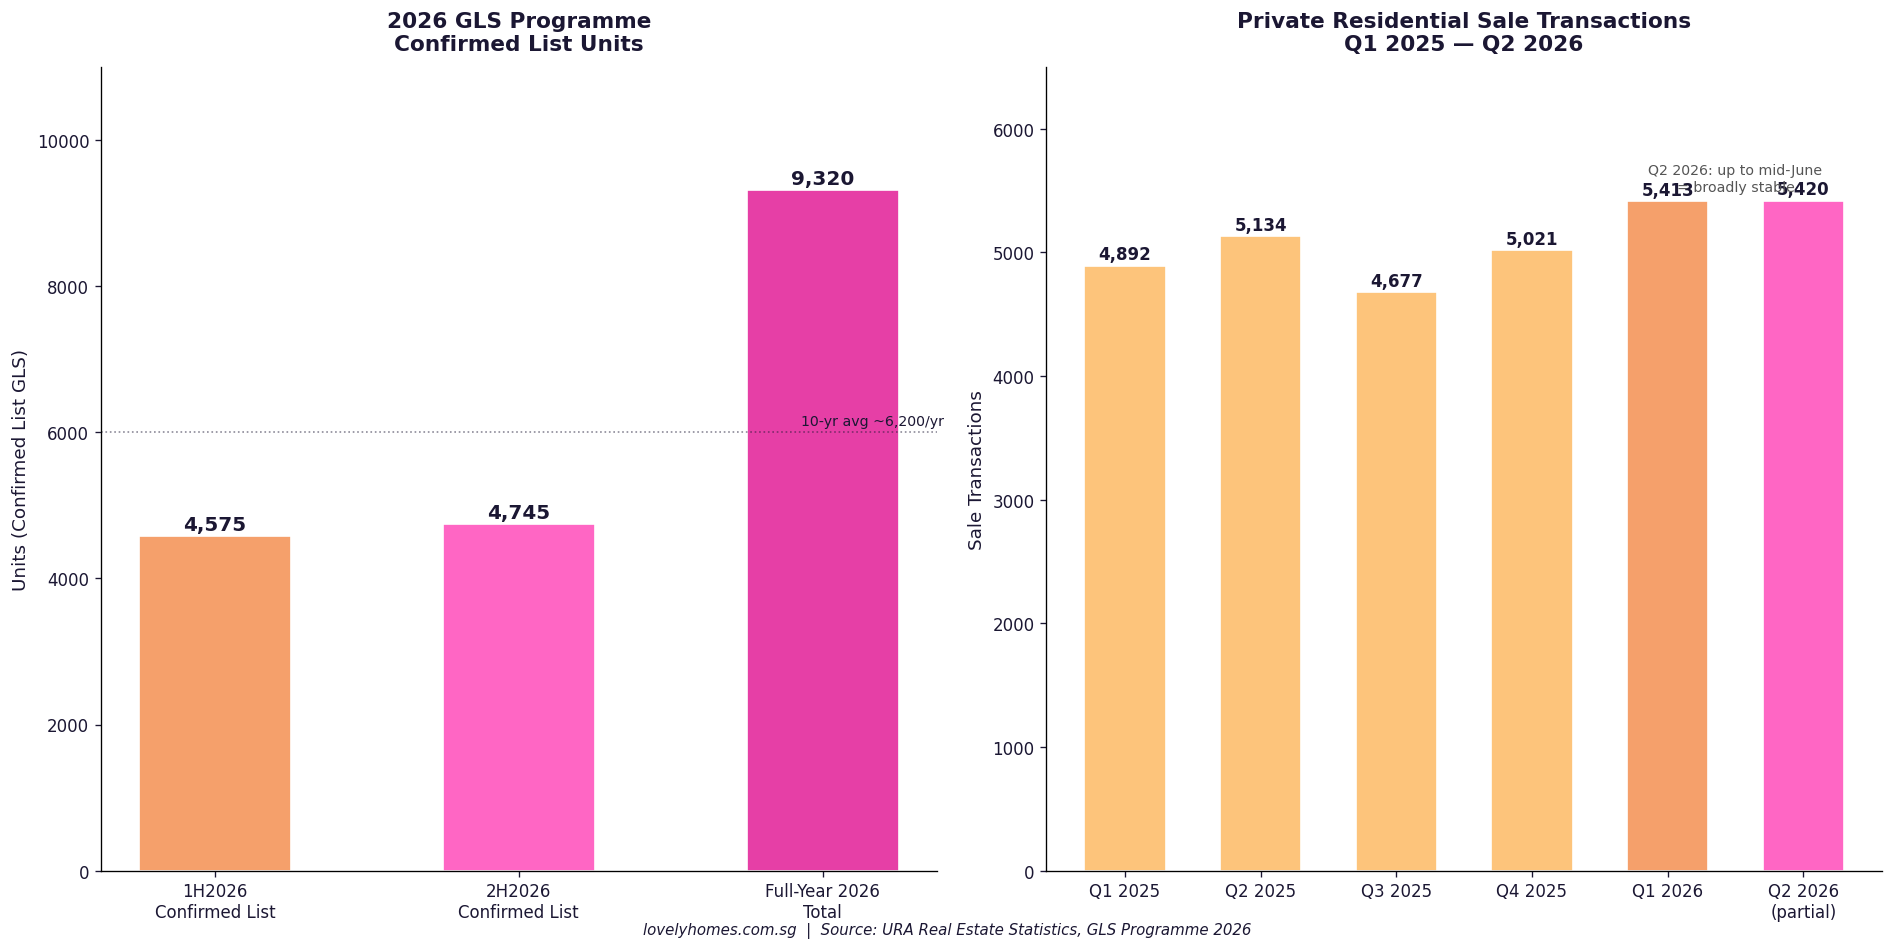
Supply Pipeline: Government Accelerating Delivery
Figure 2: Left — 2026 GLS Confirmed List units by half-year. Right — quarterly private residential sale transaction volume Q1 2025 to Q2 2026 (partial). Source: URA Real Estate Statistics; GLS Programme announcements 2026.
The government is maintaining a deliberate high supply stance. In 2H2026, a further 4,745 private residential units will be launched under the Confirmed List, bringing the full-year 2026 Confirmed List total to 9,320 units — over 50% higher than the past 10-year annual average of approximately 6,200 units per year. Including Executive Condominiums, approximately 61,000 private residential units are expected to be completed over the coming years, a significant pipeline that URA believes will ensure housing demand is met and price stability is maintained.
This supply commitment is a significant policy signal. It suggests the government does not intend to ease supply constraints even as price growth moderates, reinforcing the view that the cooling measures and ABSD framework are working as intended — slowing speculation without triggering price declines.
What This Means for Buyers, Sellers, and Investors
For buyers, the Q2 2026 data offers a nuanced picture. The mass market (OCR) and mid-tier (RCR) segments are showing mild softening — suggesting that patient buyers may find slightly better negotiating conditions in these segments than they did in Q1 2026. The CCR and landed markets, however, are moving in the opposite direction: buyers in these segments should not expect discounts. The high supply pipeline is a medium-term comfort: completions over the next few years should provide genuine choice and prevent runaway price inflation. However, the pipeline has not yet translated into meaningful price softening, suggesting underlying demand remains robust.
For sellers, the Q2 data does not indicate a price collapse. Year-on-year growth remains positive across all segments, and the overall PPI is still trending upward, albeit modestly. Sellers in well-positioned OCR and RCR projects who have held for several years remain in a strong position. The SSD framework (12%/8%/4%/NIL for years 1–4) means that sellers who purchased in 2024 or later face significant exit costs if selling within the SSD window.
For investors, the data reinforces the divergence between segments. CCR and landed are the standout performers in Q2 2026. The 60% foreigner ABSD remains a barrier for non-resident investors, but for Singapore Citizens with the means to invest in CCR or landed property, Q2 2026 shows meaningful appreciation. For OCR investors, the combination of high supply, modest price growth, and stable rental yields suggests a more measured outlook for capital appreciation over the near term.
What Might Come Next: Full Q2 Data on 24 July 2026
The flash estimate is compiled on approximately 75% of the full quarter’s transactions. The final figures, due 24 July 2026, will incorporate the complete Q2 2026 transaction set and may revise the initial numbers upward or downward. Historically, flash-to-final revisions for the Singapore private residential PPI have been small (typically within 0.2–0.4 percentage points). Analysts and market participants will also be watching for the detailed breakdown by property type, floor area, and specific district — context that flash estimates do not provide.
Beyond the Q3 2026 data, the key macro variables are: MAS exchange rate management and global trade uncertainty (the July 2026 economic environment remains “highly uncertain” per URA’s own framing), Federal Reserve policy direction, the HDB resale market trajectory (which feeds upgrader demand for OCR private condos), and developer launch volumes in 2H2026. The 2H2026 GLS Confirmed List launches, if absorbed at decent pricing, will provide a fresh read on developer confidence and buyer appetite going into 2027.
Frequently Asked Questions
What is the URA Private Residential Property Price Index (PPI)?
The URA PPI is a quarterly index compiled by the Urban Redevelopment Authority tracking changes in private residential property prices in Singapore. It covers all non-landed private residential transactions (apartments and condominiums) across the CCR, RCR, and OCR, as well as landed residential properties (terraced houses, semi-detached, bungalows). The index uses a hedonic regression methodology to control for changes in the quality mix of transactions, so a change in the PPI reflects a genuine price change rather than a change in the type of units sold. The full methodology is available on the URA website.
Why did CCR outperform while RCR and OCR declined in Q2 2026?
The divergence reflects two distinct demand drivers. CCR demand is primarily driven by domestic high-net-worth buyers, ultra-high-net-worth families, and some foreign buyers (despite the 60% ABSD). This cohort is less interest-rate sensitive and more influenced by portfolio diversification and lifestyle considerations. The CCR has also had limited new supply recently. RCR and OCR demand, by contrast, is driven more by the upgrader segment — HDB families completing their MOP and seeking private homes. This segment is more price-sensitive, and after a strong Q1 2026 driven by several new launch openings, some cooling was natural as those launches digested inventory.
Does the +0.5% QoQ increase mean property prices are still rising?
On a quarter-on-quarter basis, yes — the overall index still increased by 0.5% in Q2 2026. The PPI has not declined. Year-on-year growth (Q2 2025 vs Q2 2026) will be clearer when the full Q2 2025 data is confirmed as the base. The deceleration from +0.9% in Q1 2026 to +0.5% in Q2 2026 is meaningful but not alarming in the context of Singapore’s historical property cycle. As context: the index fell sharply in 2022 after cooling measures were introduced, and the recovery from 2023 onward has been gradual and measured.
What impact does the 9,320-unit GLS pipeline have on prices?
Supply additions work with a lag — land sold today typically enters the market as completed units two to four years later. The 9,320-unit 2026 GLS Confirmed List, together with the broader 61,000-unit pipeline of completions expected over the coming years, should exert a moderating influence on prices over the medium term. However, if economic conditions remain supportive and demand is sustained, large supply additions may simply be absorbed without sharp price declines. Singapore’s housing demand is underpinned by population growth, household formation, and the continued desire for private homeownership among its relatively affluent resident population.
When will the full Q2 2026 real estate statistics be released?
URA will release the full set of Q2 2026 real estate statistics, including the finalised PPI, rental index, number of units in the pipeline, and detailed transaction data by district and property type, on 24 July 2026. This release will also cover the private rental market, development pipeline, and unsold inventory. LovelyHomes will update this article and publish additional analysis once the full data is available.
Disclaimer: This article is produced for general informational and editorial commentary purposes only and does not constitute financial, investment, or property advice. Property market statistics, index values, and GLS programme details are sourced from URA’s official releases. Flash estimates are preliminary and subject to revision on 24 July 2026. LovelyHomes is not responsible for investment decisions made on the basis of this commentary. Always consult licensed financial advisers and CEA-registered property salespersons before making property purchase or investment decisions. Primary source: URA press release, 1 July 2026.
HFE letter deadline: Submit all supporting documents to HDB by 15 September 2026 to ensure your HDB Flat Eligibility (HFE) letter is ready for the October sales exercise.
Estimated 4-room prices: Standard (Yishun/Tengah) ~S$360K–S$400K; Plus (Geylang) ~S$500K–S$540K; Prime (Bedok/Toa Payoh) ~S$500K–S$555K.
MOP: 5 years for Standard; 10 years for Plus and Prime classifications.
Subsidy clawback: Plus and Prime flats are subject to a subsidy clawback on resale, calculated as a percentage of the resale price or value.
Hottest picks: Toa Payoh Caldecott (only Prime project; next to Caldecott MRT interchange); Bedok Bayshore (waterfront precinct; near East Coast Park).
Overview: Singapore’s Final BTO Launch of 2026
The October 2026 Build-To-Order (BTO) exercise is the final sales launch of the year and one of the largest in recent memory, with the Housing and Development Board (HDB) offering approximately 7,970 flats across seven projects in six towns. The October exercise completes the government’s 2026 BTO calendar, which has collectively offered around 19,600 new flats — matching HDB’s earlier public commitment to sustain high supply to moderate resale prices and address first-timer demand.
The exercise is notable for the geographic spread of its projects: it spans the sought-after east (Bedok’s new Bayshore waterfront precinct), the central region (Toa Payoh’s Caldecott precinct), an inner-city mixed area (Geylang’s Mattar neighbourhood near the Downtown Line), and the established growth corridors of Yishun and Tengah. For first-timer applicants who missed earlier launches, this is a high-stakes application exercise with a meaningful mix of price points and location quality.
Figure 1: All 7 projects in the HDB BTO October 2026 exercise — location, classification, flat types, unit count, nearest MRT station and indicative 4-room prices. Prices are pre-launch market estimates and will be confirmed only when HDB releases official pricing during the sales exercise.
Project-by-Project Analysis
Bedok — Bayshore I & II Prime
The two Bedok Bayshore projects together supply 2,500 flats (1,640 and 860 units respectively) in the new Bayshore housing estate along Bayshore Drive, adjacent to East Coast Park. Both are served by Bayshore MRT station on the Thomson-East Coast Line (TEL), which provides direct access to the CBD via Marina Bay. The Bayshore precinct is a purpose-built waterfront residential neighbourhood — the first HDB estate developed in this part of Singapore — and the BTO flats sit alongside private condominiums and commercial amenities in a mixed-use environment.
Both projects carry Prime classification under HDB’s 2023 flat classification framework, meaning buyers are subject to a ten-year Minimum Occupation Period (MOP) and a subsidy clawback on resale. Flat types span 2-room Flexi, 3-room, and 4-room, with no 5-room units offered — reflecting the Prime classification’s intent to maximise accessibility for first-timers rather than offer larger investment-grade units. Indicative 4-room pricing is estimated at approximately S$500,000–S$520,000.
Toa Payoh — Caldecott Prime
The Toa Payoh Caldecott project is expected to be the single most competitive project in October 2026. With 1,430 units — comprising around 590 two-room Flexi flats, 580 four-room flats, and a tranche of public rental units — it occupies land immediately adjacent to Caldecott MRT station, the interchange between the Circle Line (CCL) and the Downtown Line (DTL). This provides unparalleled MRT connectivity in a mature estate known for its proximity to Bishan, Ang Mo Kio, and Novena.
Caldecott is the only Pure Prime project in this exercise. Indicative 4-room prices are estimated to start from approximately S$550,000, reflecting the mature estate premium and the exceptional MRT interchange location. The ten-year MOP and subsidy clawback apply. Ballot competition is expected to be intense — the June 2026 Queenstown Prime project saw approximately 8× first-timer ballot rates for 4-room units, and Caldecott may approach similar demand.
Geylang — Mattar Plus
The Geylang Mattar project offers approximately 440 flats near Mattar MRT station on the Downtown Line (DTL3), within walking distance of MacPherson and the MacPherson estate. Geylang carries Plus classification — a ten-year MOP and subsidy clawback — reflecting its central location and good MRT connectivity without meeting the full Prime threshold. Flat types are expected to be 2-room Flexi and 4-room, with indicative 4-room pricing around S$500,000–S$540,000. The Geylang Mattar neighbourhood is undergoing gradual upgrading, and the BTO project sits in an area with established hawker centres, schools, and neighbourhood commercial facilities.
Yishun — Chencharu Standard
The Yishun Chencharu project is the largest single project in the October 2026 exercise at 1,580 units. Flat types run the full range — 390 two-room Flexi, 80 three-room, 460 four-room, and 650 five-room units — making it the most options-rich project for buyers seeking larger flat types at Standard pricing. Chencharu is the fifth BTO project launched in this new Yishun sub-precinct, which HDB is systematically building out on the former Chencharu estate lands near Khatib MRT station. Standard classification means a five-year MOP and no subsidy clawback. Indicative 4-room prices are estimated around S$360,000–S$400,000 — among the most affordable in this exercise.
Tengah — Garden Avenue Standard
Tengah Garden Avenue continues the ongoing build-out of Tengah New Town, the first car-lite eco-town in Singapore’s western corridor. The project is expected to offer approximately 620 units with 3-room, 4-room, and 5-room flat types. Tengah’s future MRT stations on the Jurong Regional Line (JRL) are under construction; the nearest current public transport option is bus connectivity to Bukit Gombak and Bukit Batok MRT stations. Standard classification applies; indicative 4-room prices are approximately S$360,000–S$380,000. Tengah’s car-free town centre design and green corridors are a lifestyle draw for buyers who prioritise environment over MRT proximity.
Sembawang — North Standard
The Sembawang North project adds approximately 400 units in the northern growth corridor, near Canberra MRT on the North-South Line. Flat types are expected to include 2-room Flexi, 3-room, 4-room, and 5-room options. Standard classification; indicative 4-room prices around S$320,000–S$360,000 — the most affordable in this exercise. Sembawang has seen a consistent stream of BTO launches in recent years as HDB continues to develop the Sembawang New Town precinct. The area is served by Canberra Plaza (opened 2020), Sembawang Shopping Centre, and a growing number of amenities. Bus connectivity is the primary mode of access to the town centre from the BTO site.
Figure 2: Left — Indicative 4-room BTO prices by town and classification. Right — Unit count by project. Prime projects (Bedok, Toa Payoh) are expected to command the highest ballot rates. Prices are indicative pre-launch estimates; actual prices will be confirmed by HDB at launch.
BTO Flat Classification — Standard, Plus and Prime in October 2026
The October 2026 exercise marks the third full year under HDB’s revised flat classification framework (Standard / Plus / Prime), which replaced the former Open Market / Prime Location Housing (PLH) and Mature / Non-Mature estate designations. The classification is determined by HDB based on locational advantage, transport connectivity, and proximity to the city centre:
Feature
Standard
Plus
Prime
MOP
5 years
10 years
10 years
Subsidy clawback on resale
None
Yes (% of resale price)
Yes (higher % of resale price)
Private property ownership during MOP
Not allowed
Not allowed
Not allowed
Eligible buyers
Usual HDB eligibility
Only first-timers (for 95% of units at launch)
Only first-timers (for 95% of units at launch)
Rental during MOP
With HDB approval after 3 yrs (rooms only)
Not allowed during MOP
Not allowed during MOP
October 2026 projects
Yishun, Tengah, Sembawang
Geylang Mattar
Bedok Bayshore, Toa Payoh Caldecott
A critical implication of Plus and Prime classification is the subsidy clawback: when you resell a Plus or Prime flat after the ten-year MOP, HDB recovers a percentage of the gross resale price. This amount is not refunded to you — it is recovered by HDB as a repayment of the additional subsidy embedded in the below-market launch price. For buyers who plan to sell their flat after MOP to unlock equity, the subsidy clawback meaningfully reduces net sale proceeds.
Grants — What First-Timers Can Receive in October 2026
First-timer Singapore Citizen households applying for BTO flats may be eligible for the following CPF housing grants:
Grant
Maximum Amount
Eligibility
Income Ceiling
Enhanced CPF Housing Grant (EHG)
S$80,000 (couple); S$40,000 (single)
First-timer SC couple or single; buying new or resale HDB
S$9,000/mth (couple); S$4,500/mth (single)
CPF Housing Grant — BTO
S$40,000 (SC couple); S$20,000 (single)
First-timer buying directly from HDB (BTO, SBF)
S$14,000/mth
Step-Up CPF Housing Grant
S$25,000
Second-timer moving from 2-room to larger BTO in non-mature/Standard estate
S$7,000/mth
Proximity Housing Grant (Resale only)
S$30,000 (couple); S$20,000 (single)
Buying resale HDB within 4km of parents; does not apply to BTO
Not applicable for BTO
For a qualifying SC first-timer couple with household income below S$9,000 per month, the maximum combined BTO grant (EHG + CPF Housing Grant) is S$120,000. This means a Yishun Standard 4-room BTO estimated at S$380,000 could effectively cost as little as S$260,000 after grants — making it among the most subsidised home-ownership options available in 2026.
Figure 3: Maximum CPF housing grant amounts by buyer profile and grant type for the October 2026 BTO exercise. SC couples (both first-timers) are eligible for the highest total grant quantum of up to S$120,000 for BTO. Grants are means-tested against average household income over the 12 months preceding application.
How to Apply — Key Steps and Dates
The October 2026 BTO application process follows the standard HDB BTO application procedure:
1. Obtain a valid HDB Flat Eligibility (HFE) Letter. An HFE letter confirms your eligibility to buy an HDB flat, the loan amount you qualify for, and the grants you may receive. HFE letters are valid for six months. HDB recommends applying for the HFE letter early — submit all required documents by 15 September 2026 to ensure your letter is processed before the October application window opens. Apply via the HDB Flat Portal at homes.hdb.gov.sg.
2. Select your project and flat type. When the October 2026 sales exercise opens (HDB will announce the exact application window), log into the HDB Flat Portal, browse available projects, and submit your application for one project and flat type.
3. Ballot and queue number. HDB conducts a computer ballot. First-timer SC applicants receive priority balloting status (two ballot chances before being deemed a second-timer). Your queue number determines the order in which you book a flat. A lower queue number (closer to 1) means you have first pick of available units within your shortlisted flat type.
4. Flat selection and signing of Agreement for Lease (AFL). When called for flat selection, you choose a specific unit, pay the option fee (typically S$2,000), and subsequently sign the Agreement for Lease and pay the down payment (5% of flat price from cash/CPF, plus stamp duty).
5. Keys collection. BTO construction timelines typically run 3–5 years. For most projects in non-mature towns (Yishun, Tengah, Sembawang), expected completion is 2029–2031. For Prime projects in mature areas, timelines may be shorter given higher development priority, though HDB has not yet released official completion estimates for the October 2026 projects.
Worked Example: The Wong Family Apply for Yishun Chencharu 4-Room
Scenario
Mr and Mrs Wong, both Singapore Citizens aged 28, are first-time home buyers. Combined gross monthly income: S$7,500/mth. Both are applying for the Yishun Chencharu 4-room BTO in October 2026.
Grant eligibility:
EHG (S$7,500/mth income → proportionate to income): approximately S$50,000
CPF Housing Grant (BTO, SC couple): S$40,000
Total grants: S$90,000
Estimated 4-room flat price: S$380,000
Effective price after grants: S$380,000 − S$90,000 = S$290,000
HDB Loan (90% LTV on post-grant price, subject to MSR):
Maximum HDB loan: 80% of flat price = S$304,000 (before grants reduce the price quantum; HDB loan is on flat price, grants reduce initial outlay)
Monthly instalment at HDB loan rate 2.6% p.a., 25 years on ~S$290,000: approximately S$1,320/mth
MSR check: S$1,320 / S$7,500 = 17.6% — well within the 30% MSR cap — PASS
Cash outlay at sign of AFL: approximately S$3,200 (option fee S$2,000 + legal S$1,200)
Estimated waiting time: approximately 3.5–4 years; expected keys collection 2030–2031.
For this couple, the Yishun BTO is an exceptionally affordable path to home ownership — the effective post-grant cost of S$290,000 for a new 4-room flat in a growth precinct compares favourably to current HDB resale 4-room prices in Yishun (~S$420,000–S$490,000).
What Might Come Next — BTO Supply and Policy Outlook
The October 2026 exercise completes the government’s publicly stated 19,600-flat target for 2026. For 2027, HDB is expected to announce the BTO supply target in January — industry observers anticipate a maintained high supply of 18,000–22,000 units given continued strong first-timer demand. The government has signalled that BTO supply will remain elevated until the HFE application-to-first-timer-receipt wait time is consistently below four years for most non-Prime projects.
The longer-term supply story for October 2026 buyers is positive: Bedok Bayshore (TEL fully operational 2025), Toa Payoh Caldecott (Caldecott interchange operational), and Yishun Chencharu (fifth project in a maturing precinct) will all benefit from continued infrastructure investment and precinct maturation during the waiting period. Tengah buyers face a longer MRT wait — the Jurong Regional Line stations serving Tengah are not expected to open until 2028–2029 — but the car-free town centre design and cycling-focused layout are increasingly valued by younger buyers.
Summary: October 2026 BTO At-a-Glance
Town
Project
Class
Units
MOP
Est. 4-Room
MRT
Bedok
Bayshore I
Prime
1,640
10 yrs
~S$510K
Bayshore (TEL)
Bedok
Bayshore II
Prime
860
10 yrs
~S$510K
Bayshore (TEL)
Toa Payoh
Caldecott
Prime
1,430
10 yrs
~S$555K
Caldecott (CCL+DTL)
Geylang
Mattar
Plus
~440
10 yrs
~S$520K
Mattar (DTL)
Yishun
Chencharu
Standard
1,580
5 yrs
~S$380K
Near Khatib (NSL)
Tengah
Garden Avenue
Standard
~620
5 yrs
~S$370K
Future JRL
Sembawang
North
Standard
~400
5 yrs
~S$340K
Canberra (NSL)
Total
~7,970
HFE deadline: 15 September 2026
Frequently Asked Questions
What is the difference between Prime, Plus and Standard BTO flats in October 2026?
The classification reflects the locational advantage of each project and determines the restrictions placed on the flat. Prime flats (Bedok Bayshore, Toa Payoh Caldecott) carry a ten-year MOP, a subsidy clawback on resale, and a restriction on renting out the whole flat or any room during the MOP period. Plus flats (Geylang Mattar) have the same ten-year MOP and clawback, but the subsidy is calibrated as less than Prime. Standard flats (Yishun, Tengah, Sembawang) have a five-year MOP and no subsidy clawback — they behave like traditional BTO flats and can be resold on the open market at prevailing prices after the MOP. If you are buying primarily as a home rather than as an investment, the classification matters mainly for your lifestyle flexibility during MOP. If you intend to sell after five to seven years, Standard is strongly preferable.
Can I apply if I currently own a private property?
No. HDB BTO eligibility requires that you do not own a private residential property (in Singapore or overseas) at the time of application, and that you have not disposed of any private property within 30 months before the HDB flat application date. If you or your co-applicant own or recently sold a private property, you are ineligible to apply for a BTO flat. This 30-month wait-out period also applies if your private property is held through a company or other entities where you hold a significant interest. Check your eligibility carefully via the HDB Flat Eligibility portal before submitting an application.
What happens if my ballot number is beyond the available units — can I try again for free?
Yes. If you applied as a first-timer and your ballot number is beyond the available units (or you did not receive any ballot chance), you are considered to have made an unsuccessful attempt. Your first-timer priority status is not used up by simply not receiving a queue number low enough to select a flat. You retain your first-timer priority ballot chips for future exercises. However, if you receive a queue number and are called for flat selection but decline to select a flat, you lose one ballot chip and may be deemed a non-first-timer for subsequent exercises. HDB provides two priority ballot attempts for first-timer SC households before reclassifying them as second-timers.
Can Singapore Permanent Residents (SPRs) apply for October 2026 BTO flats?
SPRs cannot apply for BTO flats as the sole applicant or as two SPR co-applicants. However, a SPR can co-apply as a joint applicant with a Singapore Citizen spouse or family member under the Public Scheme or Fiance/Fiancee Scheme. In that case, the SC-SPR household is eligible to apply for Standard and Plus classification BTO flats but may not apply for Prime classification flats (which are restricted to SC households only at launch). The SC-SPR household also qualifies for a reduced set of CPF grants — for example, the CPF Housing Grant for BTO is capped at S$20,000 (rather than S$40,000 for SC-SC couples), and EHG applies at the SC first-timer level for the SC co-applicant only.
How is the EHG (Enhanced CPF Housing Grant) calculated — is it always S$80,000?
The EHG is means-tested. The maximum of S$80,000 (for SC couples) is only available to households with an average gross monthly income of S$1,500 or less. As income rises, the EHG tapers down in steps. At S$4,500/mth the EHG for a couple is approximately S$50,000; at S$6,000/mth it is approximately S$30,000; at S$9,000/mth (the income ceiling) it is S$5,000. Income is assessed as the average gross monthly household income over the 12 months preceding the flat application, including variable components such as overtime, commissions, and bonuses. Check the official HDB EHG calculator at hdb.gov.sg for your specific income band.
Can I buy a BTO flat on a single income if I am not applying as a single?
Yes, but your borrowing capacity and grant eligibility are assessed on the household’s combined income. If you are applying as a couple (Public Scheme or Fiance/Fiancee Scheme) but only one person is currently working, HDB assesses your income ceiling based on the working person’s income alone for grant purposes, but the MSR (Mortgage Servicing Ratio) of 30% is applied to the working person’s gross monthly income for loan affordability. At an income of S$4,000/mth, MSR 30% allows a monthly HDB loan repayment of up to S$1,200, which at 2.6% over 25 years supports a loan of approximately S$268,000. Combined with grants, this can comfortably support a 4-room BTO in a Standard estate like Yishun or Tengah.
Is there a priority ballot for applicants near the project location?
Yes, under certain conditions. HDB provides a Married Child Priority Scheme (MCPS) for applicants whose parents live in the same town or within 4km of the BTO project. MCPS allocates a portion of units (typically 30% for those in the same town, 15% for within 4km) to eligible applicants before the general ballot. This priority scheme is separate from the EHG and does not require an income ceiling. To qualify, both the applicant household and the parents’ household must be Singapore Citizens, and the parents must be registered at an HDB address in the applicable town or within 4km of the BTO site. There is no corresponding scheme for applicants working near the project — only family proximity qualifies.
Disclaimer: This article is for general informational and educational purposes only. Flat prices shown are indicative pre-launch estimates compiled from publicly available market commentary and are not official HDB figures. Actual flat prices, flat types, unit counts and specific project details will be confirmed only when HDB officially launches the October 2026 sales exercise. Grant eligibility and amounts are subject to HDB’s assessment of your specific household circumstances. Always verify eligibility, pricing, and grant quantum directly with HDB at hdb.gov.sg or homes.hdb.gov.sg before making any decision. This article does not constitute financial, legal, or housing advice.