
Singapore Rental Market Guide 2026: HDB and Condo Rents, Yields and Outlook Explained

Singapore Rental Market Guide 2026: HDB and Condo Rents, Yields and Outlook Explained

Quick Answer: Singapore Rental Market 2026

  • Singapore’s private residential rental index rose 0.3% in Q1 2026 (URA), recovering from a 0.5% dip in Q4 2025, but remains below the 2023 peak.
  • HDB rental index eased 0.1% in Q1 2026, continuing a gradual softening from the 2023 high after two years of elevated rents.
  • Median rents in Q1 2026: HDB 4-room S$2,600/mth, condominium 2-bedroom S$3,600/mth (OCR), condominium 3-bedroom S$5,200/mth.
  • Gross rental yields remain attractive for HDB (4.7–5.6%) compared with private condominiums in Core Central Region (CCR) (2.6%).
  • Rising supply from 2024–2025 completions is the dominant dampener; landlords must price competitively in 2026.
  • Demand drivers: foreign professional workforce (Employment Pass/S Pass holders), expat families on education visas, and domestic upgraders waiting for new homes to complete.
  • Short-term rentals (fewer than 3 months) remain prohibited for residential properties in Singapore under URA regulations.
  • Landlords must declare rental income on their annual income tax returns to IRAS; allowable deductions include mortgage interest, property tax, and maintenance fees.

Understanding Singapore’s Rental Market

Singapore’s residential rental market is one of Asia’s most closely watched — shaped by a unique interplay of government-controlled HDB supply, private condominium completions, immigration policy, and one of the highest proportions of home ownership in the world (approximately 89%). Unlike many global cities, Singapore’s rental sector is comparatively small: most residents own their HDB flats. The rental pool is disproportionately driven by the expatriate workforce and a domestic segment of upgraders temporarily between properties.

The Urban Redevelopment Authority (URA) tracks the Private Residential Rental Index quarterly; HDB separately tracks the HDB Rental Index. Both indices are released alongside quarterly real estate statistics — the primary authoritative source for rental market data. The Q1 2026 URA statistics confirmed that private rental growth has moderated after the exceptional surge of 2021–2023, when the market rose over 50% from its COVID-era trough on the back of a supply drought and surging foreign workforce arrivals.

Rental Index Trend: 2020–2026

The rental cycle of this decade is one of the most dramatic in Singapore’s property history. From a base of approximately 100 in early 2020, the HDB Rental Index rose to a peak of approximately 163 by mid-2023 before softening. Private residential rents peaked near 175 in mid-2023. As at Q1 2026, both indices have retreated — the HDB index to approximately 156, the private residential index to approximately 165 — representing a correction of roughly 4–6% from peak.

Singapore rental index trend 2020 to 2026 - HDB vs private residential rental index
Figure 1: Singapore HDB and Private Residential Rental Index trend, Q1 2020 – Q1 2026 (Q1 2020 = 100). Sources: URA, HDB quarterly real estate statistics.

The correction has been driven primarily by supply normalisation — a wave of private condominium completions in 2024–2025 (including several large integrated developments) added significant rental stock to the market, while post-COVID foreign workforce growth moderated as global companies trimmed headcount in 2024–2025. Nevertheless, rents remain approximately 55% higher in absolute terms than pre-COVID levels for most property types.

Median Monthly Rents by Property Type, Q1 2026

Industry figures from Q1 2026 show median monthly rents across property types as follows. HDB room types continue to offer the most accessible entry point for tenants, while Core Central Region (CCR) condominiums command a substantial premium reflecting proximity to the CBD and top international schools.

Singapore median monthly rents 2026 - HDB and condo by room type Q1 2024 vs Q1 2026
Figure 2: Singapore median monthly rents Q1 2024 vs Q1 2026 by property type. All figures are indicative medians; individual transacted rents vary by location, floor, condition, and furnishing.

Key observations from the Q1 2026 data: HDB 3-room rents have eased from approximately S$2,300/mth in Q1 2024 to approximately S$2,200/mth, a modest 4.3% decline. Private condominium 3-bedroom rents have softened more noticeably from approximately S$5,500/mth to S$5,200/mth (−5.5%). Executive flat rents remain relatively sticky at approximately S$3,100/mth, reflecting persistently high demand from larger families displaced from the HDB resale market by the 15-month wait.

Gross Rental Yields by Property Type

Gross rental yield is calculated as annual rent divided by market value. In Singapore’s context, it is an imperfect but useful comparator — particularly when set against the CPF Ordinary Account rate of 2.5% p.a. and typical bank mortgage rates of 3.0–3.7% p.a. in 2026. Properties yielding below the mortgage rate require careful cash flow modelling; properties yielding above 4.5% can generate positive carry even at current financing costs.

Singapore rental yield by property type 2026 - HDB condo landed gross yield comparison
Figure 3: Gross rental yield by property type, Singapore Q1 2026. Yields are gross — deduct mortgage interest, property tax, management fees, vacancy, and maintenance for net yield calculations.

HDB flats deliver the highest gross yields precisely because their prices are regulated and their transacted values remain significantly below equivalent private condominiums. A well-located 3-room HDB in Toa Payoh with a transacted rent of S$2,200/mth and a resale value of approximately S$470,000 generates a gross yield of approximately 5.6% — among the highest in Singapore’s residential market. However, HDB landlords face non-citizen quota constraints (8% or 11% per block/neighbourhood) and must comply with the Minimum Occupation Period (MOP) rules and HDB approval requirements. See our comprehensive HDB Rental Guide 2026 for full details.

Landlord Obligations and Legal Framework

Residential tenancies in Singapore are governed primarily by contract law — there is no Residential Tenancies Act equivalent to those in the United Kingdom or Australia. The standard Tenancy Agreement is a contractual document prepared by either party’s lawyer or the property agent. Key regulatory requirements for landlords include:

  • Stamp duty on tenancy agreements: The tenant is liable to pay stamp duty on the tenancy agreement via IRAS e-Stamping. The rate is 0.4% of the total rent for leases of 1–4 years; for leases exceeding 4 years, the rate is 4% of the average annual rent. In practice, landlords should confirm the stamp duty is paid within 14 days of signing, as IRAS treats it as a condition for the agreement to be legally admissible in court.
  • Short-term rental prohibition: URA regulations prohibit the use of private residential properties for accommodation for periods of fewer than 3 consecutive months. Platforms such as Airbnb, Agoda (short-stay listings), and similar are prohibited for residential properties. Violations carry fines of up to S$200,000 per offence.
  • HDB subletting rules: HDB flat owners who have completed their Minimum Occupation Period (MOP) may sublet their whole flat or individual bedrooms, subject to HDB approval, non-citizen quota compliance, and the maximum occupancy limits (8 persons per flat until 31 December 2026 under the current temporary relaxation).
  • Property tax: Landlords pay property tax at non-owner-occupier rates (typically 10–20% of the Annual Value for private properties, 10% for HDB), which is a deductible expense against rental income.
  • Rental income tax: Rental income is taxable as personal income in Singapore. Allowable deductions include mortgage interest, property tax, fire insurance premiums, maintenance fees, and depreciation of approved furniture at 20% per annum declining balance.

Summary: Singapore Rental Market at a Glance, 2026

Property Type Typical Monthly Rent Gross Yield Key Tenant Profile
HDB 2-room S$1,400–S$1,600 ~5.2% Singles, young couples
HDB 3-room S$2,000–S$2,400 ~5.6% Small families, couples
HDB 4-room S$2,400–S$2,800 ~5.1% Families, expat workers
HDB 5-room S$2,600–S$3,200 ~4.7% Families, management expats
Condo 1-bedroom (OCR) S$2,400–S$2,800 ~3.8% Young professionals
Condo 2-bedroom (OCR) S$3,200–S$4,000 ~3.8% Couples, small families
Condo 2-bedroom (CCR) S$4,500–S$6,500 ~2.6% Senior expat executives
Landed Terrace S$6,000–S$10,000 ~2.1% High-net-worth families

Worked Example: Mr Rajan Buys a 3-Room HDB to Rent Out in Ang Mo Kio

Mr Rajan, a Singapore Citizen, purchased a 3-room HDB resale flat in Ang Mo Kio in August 2021 for S$450,000. His MOP completed in August 2026 and he immediately lists it for whole-flat rental while upgrading to a condominium. Key figures:

  • Purchase price: S$450,000 in August 2021.
  • MOP completion: August 2026 (5 years from key collection).
  • Estimated market rent (Q1 2026): S$2,100–S$2,300/mth for a well-maintained 3-room in Ang Mo Kio.
  • Monthly gross income: S$2,200/mth (midpoint).
  • Annual gross rent: S$26,400.
  • Gross yield: S$26,400 / S$450,000 = 5.9% (calculated on original purchase price; current AV-based valuation ~S$480,000 gives ~5.5%).
  • Property tax (non-owner-occupier): Annual Value approximately S$24,000; property tax approximately S$2,400/yr at 10%.
  • Mortgage interest (if outstanding loan S$150,000 at 2.6%): ~S$3,900/yr (deductible).
  • Net rental income (estimated): S$26,400 − S$2,400 (property tax) − S$3,900 (interest) − S$1,200 (maintenance, insurance) = approximately S$18,900/yr, taxable at Mr Rajan’s personal income rate.
  • Stamp duty on 12-month tenancy at S$2,200/mth: 0.4% × S$26,400 = S$105.60 (tenant’s liability but landlords confirm this is paid).

The non-citizen quota check (8% neighbourhood / 11% block) must be confirmed with HDB before signing the Tenancy Agreement. HDB approval is required for whole-flat rental; approval is typically granted within 3–5 business days via the HDB Resale Portal.

What Might Come Next for Singapore Rents

The 2026 rental market is characterised by a bifurcation: HDB rents are gradually softening as more MOP flats come onto the rental market and demand moderates, while premium private rents in the CCR are proving stickier, supported by a resilient pool of senior expatriate tenants who cannot or will not rent HDB. The key upside risk to the softening thesis is a reversal in Singapore’s technology and financial services hiring cycle — any rebound in Employment Pass issuances (which fell in 2024–2025 under tighter Fair Consideration Framework scrutiny) would tighten rental supply rapidly given the low vacancy rates in well-located projects. The key downside risk is continued elevated completions through 2026–2027 from the record launch years of 2021–2022, which will maintain supply pressure on mid-market condominiums.

For investors evaluating rental yield against price appreciation potential, the OCR condominium segment offers the most balanced risk-reward in 2026: gross yields of approximately 3.5–4.0% are competitive with bank deposit rates after factoring in leverage, while capital value upside from Jurong Lake District and Cross Island Line catalysts provides a medium-term appreciation thesis. See our Singapore Property Investment Guide 2026 for a full cross-asset comparison.

Frequently Asked Questions

Are Singapore rents going up or down in 2026?

Singapore’s rental market is in a gradual softening phase in 2026. According to URA Q1 2026 data, the private residential rental index rose 0.3% quarter-on-quarter — a marginal recovery after a 0.5% dip in Q4 2025 — but remains below the 2023 peak. HDB rents eased 0.1% in Q1 2026. The dominant factors are increased supply from 2024–2025 completions and moderating foreign workforce demand. Most market observers expect rents to remain broadly flat to slightly lower through 2026, with premium CCR properties proving more resilient than mass-market OCR condominiums and HDB flats.

Can I Airbnb my Singapore condo or HDB flat?

No. URA regulations prohibit the use of private residential properties for short-term accommodation of fewer than 3 consecutive months. This applies equally to condominiums, landed properties, and HDB flats. Listing a Singapore residential property on Airbnb, Agoda short-stay, or similar platforms is a regulatory offence carrying fines of up to S$200,000 per offence. HDB additionally prohibits subletting to short-term visitors regardless of platform. The minimum tenancy period for all residential properties in Singapore is 3 months.

Do I need to declare rental income to IRAS?

Yes. Rental income is taxable as personal income in Singapore and must be declared on your annual Income Tax return. IRAS requires landlords to report gross rent received, then deduct allowable expenses: mortgage interest (on the loan for the rented property), property tax paid, fire insurance premiums, cost of maintenance and repairs (but not capital improvements), management fees, and furniture depreciation at 20% per annum declining balance on approved items. Failure to declare rental income attracts penalties of up to 200% of the tax undercharged. See IRAS’s guide at iras.gov.sg for the current rental income declaration checklist.

What is the non-citizen quota for HDB rentals?

HDB imposes a Non-Citizen Quota (NCQ) to preserve the social mix of HDB estates. The quota limits the proportion of HDB flats in each block and neighbourhood that may be rented to non-Malaysia foreigners (i.e., all non-citizens who are not Malaysian citizens). The limits are 8% at the neighbourhood level and 11% at the block level. If either quota has been met, the landlord cannot rent to a non-Malaysian foreigner regardless of HDB approval status. Malaysia citizens are exempt from the NCQ. Singapore PRs count as citizens for NCQ purposes. Always check the NCQ status on the HDB website before signing any Tenancy Agreement with a foreign tenant.

What is a diplomatic clause in a tenancy agreement?

A diplomatic clause (or Diplomatic Break Clause) is a contractual provision that allows the tenant to terminate the tenancy early if they are relocated or transferred out of Singapore by their employer — typically with 2 months’ written notice after the first year of the lease. It is commonly requested by expatriate tenants and their employers. Landlords generally accept diplomatic clauses for premium properties where the tenant pool is predominantly expatriate. The clause should specify the minimum tenancy period before it can be activated (typically 12 months), the notice period, and whether any penalty or notice fee applies. If the tenant exercises the clause, they forgo the security deposit for the unused period — the exact mechanism is a matter of negotiation.

How is stamp duty on a tenancy agreement calculated?

Stamp duty on a Tenancy Agreement is calculated under the Stamp Duties Act (Cap. 312). For a lease of 1–4 years, the duty is 0.4% of the total rent payable over the tenancy period. For a lease exceeding 4 years, the duty is 4% of the average annual rent. Example: a 12-month lease at S$3,500/mth = total rent S$42,000; stamp duty = 0.4% × S$42,000 = S$168. Payment is due within 14 days of signing via the IRAS e-Stamping portal. The stamp duty is the tenant’s liability by default, but the Tenancy Agreement may specify otherwise. An unstamped tenancy agreement is inadmissible as evidence in court, though the tenancy itself remains contractually enforceable as between the parties.

What is a typical security deposit for a Singapore rental?

The market convention in Singapore is one month’s rent as security deposit for every year of tenancy — so a 1-year lease typically requires a 1-month deposit, and a 2-year lease requires a 2-month deposit. For leases with a diplomatic clause, landlords sometimes negotiate a 2-month deposit for a 1-year lease as additional security against early termination. There is no statutory cap on the security deposit amount in Singapore — it is entirely a matter of negotiation. The deposit should be held in a separate client account by the agent or returned directly to the landlord, and must be refunded within 14 days after the end of the tenancy (less any deductions for damage or unpaid rent, supported by receipts and a condition report).

Related Articles

Disclaimer: This article is intended for general informational purposes only and does not constitute legal, tax, or financial advice. Rental figures, yields, and index data cited are based on information available as at 7 June 2026 and are subject to change. Individual rental outcomes depend on property location, condition, furnishing level, and prevailing market conditions. Readers should consult a licensed Singapore real estate agent (CEA-registered), a Monetary Authority of Singapore (MAS) licensed financial adviser, and IRAS for personalised rental income tax guidance. Authoritative references: URA (ura.gov.sg), HDB (hdb.gov.sg), IRAS (iras.gov.sg), CEA (cea.gov.sg).

URA Q1 2026 Private Home Prices Rise 0.9% — Revised Up from +0.3% Flash, OCR Leads at +2.2%

URA Q1 2026 Private Home Prices Rise 0.9% — Revised Up from +0.3% Flash, OCR Leads at +2.2%

Singapore private home prices rose 0.9% in the first quarter of 2026 — almost three times the pace flagged in the URA flash estimate three weeks earlier. The final reading, published by the Urban Redevelopment Authority on 24 April 2026, marks the sixth consecutive quarter of growth in the private residential price index, and it tells a story that diverges sharply from the volume picture: prices firmed, but transactions slumped almost 40% quarter-on-quarter.

Quick Answer — what the URA Q1 2026 release shows

  • Overall private residential PPI: +0.9% q-o-q, sixth consecutive quarter of growth.
  • Sharp upward revision from the +0.3% flash estimate on 1 April.
  • Non-landed properties: +1.3%; landed: -1.8%, reversing the +3.4% prior quarter.
  • OCR led non-landed with +2.2%; RCR +0.8%; CCR +0.6%.
  • Transaction volume crashed: only 4,041 deals recorded by mid-March, -39.7% versus 4Q 2025.
  • Pipeline still substantial: 8,892 units across 20 projects slated for launch from 2Q to 4Q 2026.
URA Q1 2026 private home prices +0.9% — guide cover
URA Q1 2026 final release — private home prices revised up to +0.9%.

Flash to Final — A Substantial Upward Revision

URA flash estimates are released on the first business day of every quarter, before the full transaction sample is in. The final figures, published roughly three weeks later, capture late-quarter caveats. In most quarters the gap between flash and final is small — perhaps 0.1 to 0.3 percentage points. In Q1 2026 the gap was larger than usual: from +0.3% to +0.9%.
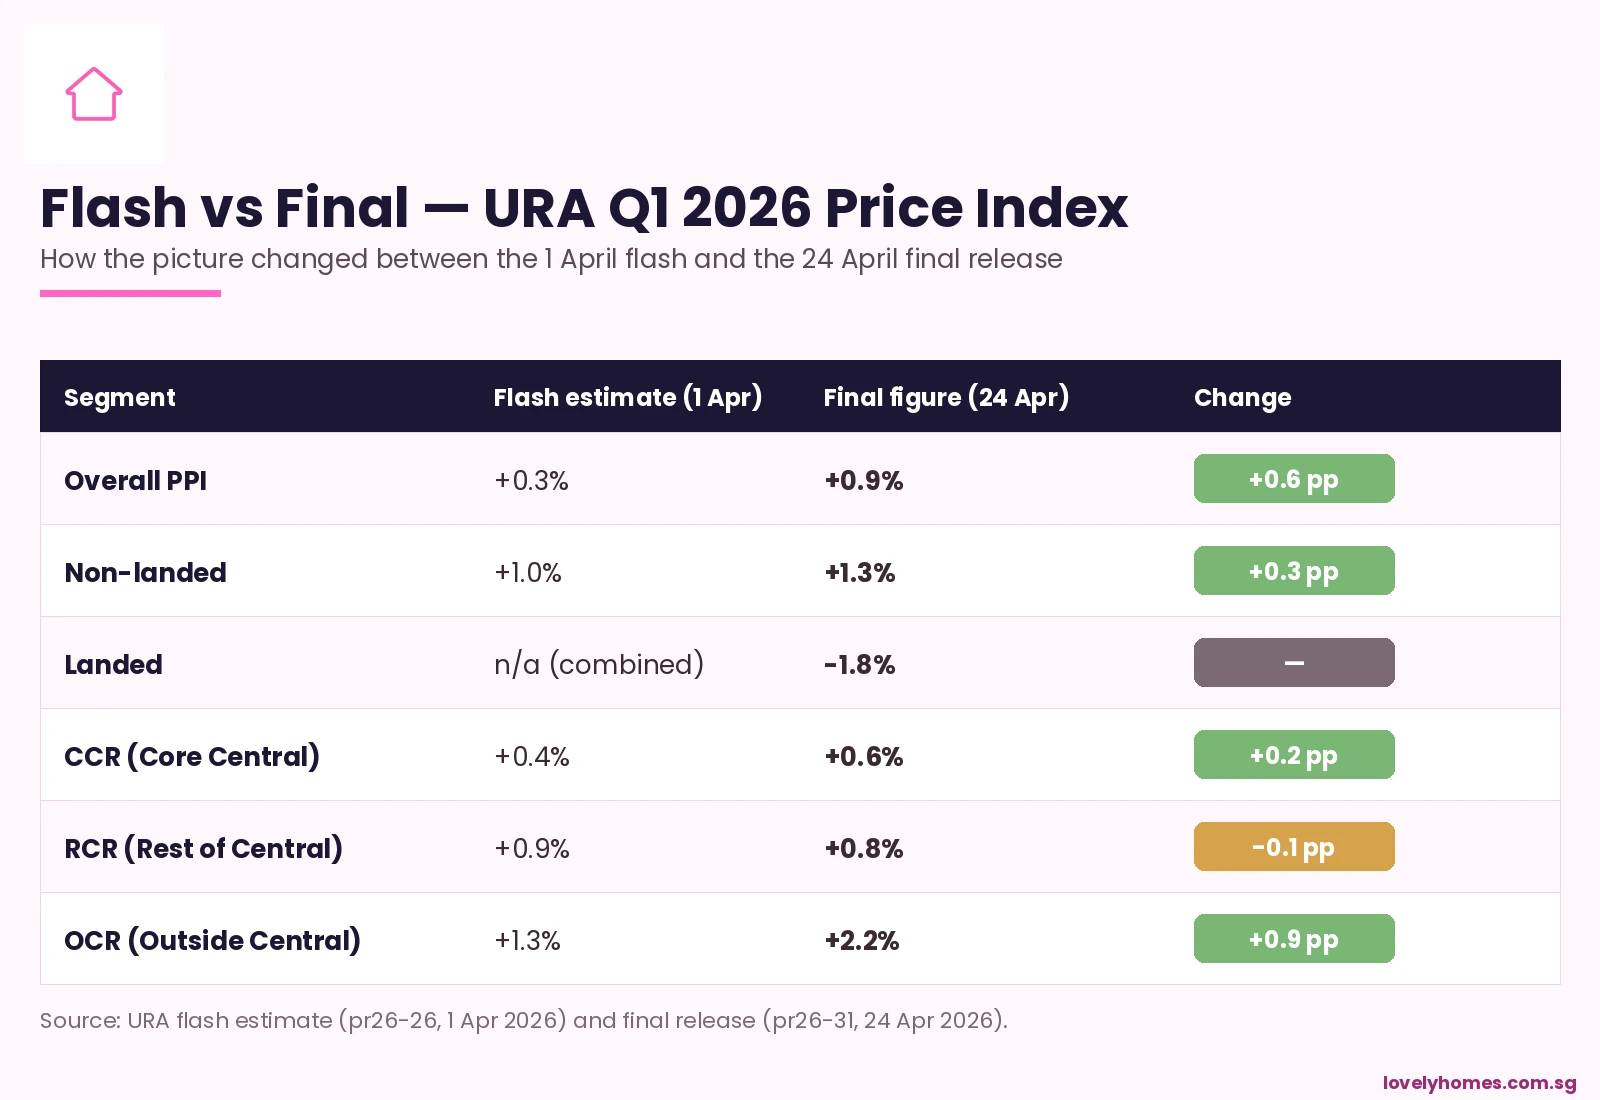
URA Q1 2026 flash vs final by region — overall +0.3% revised to +0.9%, OCR +2.2%
Figure 1: Flash vs final — URA Q1 2026 PPI revisions by region.

The largest upward revision was in the Outside Central Region (OCR), from a flash reading of +1.3% to a final +2.2%. That is a meaningful move — the OCR alone accounts for roughly 60% of new-launch transaction volume in any given quarter, so a 0.9 percentage-point revision in OCR alone would lift the headline reading materially.

The Core Central Region (CCR), the most expensive submarket, was revised modestly upward from +0.4% to +0.6%, after a punishing -3.5% in 4Q 2025. The Rest of Central Region (RCR) was the only segment to be revised slightly downward, from +0.9% to +0.8%.

Why Were OCR Numbers Revised So Sharply?

Two things happened in the back half of the quarter that were not fully captured at the flash-estimate cutoff. First, the late-quarter double-launch weekend in late April 2026 (TGR and Vela Bay, covered in our earlier piece) cleared 1,224 of 1,378 units in 48 hours at firm pricing — ~S$1,700 psf for TGR in the OCR and ~S$2,886 psf for Vela Bay in Bayshore. Both sets of transactions dragged up the OCR PPI when finally captured.

Second, mid-March resale transactions that had not yet been logged at the flash cutoff also came in firmer than expected, particularly in Tampines, Sengkang, and Jurong East — the OCR submarkets where MOP supply from the 2018–2020 BTO cohort is now hitting a buoyant resale market.

The Volume Story — A 39.7% Crash

The price firming has to be read against a steep drop in activity. Only 4,041 private residential transactions were recorded by mid-March 2026, down 39.7% versus the 6,699 transactions in 4Q 2025. That is the lowest quarterly transaction count in nearly two years.
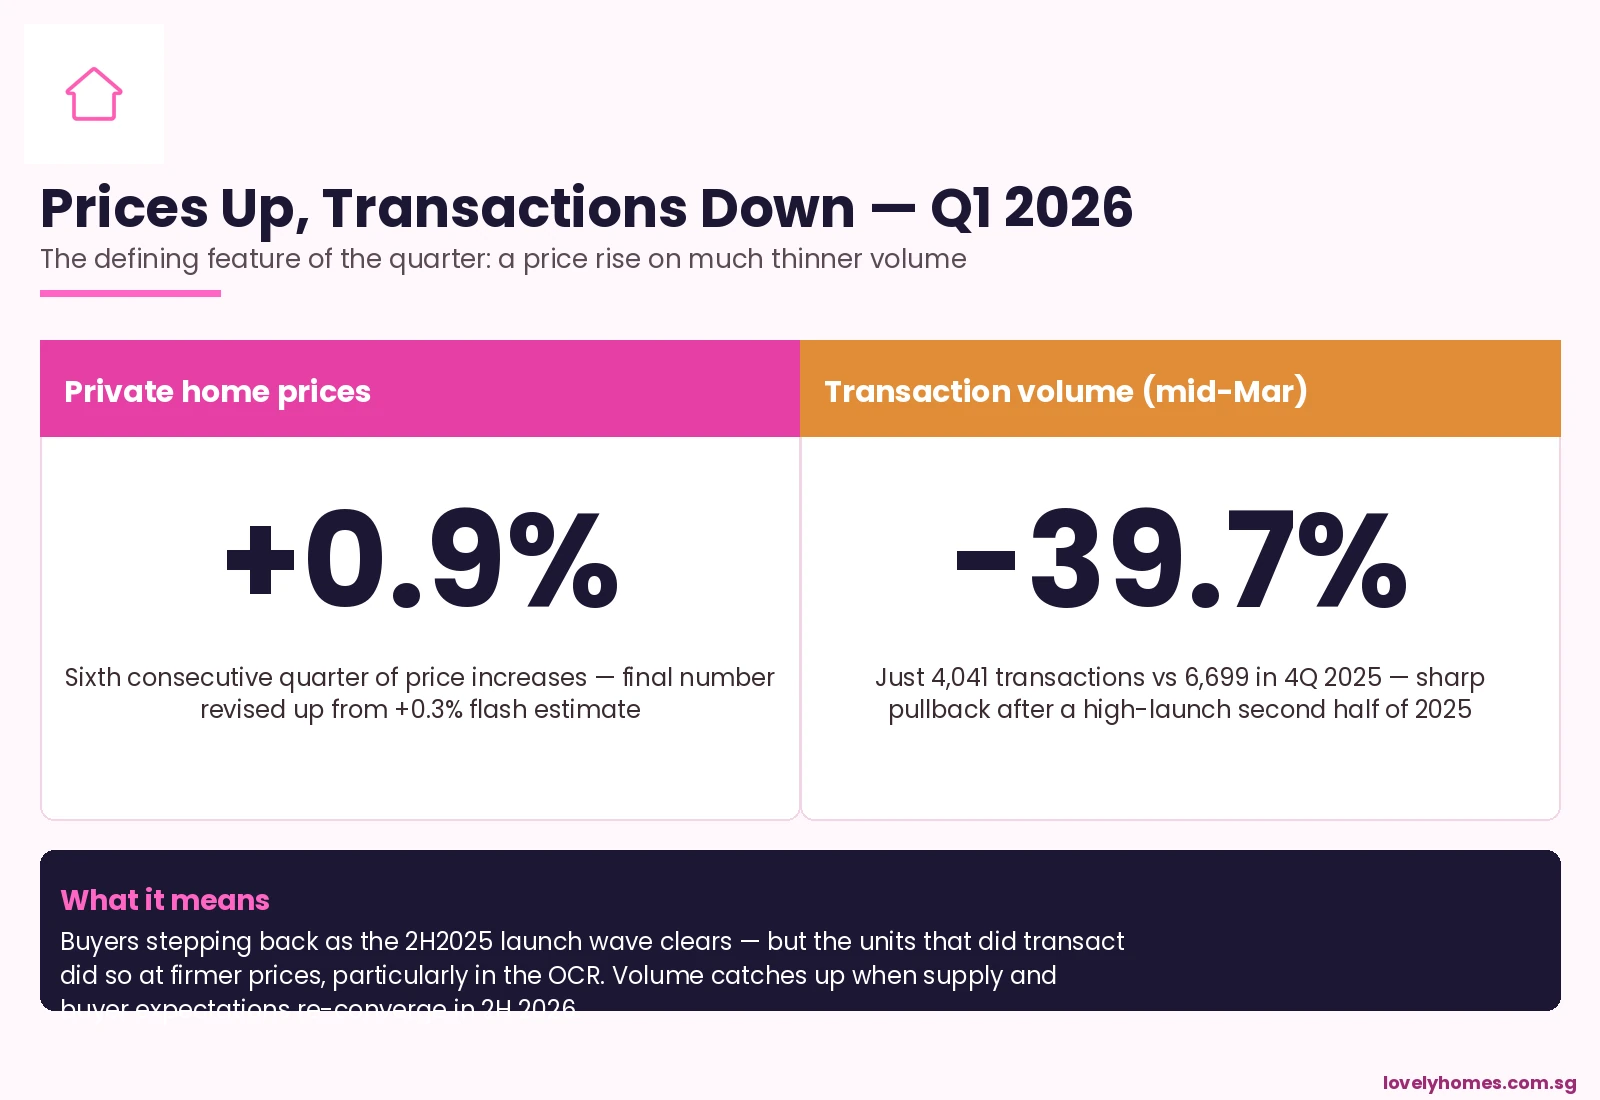
URA Q1 2026 prices +0.9% but transactions -39.7% — divergence chart
Figure 2: The defining tension of Q1 2026 — firmer prices on much thinner volume.

The volume drop has two readable causes. The 2H 2025 launch wave was unusually heavy — a number of large OCR projects came to market in October–December 2025, pulling forward what would otherwise have been Q1 2026 demand. Q1 2026 was always going to look soft on volume by comparison.

The second cause is sentiment. Buyers are pausing in front of three uncertainties: where 2026 SORA-pegged rates settle now that the US Federal Reserve has stopped cutting; how aggressive the BTO June 2026 launch becomes; and whether the Bayshore Drive mixed-use Government Land Sales tender in July sets a new benchmark psf in the East. Volume usually returns once these three questions get answered.

Landed -1.8% — Mean-Reverting After a Hot 4Q

The landed segment swung from +3.4% in 4Q 2025 to -1.8% in Q1 2026, a 5.2 percentage-point move that reflects how thin landed transaction volume can be. Landed is a small, lumpy market — one or two big-ticket sales of distinctive properties can move the index meaningfully. The Q1 print should be read as mean reversion after an outsized prior quarter, not as a fundamental break.

Rental Index +0.3% — Stabilising After 2024 Cool-Off

The private residential rental index ticked up 0.3% in Q1 2026 after the multi-quarter cool-off through 2024 and early 2025. Yields on private condos remain in the 3.0–3.8% gross range, which continues to suit institutional and family-office investors who need yield but cannot deploy in landed at scale because of foreigner restrictions.

What Comes Next — The Q2 to Q4 Pipeline

Indicator Q1 2026 reading What it implies for the rest of 2026
Overall PPI +0.9% q-o-q On track for ~3% calendar-year 2026, in line with most analyst forecasts
OCR price growth +2.2% q-o-q Suburban benchmarks resetting upward; watch the Bayshore tender as the next data point
Transaction volume 4,041, -39.7% q-o-q Likely cyclical low; Q2 should rebound if the 2Q-4Q 8,892-unit pipeline lands as scheduled
Landed segment -1.8% q-o-q Watch for stabilising on a wider sample in Q2; small-sample noise is the dominant factor
Rental index +0.3% q-o-q Yields steady; institutional appetite for buy-to-let condos persists

What This Means for Buyers — The Counter-Cyclical Window

For end-user buyers who have been waiting on the sidelines, Q1 2026 is the kind of moment that historically gets revisited as a buying window. Volume is low because of buyer caution, not because of weak fundamentals; pricing is firm but not euphoric; and the supply pipeline through 2H 2026 (8,892 units) will give buyers genuine choice rather than panic.

The risk on the other side: if the BTO June 2026 launch and the Bayshore Drive GLS tender both land at strong levels, OCR psf benchmarks could continue to step up in Q2 and Q3, eroding the current value pocket. Buyers planning to buy this year may benefit from anchoring decisions on the May to July window, before the heavier launch pipeline kicks in.

Frequently Asked Questions

Why was the upward revision from flash to final so large this quarter?

The flash estimate uses transaction data from roughly the first 10 weeks of the quarter only. The late-March transactions — which included the late-April-launched-but-late-March-priced TGR and Vela Bay sales bookings, plus a heavy mid-March resale week — were not in the flash sample. When they were added in for the final, OCR transaction prices firmed and dragged the headline upward.

Does this change the 2026 full-year forecast?

Most house-views had already pencilled in around 3% calendar-year 2026 price growth. Q1 at +0.9% is broadly consistent with that pace — not a beat, not a miss. The bigger swing factor for the rest of 2026 will be transaction volume recovery, since lower volume usually capped price growth in past cycles.

If volume is so weak, why are prices going up at all?

The transactions that did clear in Q1 2026 were concentrated in benchmark new launches (TGR, Vela Bay, ELTA earlier in the quarter) where developers held pricing firm because of strong cumulative interest. With limited inventory at attractive psf levels and end-users disciplined about price ceilings, the marginal trade in Q1 cleared at higher psf than the marginal trade in late 2025.

What does this mean for HDB upgraders?

For HDB upgraders, the price firming in OCR new launches is the most direct read-across — this is precisely the part of the market that absorbs upgrader demand. The flip side, however, is that HDB resale prices dipped 0.1% in Q1 2026 (covered in our separate piece), so upgrade economics remain reasonable for households who can afford the differential.

Does the URA Q1 2026 release affect cooling-measure expectations?

Almost certainly not. +0.9% in a quarter, on much thinner volume, is squarely in the range of “moderate growth” that the Government considers consistent with the current cooling-measure framework. Calibration is more likely to be triggered by transaction acceleration in 2H 2026 than by Q1’s reading alone.

How much new supply is coming?

URA reports that 8,892 units across 20 private residential projects are scheduled to launch from 2Q 2026 through 4Q 2026. That is a substantial pipeline, weighted to the OCR. Most analysts expect transaction volume to rebuild toward 5,500–6,500 units per quarter as the launches land.

Related Articles

Disclaimer

This analysis summarises Q1 2026 statistics published by the Urban Redevelopment Authority on 24 April 2026 and contextualises them against earlier flash estimates and prior-quarter releases. Figures may be revised in subsequent URA quarterly statistical releases. The piece does not constitute investment, tax, or legal advice. For authoritative figures consult URA, HDB, the Monetary Authority of Singapore, the Inland Revenue Authority of Singapore, CPF Board, and SingStat. Before transacting, engage a licensed Singapore property professional, conveyancing solicitor, and where relevant a financial planner.
Singapore Property Market Outlook 2026: Prices, Rates and What to Watch

Singapore Property Market Outlook 2026: Prices, Rates and What to Watch

Quick answer
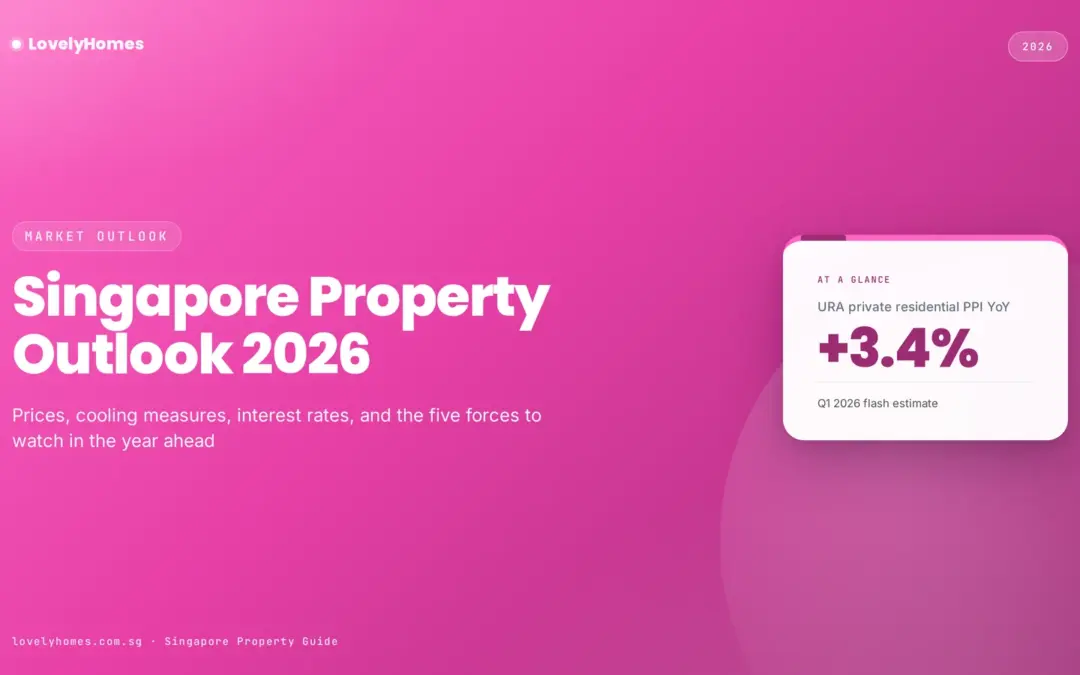
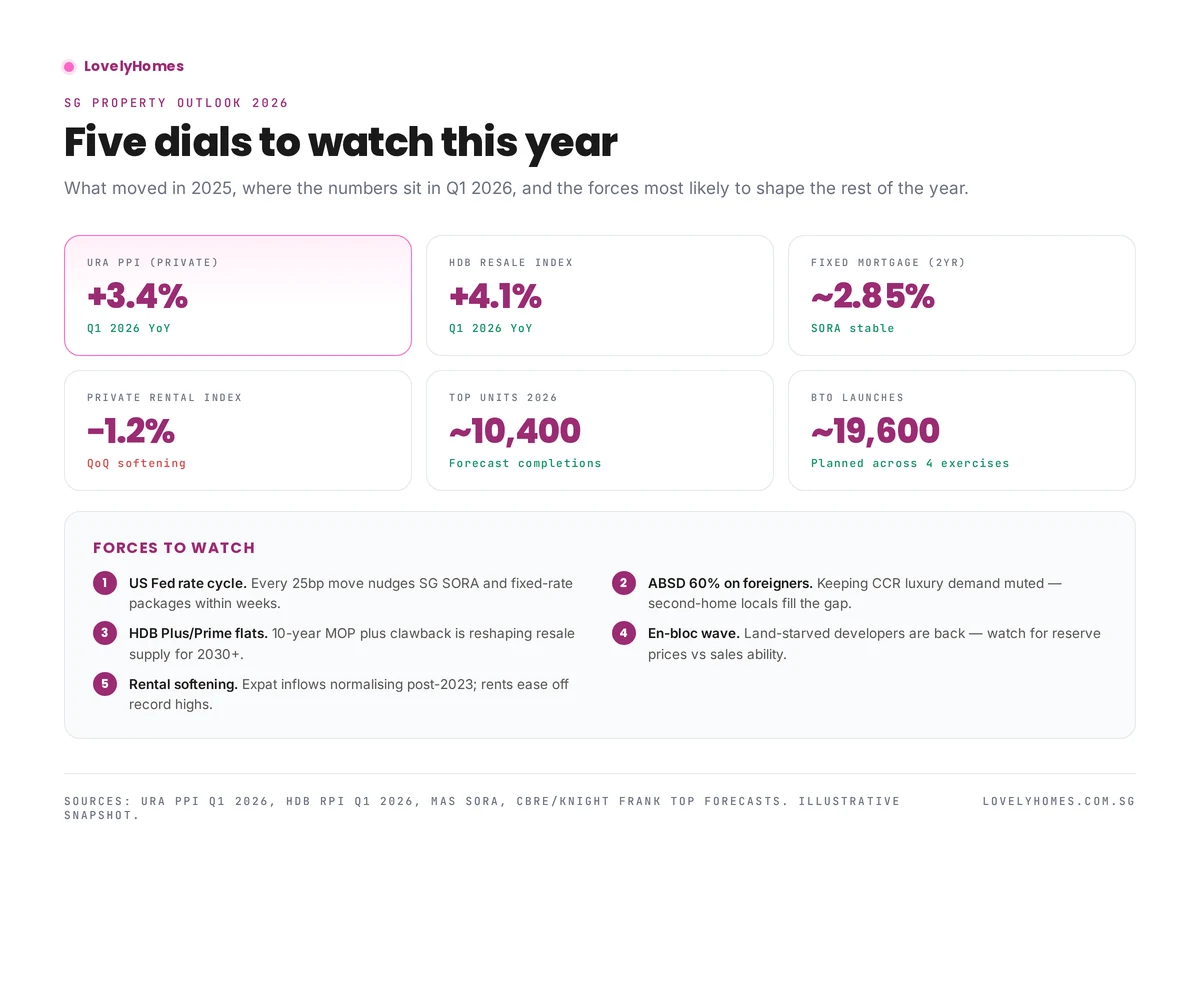
Singapore’s 2026 private residential market is entering the year with URA PPI up 3.4% YoY and HDB resale index up 4.1% YoY. Mortgage rates have stabilised in the mid-2% band. Private rents have softened 1–2% QoQ as expat-driven demand normalises. The five forces most likely to shape the rest of 2026 are: (1) US Fed rate path, (2) the 60% foreigner ABSD, (3) HDB Plus/Prime flat supply, (4) en-bloc activity, (5) rental yield compression from rising wages.

Every January, analysts publish a property outlook for the year ahead. Most read more like agent talking-points than analysis. This one tries to do the opposite — state the numbers as they stand at Q1 2026, name the forces that will move them, and flag where consensus is most likely to be wrong.

This is a general-market view, not a valuation of any specific district. For district-level granularity, watch our forthcoming Area Guide series. For the tax and cooling-measure context that underpins all of the below, start with our cooling measures timeline.

Singapore property market outlook 2026 dashboard — PPI, HDB RPI, rates and five forces
Q1 2026 snapshot of the five market dials that matter most.

Prices — private and public

URA Private Residential Price Index

URA PPI closed 2025 at record highs. The Q1 2026 flash estimate is +3.4% YoY, with the RCR (city fringe) band leading at roughly +4.6% and CCR lagging at +2.1%. OCR sits in between at +3.9%.

HDB Resale Price Index

HDB RPI is tracking +4.1% YoY — the eighth consecutive quarter of gains, but the pace has decelerated from the double-digit 2022 run. Million-dollar HDB transactions have broadened from central flats into Bishan, Bukit Merah, Queenstown and, increasingly, mature Bidadari and Kallang Whampoa.

Interest rates and financing

3-month compounded SORA has drifted into the 2.5–2.9% range. Fixed packages from local banks are quoting around 2.85% for two-year tenors. That is well below the 2023 peak (~4%) but still meaningfully higher than the 2020–2021 sub-2% era.

Two upshots:

  • Refinancing activity is picking up for loans originated at the 2023 peak. See our refinancing guide.
  • TDSR bites harder than it did pre-2022. Affordability constraints more than prices are now the dominant buying-decision driver. Our TDSR & MSR guide explains the maths.

Supply coming through

Segment Units landing 2026 Impact
Private residential TOP ~10,400 Keeps rental supply refreshed
EC TOP ~3,800 HDB upgraders hand back resale flats
BTO launches (planned) ~19,600 flats Large Plus/Prime share

Rental market

After the extraordinary 2022–2023 surge (+25% to +30% YoY at the peak), rents are normalising. Q4 2025 URA rental index was down 1.2% QoQ. Expect a sideways-to-softer 2026, especially for older non-integrated condos as expat renters rotate into newer stock.

Five forces shaping the rest of 2026

  1. US Fed rate path. Every 25bp shift flows through SORA and fixed packages in weeks.
  2. The 60% foreigner ABSD. Kept CCR luxury flat. Any softening would re-ignite CCR transaction volumes.
  3. HDB Plus / Prime supply. 10-year MOP plus subsidy clawback is reshaping the 2030+ resale pool.
  4. En-bloc cycle. Developers are land-starved; reserve prices that reflect cooling measures may finally clear.
  5. Rental compression. Yields moderate as wages normalise; investor maths re-anchors on capital appreciation, not cash flow.

Frequently asked questions

Will prices fall in 2026?

Base case: no. Prices grind higher at low single digits. Downside case: if the Fed holds rates longer than expected and supply lands faster, a flattish 2H 2026 is plausible.

Is now a good time to buy?

Depends on your horizon and cash flow. Owner-occupier with stable income: time in market beats timing the market. Investor leveraging up: TDSR-constrained — stress-test your affordability at a 4% rate.

Which segment looks strongest?

City-fringe RCR continues to be the sweet spot for owner-occupiers. OCR near MRT interchanges wins on yield.


This guide is for general information only and is accurate as of April 2026. Singapore property rules, taxes and cooling measures change frequently — always verify current figures with URA, IRAS, HDB or a licensed professional before committing. LovelyHomes is not a financial, legal or tax advisor.


Translate »