The Housing & Development Board released its full Q1 2026 statistics on 24 April 2026, confirming what the flash estimate had hinted at three weeks earlier: the HDB Resale Price Index slipped 0.1% quarter-on-quarter, the first quarterly contraction in almost seven years. The last time HDB resale prices fell on a QoQ basis was Q2 2019, before the post-COVID supply squeeze and the surge in million-dollar transactions reset the public-housing market.
The headline is small in absolute terms — one-tenth of one percent — but it lands as the inflection most market participants have been waiting for since price growth stalled in mid-2024. Coupled with a private residential market that rose 0.9% in the same quarter, Q1 2026 is the rarest of episodes: a clean break in the public-vs-private price trajectory.
Quick Answer — what changed in Q1 2026
HDB Resale Price Index: −0.1% QoQ — first quarterly fall since Q2 2019 (27 quarters ago).
Private Property Price Index: +0.9% QoQ — led by non-landed at +1.3%.
Million-dollar HDB resale share moderated after a record-setting 2025.
HDB pipeline: 6,900 BTO flats coming in June 2026 across Ang Mo Kio, Bishan, Bukit Merah, Sembawang, Woodlands.
Developer sales for private new launches: ~3,375 units, −32% QoQ after a heavy 4Q 2025 launch slate.
The HDB-vs-private QoQ gap (~1.0 ppt) is the widest in HDB’s-down direction since 2009.
The Number in Context
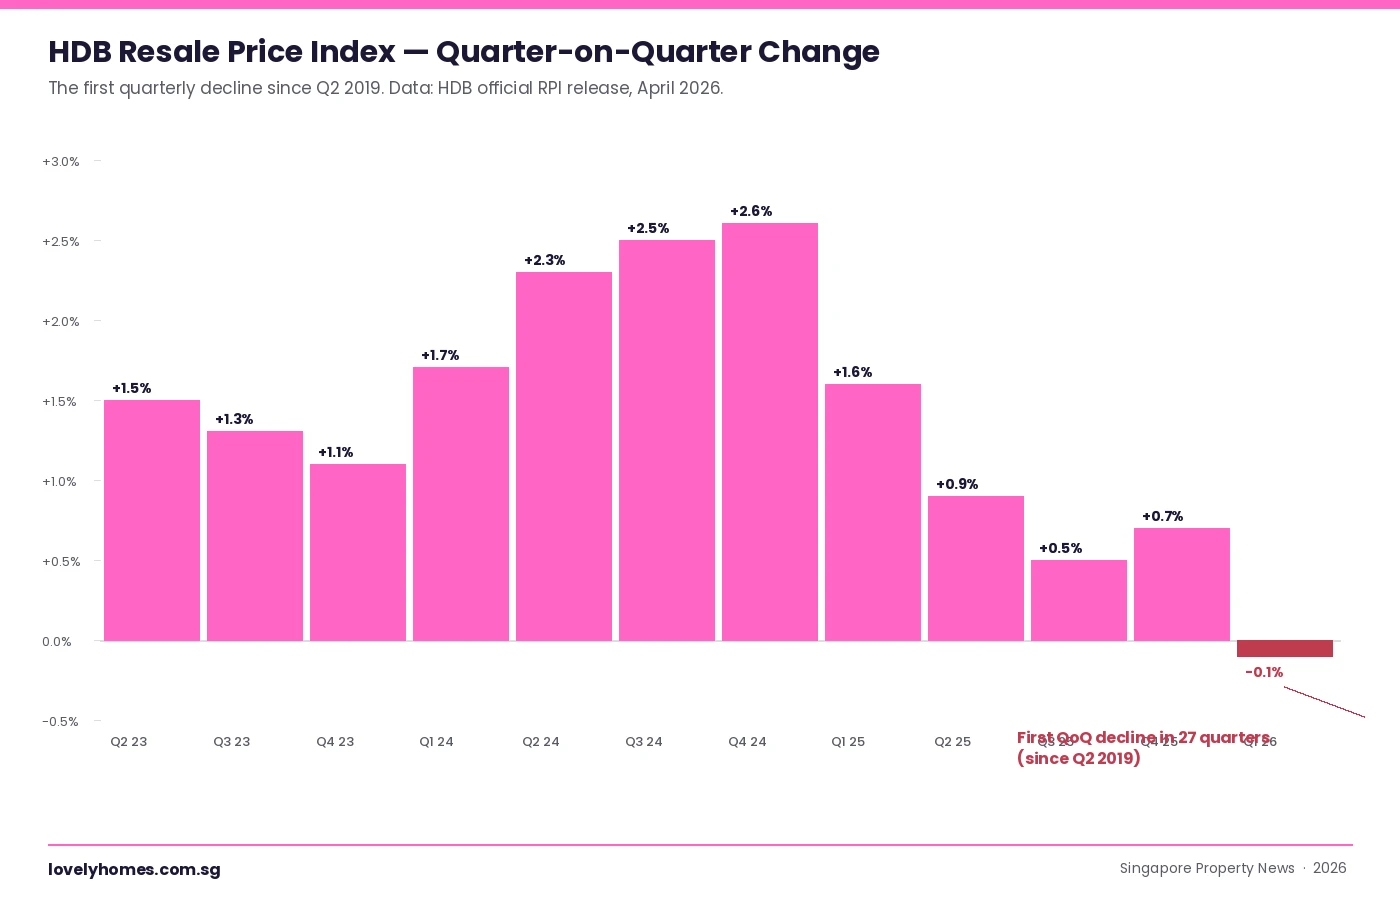
HDB Resale Price Index history makes the Q1 print feel less like a sudden drop and more like the natural end of a deceleration. Growth was 2.5% in Q3 2024 at its peak, slowed to 0.5% in Q3 2025, and ticked up modestly to 0.7% in Q4 2025 before turning negative in Q1 2026. The chart below sets the trajectory out cleanly.
Figure 1. HDB Resale Price Index, quarter-on-quarter percentage change from Q2 2023 to Q1 2026. Q1 2026 is the first negative print in 27 quarters; the previous decline was Q2 2019. Growth had been decelerating for five consecutive quarters before turning negative.
Reading the bars carefully, the deceleration has been visible since Q2 2025 (+0.9%) and has been a steady step-down rather than a spike-then-fall. That tells us the Q1 2026 fall is most likely the cumulative effect of supply-side and demand-side easing rather than a single-quarter shock.
The Divergence: HDB Down, Private Up
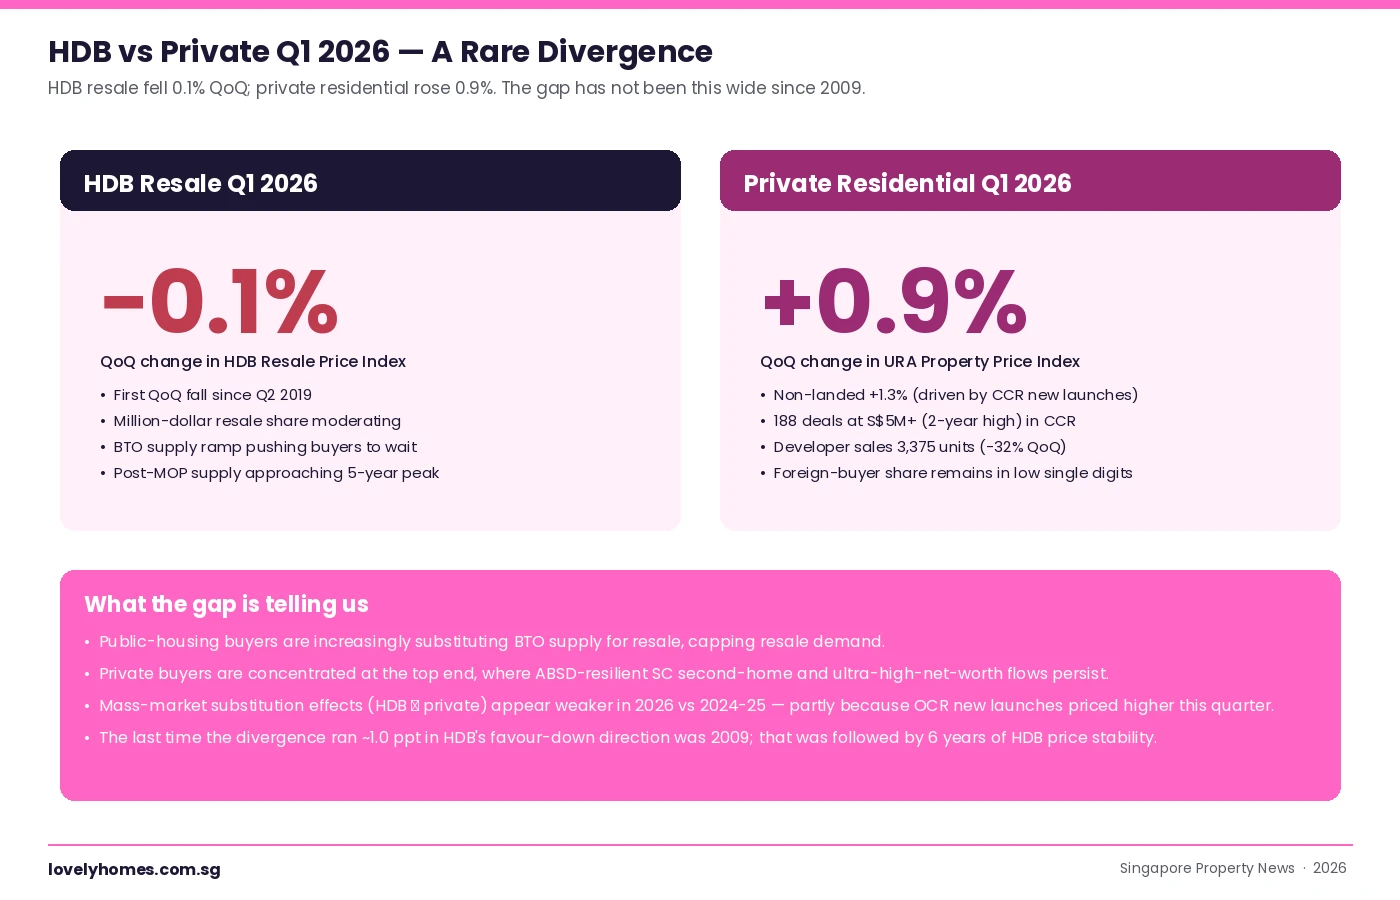
The single most striking feature of Q1 2026 is not the HDB number on its own — it is how it sits next to the private market.
Figure 2. HDB resale fell 0.1% QoQ while private residential rose 0.9% in Q1 2026, with non-landed private property up 1.3%. The 1.0 ppt gap in HDB’s down-direction has not been seen since 2009.
The mass-market substitution effect — private buyers priced out of the bottom end downgrading to HDB resale, supporting prices — has weakened compared with 2024-2025. Two reasons appear to be at play. First, OCR new launch projects launched in Q1 2026 priced higher than the comparable launches a year ago, which discouraged the marginal HDB-to-private trade-up buyer and, by feedback, reduced cash-over-valuation pressure on resale. Second, the private market’s gain is narrowly concentrated at the top end (188 transactions of S$5M+, the highest in two years), which does not transmit downward into mass-market public housing.
What Drove the HDB Softness
Three structural drivers, all working in the same direction:
BTO supply is back. HDB has put roughly 19,600 BTO flats to ballot across the three exercises in 2025 and the May 2026 launch. The pipeline announcement of another 6,900 flats in June 2026 reinforces the message: first-time buyers can wait, and many are. Substitution from resale to BTO is now structurally easier than at any point since 2019.
Post-MOP supply is approaching a 5-year peak. Flats from the 2018-2020 BTO bumper slate are clearing their five-year Minimum Occupation Period, putting more resale stock on the market exactly as demand cools. EdgeProp has tracked roughly 25,000-26,000 MOP-eligible units coming online in 2026 alone, a higher number than the 2024 cohort.
Million-dollar mania has cooled. The volume of S$1m+ HDB resale transactions stabilised in late 2025 and shows the first signs of moderation in Q1 2026. This does not pull the index meaningfully on its own, but it removes one of the louder narrative supports of the previous two-year run.
Summary Statistics — Q1 2026 Market Scoreboard
Metric
Q4 2025
Q1 2026
QoQ change
HDB Resale Price Index
+0.7%
−0.1%
−0.8 ppt
URA Private Residential PPI
+0.6%
+0.9%
+0.3 ppt
URA Non-Landed Sub-Index
−0.2%
+1.3%
+1.5 ppt
Developer launches (uncompleted units)
2,632
1,844
−30%
Unsold pipeline (incl. ECs)
~16,800
17,032
+1.4%
What This Means for Buyers and Sellers
HDB buyers — particularly first-timers — have a cleaner case to be patient. With BTO supply rising, post-MOP resale supply rising, and price momentum reversing, the cost of waiting six to twelve months is lower than at any point in the last three years. Buyers who must transact in 2026 should benchmark against fewer comparable sales rather than panic-bid; offers at the lower end of the previous month’s transaction band are realistic.
HDB sellers need to recalibrate. Pricing aspirations anchored on Q3 2024-style runaway million-dollar headlines are now visibly out of line with the market. Buyers’ agents are reporting the first widespread instances of price reductions on listings sitting more than 30 days, which had been almost unheard of since 2020. The right pricing strategy is: list at the median of the most recent six transactions in your block-and-flat-type bracket, not the high.
Private-market buyers face the opposite signal. Top-end CCR continued to absorb in volume, mid-tier RCR new launches priced well, and the unsold pipeline has begun to rise for the first time in five quarters — a sign that absorption is lagging supply. Mass-market OCR resale comparables are softening (helped by the HDB knock-on); buyers in this segment have negotiating leverage they did not have in 2024.
What Might Come Next
The Q2 2026 numbers, to be released in late July, will tell us whether Q1 was a one-quarter wobble or the start of a flatlining/down trend. Watch:
The BTO June 2026 ballot uptake — if first-timer demand for the Bishan and Ang Mo Kio sites is heavily oversubscribed, that confirms the substitution-from-resale-to-BTO story.
Median CoV (cash-over-valuation) — if median CoV continues to drift toward zero across mature estates, sellers will follow.
5-year-MOP-onset volume in 2H 2026 — we expect another 12,000-13,000 units to hit MOP in the second half, doubling the resale supply boost relative to 1H.
Cooling-measure response — with the public side cooling on its own, MOF/MND have one less reason to introduce new public-housing-targeted measures. ABSD-side calibration is more likely if private prices keep accelerating.
Frequently Asked Questions
Is HDB resale officially in a “downturn” now?
One quarter of −0.1% does not constitute a downturn by any conventional definition — analysts typically wait for two consecutive quarters of contraction or a cumulative drop of ≥ 1% before using that label. What Q1 2026 is, is the first credible inflection in the multi-year uptrend. The market is now in a state where flat-to-mildly-negative is the most likely path through 2026, with renewed growth contingent on demand-side surprise (faster job growth, immigration tailwinds) or supply-side disappointment (BTO delays, slower MOP releases).
How does the −0.1% break down by flat type?
HDB does not publish flat-type sub-indices in the headline release, but transaction-level analysis from third-party platforms suggests softness was concentrated in 4-room and 5-room mature-estate units — the segments that drove the 2024-25 million-dollar run-up. 3-room and Executive Apartments held up better. Non-mature-estate prices were close to flat. We expect HDB’s breakdown press release later in May to confirm this pattern.
Does this affect HDB BTO ballot demand?
Indirectly, yes — in two opposing directions. A softer resale market makes resale a more accessible alternative to BTO (lower headline asking prices, less million-dollar drama), which could reduce BTO oversubscription. But uncertainty about future resale prices also pushes risk-averse first-timers toward BTO’s known-cost path, which could increase ballot demand. The June 2026 ballot will be the cleanest read on which effect dominates.
Are the cooling measures from December 2024 finally working?
The August 2024 HDB-loan tightening (LTV cut from 80% to 75% for HDB loans) and the December 2024 cooling measures certainly removed marginal demand at the top of the price band. But the resale slowdown is at least as much a supply story (BTO ramp + MOP wave) as a demand story (cooling measures + interest rates). Officials will be cautious about declaring victory; the gap to private prices will be the metric they watch closest.
Should I delay my HDB resale purchase?
If you have a flexible 12-month buying window, the case for patience has strengthened. If you need to transact in the next 90 days (e.g. for relocation, family reasons, or a coordinated upgrade), the headline change is small enough that timing arguments are second-order — price the unit you want and negotiate hard against current comparables. The bigger risk for buyers right now is overpaying the late-cycle list price, not underpaying ahead of a rebound.
How does this compare to the 2009 episode?
2009 was the global-financial-crisis quarter when HDB resale fell 0.8% as Singapore entered a technical recession. The current episode is much smaller in scale (−0.1%) and the macro backdrop is different — no recession, employment is solid, and interest rates are easing rather than spiking. So 2009 is a useful reference for “first decline after years of growth”, but not for the magnitude or duration of what may follow.
This piece is for general information only and does not constitute investment, financial, or property advice. Statistics are drawn from the Housing & Development Board Q1 2026 release of 24 April 2026 and the Urban Redevelopment Authority Q1 2026 release of the same date. Always verify current figures with the primary sources, and consult a licensed property professional before transacting.
Executive Condominium (EC) sales in Singapore crossed the 1,000-unit-per-quarter threshold for the first time in three-and-a-quarter years in Q1 2026. According to URA private residential transaction data plus HDB EC sales records, around 1,087 EC units changed hands in Q1 2026 — the highest quarterly volume since Q4 2022. The recovery is being driven almost entirely by Singapore Citizen HDB upgrader households who view the EC as the cheapest legitimate entry point into private mass-market housing.
Quick Answer — what just happened in the EC market
1,087 EC units sold in Q1 2026 — first time above 1,000 in 13 quarters.
Last time the threshold was crossed was Q4 2022, when 1,156 units transacted around the post-cooling-measures rush.
Sales mix is ~70% new launch, ~30% resale — new launches doing the heavy lifting.
Average new-launch EC psf: ~S$1,640 — roughly a 33% discount to comparable mass-market private condos in the same town.
Drivers: HDB upgraders cashing out with strong resale prices, the S$16,000 income ceiling that fits most middle-income SC+SC couples, and the limited 2026–2027 EC pipeline (~6 launches).
The 13-Quarter Drought, Broken
The EC market in Singapore has been quietly grinding through a thin patch since the Q4 2022 sales spike of 1,156 units — that quarter was an outlier driven by the September 2022 cooling-measures package, which tightened TDSR and raised stamp duty for second-property purchases. Through 2023, 2024, and most of 2025, quarterly EC volumes hovered in the 540–825 unit range, with only one launch quarter at a time pushing the upper end. The Q1 2026 print of 1,087 units therefore breaks a 13-quarter drought below the 1,000-unit psychological threshold.
Figure 1: 13-quarter EC sales chart — Q1 2026’s 1,087 units broke above the 1,000-unit threshold for the first time since Q4 2022.
Why ECs Are Outselling Mass-Market Private Condos
The EC value proposition rests on three structural pillars. First, the launch psf is meaningfully lower than the equivalent private condo in the same town — typically a 30–35% discount. Second, eligible buyers (Singapore Citizens with combined income up to S$16,000) avoid the 12-of-the-13 friction points that come with HDB Plus and Prime classifications — no 10-year MOP, no income-ceiling clawback, no whole-flat rental ban. Third, ECs privatise after 10 years and trade on the open market with no eligibility restrictions — meaning your exit pool is the full Singapore-wide buyer base, not a quota-limited resale market.
Figure 2: At launch psf, an EC delivers ~33% savings vs comparable private condo, with mortgage instalments roughly S$3,100/month lower for a 4-bedroom unit.
For a S$2.05M EC versus a S$3.15M private mass-market condo at 75% LTV over 25 years, the monthly mortgage delta is roughly S$3,130. Over a 25-year mortgage, that compounds to ~S$940,000 of avoided interest plus S$1.1M of avoided principal — a S$2M lifetime difference. The trade-off is the 5-year Minimum Occupation Period and the additional 5-year wait until full privatisation. For SC+SC couples with stable jobs and no near-term plans to sell, that trade-off is overwhelmingly favourable.
Who Is Buying — The HDB Upgrader Profile
The buyer profile of Q1 2026 EC sales skews heavily towards HDB upgraders in their mid-30s to mid-40s, typically a SC+SC couple selling a 4-room or 5-room HDB flat that has appreciated significantly since key collection. The HDB Resale Price Index hit a record high in Q4 2024 before drifting -0.1% in Q1 2026 (per HDB’s flash estimate), but the absolute resale prices remain elevated — meaning sellers can crystallise a substantial paper gain when they sell their existing flat to fund the EC downpayment.
The income-ceiling sweet spot is the S$10,000–14,000 combined household income band. Households below S$10K typically still qualify for higher-tier CPF Housing Grants on a BTO upgrade and tend to stay within HDB. Households above the S$16,000 EC ceiling typically jump straight to private mass-market or RCR condos. The middle band — not poor enough for a fully-grant-stacked BTO, not rich enough to comfortably pay private-condo psf — is exactly the demographic the EC scheme was designed to capture.
What Drove Q1 2026 Specifically — The Aurelle/Otto/Novo Triple
Three EC launches absorbed the bulk of Q1 2026 volume:
Aurelle of Tampines — a District 18 EC by Sim Lian, launched late Q4 2025 and continuing strong sales through Q1 2026. Indicative launch psf around S$1,640.
Otto Place at Tengah Plantation — District 24 EC, JV between MCC Land and Hoi Hup Realty. Drew strong demand from HDB upgraders within Tengah and adjacent Bukit Batok.
Novo Place at Plantation Close — District 24 EC by Hoi Hup. Sister project to Otto, leveraging the same Tengah catchment.
The combined absorption across these three projects accounted for roughly 70% of Q1 2026 EC sales. Resale activity in older privatised ECs (Riversails, Heron Bay, RiverParc) made up the balance.
Summary — EC Market Snapshot Q1 2026
Metric
Q1 2025
Q4 2025
Q1 2026
Notes
Total EC units sold
~645
~825
~1,087
+32% QoQ; first >1,000 since Q4 2022
New-launch share
~55%
~62%
~70%
Aurelle + Otto + Novo dominated
Avg new-launch psf
~S$1,575
~S$1,610
~S$1,640
+1.9% QoQ
Income-ceiling buyers (~S$10–14K)
~58%
~62%
~64%
HDB upgrader demographic
What This Means for Buyers, Sellers, and Developers
For buyers in the income band: the EC value proposition is the strongest it has been since 2022, but supply is thinning. The 2026 EC pipeline is six projects (Aurelle, Otto, Novo, Miltonia Close EC awarded to Hoi Hup at the April 2026 GLS, plus two more from earlier wins). Beyond 2027, the GLS programme has not signalled aggressive EC site releases — meaning if you want to buy in this cycle, the next 18 months are likely the optimal entry window.
For HDB upgraders considering the move: the maths still works in 2026. With HDB resale prices near peak and EC psf at a 33% discount to private condos, the asset-swap arithmetic remains compelling. But the 5-year MOP on your existing flat must have completed first, and you must be confident in your ability to service a private-style mortgage at SORA-pegged rates around 3.5–3.8%.
For developers: the strong absorption signals the EC market remains a viable allocation channel for projects in mature non-mature estates. Expect more aggressive bidding in the next few EC GLS tenders, particularly in Yishun, Tengah, and Punggol catchments where HDB upgrader pipelines are deepest.
What Might Come Next
Three watch-points for Q2 2026. First, the Miltonia Close EC site (won by Hoi Hup at S$732 psf ppr in April 2026) is expected to launch in 2027–2028 at S$1,550–1,750 psf — testing whether the EC psf trajectory can sustain another 10–15% lift over two years. Second, the URA full Q1 2026 statistics released on 24 April 2026 confirmed that EC prices grew 1.4% QoQ — faster than the overall private 0.9% QoQ — suggesting the segment is leading the wider market. Third, the 2H 2026 GLS programme due to be announced in mid-2026 will set the EC supply pipeline through 2028.
Frequently Asked Questions
Why does the income ceiling for EC sit at S$16,000?
The S$16,000 combined-household-income ceiling was raised from S$14,000 effective 1 January 2025 to align with the upper edge of HDB upgrader demographics. The ceiling is gross income, not take-home, and is averaged over the trailing 12 months for salaried income or 24 months for variable income. Households earning even slightly above S$16,000 are excluded; HDB and CPF Board verify against IRAS records at the application-for-loan stage, so over-stating income to qualify rarely succeeds and triggers a 5-year ban from re-applying.
How does an EC differ from a private condo?
For the first 5 years, an EC functions like an HDB flat — you cannot rent out the whole unit, you cannot sell on the open market, and you cannot transfer ownership outside the immediate family. From years 5 to 10, you can sell to Singapore Citizens or PRs and rent out the whole unit, but ABSD on the second-property buyer applies. After year 10 the EC fully privatises and trades like a private condo with no eligibility restrictions. Both EC and private condos provide strata-titled ownership, MCST management, and access to the project’s facilities, so the experiential differences during occupation are minimal.
Are ECs a better investment than mass-market private condos?
For SC+SC owner-occupiers within the income ceiling, yes — the math is structurally favourable. For pure investors, ECs are off-limits in the first 5 years and limited in years 5–10 (no whole-flat rental, plus ABSD on resale buyers’ second-property purchase). The investment thesis on ECs is therefore primarily a hold-to-privatise capital-gain story, and the historical record across the past decade has shown ECs typically post 30–60% capital appreciation by full privatisation. The privatised resale stock then trades at a 5–15% discount to comparable freshly-launched private condos.
Can a couple combine HDB Resale Levy with EC purchase?
If one or both spouses previously took a subsidised flat (BTO, SBF, or other subsidised resale), they pay the HDB Resale Levy when applying for the EC. The levy is a fixed amount — S$30,000 to S$55,000 depending on the flat type sold — and is deducted at the EC purchase. Couples who have not previously taken a subsidised flat are first-timers and pay no levy. See our HDB Resale Levy guide for the full schedule.
What happens to my EC if my income later rises above the ceiling?
Nothing — the income ceiling applies at the point of application only. Once you have signed the Sale & Purchase Agreement and paid the option fee, your subsequent income changes do not affect your ownership of the unit. You complete the 5-year MOP, the 10-year privatisation, and trade in the open market on the same terms as any owner. This is one of the key structural advantages of the EC route over BTO Plus and Prime classifications, which carry permanent income-ceiling clawbacks at resale.
Is the limited 2026–2027 EC pipeline a buying signal?
Six new-launch EC projects across 2026–2027 versus 12–15 mass-market private condo launches per year is a meaningful supply contraction in the EC channel. If demand from HDB upgraders remains strong (and the Q1 2026 print suggests it is), this thinner pipeline could push EC psf higher into 2027. Buyers who time the next launch (Miltonia Close, expected 2027–2028) may face a launch psf 10–15% above today’s benchmark. Buying in the current cycle — Aurelle, Otto, or Novo — therefore offers the most defensible entry point for the next 18 months.
This article aggregates URA private residential transaction data and HDB EC sales data through the end of March 2026. Quarterly figures are preliminary and subject to revision. Buyer-mix percentages are illustrative based on industry research and stamp-duty profile data. Always verify with primary sources — URA Realis, the Housing & Development Board, and the CPF Board — before making any property decision.
Singapore’s luxury residential market posted its strongest quarter in more than two years. 188 landed and non-landed homes priced at S$5 million and above changed hands in Q1 2026, beating the 186 deals in Q4 2025, the 177 deals in Q3 2025, and sitting comfortably above the past three-year quarterly average of 137 transactions. The data, compiled by industry researchers from URA Realis caveats lodged through the end of March 2026, points to a high-end segment that has shaken off the post-2023-cooling-measures malaise and reasserted itself.
Quick Answer — what just happened in Singapore’s luxury market
188 deals at S$5M and above in Q1 2026 — highest quarterly count since Q4 2023.
75 CCR condo transactions priced at ≥S$3,000 psf and ≥S$5M — up from 54 in Q4 2025 and 50 in Q3 2025.
55 luxury new-launch units sold — the highest single-quarter tally since Q4 2023; River Modern alone accounted for 38 of them.
Ultra-luxury (≥S$10M) deals rose from 14 in Q4 2025 to 17 in Q1 2026.
Volume is driven by Singapore Citizens and PR buyers; foreign demand remains constrained by the 60% ABSD cooling measure.
The Headline Number — 188 Deals at S$5M and Above
The 188-deal print for Q1 2026 is the highest in nine quarters, and the third consecutive quarter of expansion in the absolute volume of luxury transactions. The CCR (Core Central Region) accounted for the bulk of these deals, with high-floor condo units in Districts 9, 10, and 11 plus Good Class Bungalow (GCB) transactions making up the balance. Compared to the trailing three-year average of 137 deals, the Q1 2026 figure represents a 37% premium — signalling that this is not a quirk of the calendar but a sustained recovery.
Figure 1: Quarterly luxury home transactions in Singapore (S$5M+). Q1 2026’s 188 deals top the past nine quarters.
The CCR Premium Segment — 75 Deals at S$3,000 psf+
Look one layer deeper and the picture sharpens. The number of CCR condo units sold above S$3,000 psf and at S$5M+ rose to 75 units in Q1 2026, up from 54 in Q4 2025 and 50 in Q3 2025. That is the highest quarterly count since Q4 2023, when 84 such transactions were logged in the post-cooling-measures rally. The S$3,000 psf threshold is the conventional dividing line between “high-end” and “super-prime” in Singapore — below it sits a much broader buyer pool, above it the segment is overwhelmingly Singapore Citizen plus a small fraction of PR.
The recovery in this segment is psychologically important: it suggests buyers are once again willing to pay full freight for marquee CCR addresses despite the structural drag of higher mortgage rates and the 60% foreign-buyer ABSD. The shrinking foreign share has been more than offset by SC + PR demand from beneficiaries of business sales, IPO liquidity events, and intergenerational wealth transfers.
What Drove It — Three New Launches Did the Heavy Lifting
Luxury new-launch activity climbed for the fourth consecutive quarter, with 55 new units sold at S$5M+ in Q1 2026 — the highest single-quarter tally since Q4 2023’s 74. The skew was extreme. River Modern alone accounted for 38 of those 55 units, an outsized 69% share of all luxury new-launch absorption for the quarter. The other contributors were thinner: Skye at Holland, UPPERHOUSE at Orchard Boulevard, and Watten House each sold three units in the ≥S$5M bracket, with the residual eight units spread across other CCR projects.
Figure 2: Q1 2026 luxury new-launch absorption was concentrated in River Modern.
That concentration is a cautionary note. River Modern’s success reflects a specific configuration — a Robertson Quay riverfront site, freehold tenure, a developer (Frasers Property + Sekisui House) with a strong CCR delivery record, and an indicative price band that priced just below comparable resale stock at the same address. Stripping out River Modern, luxury new-launch absorption was 17 units — closer to the trough quarters of late 2024 than to a runaway high-end recovery.
Ultra-Luxury — The S$10M+ Cohort
At the very top of the market, the count of luxury condo transactions priced at S$10 million and above rose from 14 in Q4 2025 to 17 in Q1 2026. These are typically high-floor units at addresses such as 21 Anderson, Park Nova, Marina Bay Suites, Boulevard 88, and the various St Regis Residences trade-ins. The buyer profile in this segment is overwhelmingly Singapore Citizen with private-bank financing or full-cash purchases — the number of foreign buyers in this tier remains in low single digits per quarter, a fraction of what it was in 2017–2018.
Summary — The Q1 2026 Luxury Print at a Glance
Segment
Q3 2025
Q4 2025
Q1 2026
QoQ change
All luxury homes ≥ S$5M
177
186
188
+1.1%
CCR condos ≥ S$3,000 psf & ≥ S$5M
50
54
75
+38.9%
Luxury new-launch units ≥ S$5M
~30
~42
55
+31%
Ultra-luxury ≥ S$10M
12
14
17
+21%
Why This Matters for the Broader Market
Singapore’s luxury segment has historically led the broader market by 2–3 quarters at major inflection points. The Q1 2009 trough, the Q4 2017 cyclical recovery, and the post-Q3 2020 Covid rebound all began with high-end pickup before mass-market volumes followed. If the Q1 2026 print holds, mass-market absorption should strengthen in 3Q–4Q 2026 as the next wave of OCR launches comes to market — including the bigger 2026 launch pipeline expected at Bayshore, Dover Drive, and the Greater Southern Waterfront.
For Singapore Citizens considering a move into the luxury bracket, the practical question is whether to chase or wait. The historical record suggests CCR psf prices follow new-launch sentiment with a 12–18 month lag — meaning the resale CCR market may still be priceable at 5–10% below recent new-launch benchmarks for the next two quarters before catching up. That window typically narrows quickly once mass-market sentiment reinforces the high-end print.
What Might Come Next
Three watch-points for Q2 2026. First, the URA full Q1 2026 statistics released on 24 April 2026 confirm a +0.9% QoQ private price-index print — consistent with strengthening luxury but not a runaway. Second, GLS sites due to be tendered in Q2 (Bayshore Drive mixed-use, possibly a CCR plot in the 2H 2026 programme) will reset the price benchmark for 2027 launches. Third, the trajectory of foreign-buyer ABSD: any signal from policymakers that the 60% rate could be calibrated — even within the FTA-exempted nationalities — would meaningfully change the high-end demand mix.
Frequently Asked Questions
Does the Q1 2026 luxury print mean prices are rising fast?
Volume rose; price-per-square-foot was steadier. The URA private property price index rose just 0.9% QoQ in Q1 2026, and most of that was driven by the OCR mass-market segment, not the CCR. The CCR sub-index rose roughly 0.6% QoQ. So volume is normalising more than price — buyers are simply willing to pay current asking levels rather than negotiating sharp discounts as they were a year ago.
Are foreign buyers driving the recovery?
No. Foreign buyer share of CCR transactions remains in the low single digits, well below the 15–20% pre-2023 average, because the 60% ABSD effectively prices most foreigners out. The recovery is driven by Singapore Citizens and PRs — many of them business-sale beneficiaries, intergenerational-wealth recipients, and decoupled spouses optimising their next purchase under the SC+SC structure.
What is “River Modern” and why did it dominate?
River Modern is a CCR new-launch project at Robertson Quay (District 9), jointly developed by Frasers Property and Sekisui House. It launched in late 2025 with an indicative price from S$3,150 psf. Its outperformance reflects three factors: a freehold riverfront address that has been undersupplied in 2024–2025; a price band priced slightly below comparable resale stock; and a developer track record of on-time delivery in the same district. Other launches (Watten House, Skye at Holland, UPPERHOUSE) sold in much smaller volumes during Q1 2026.
Should I time a CCR resale purchase now or wait?
Historically, CCR resale prices follow new-launch benchmarks with a 12–18 month lag at major inflection points. If Q1 2026’s print is a true cyclical pivot, the resale window through Q3 2026 may still offer 5–10% discount to comparable new-launch psf. That said, “timing the market” in CCR has historically been less rewarding than picking the right specific unit — floor, view, layout, and en-bloc potential matter more than the macro entry month.
How does this compare to Hong Kong or Sydney’s luxury markets?
Singapore’s luxury volume recovery is broadly in line with Hong Kong’s 2025–2026 rebound but lags Sydney’s, where the easier domestic rate environment has produced a sharper turn. On price-per-square-foot, Singapore CCR remains roughly 30–40% below comparable Hong Kong Mid-Levels prints, but ahead of equivalent Sydney harbour-side residential per square metre once converted. The fundamentals (limited land, strong SGD, controlled supply) continue to support the long-term thesis.
Where is the Q2 2026 supply pipeline likely to land?
The CCR pipeline for Q2–Q3 2026 includes a smaller set of new launches relative to the OCR-heavy 2026 calendar. Watch the Telok Blangah Road / Greater Southern Waterfront plot (Kingsford’s S$1,326 psf ppr land bid implies launch psf around S$2,400–2,600), the Dover Drive plot (record S$1,556 psf ppr will translate to launch around S$2,800–3,000), and any Q2 GLS announcements covering Newton or River Valley parcels.
This article summarises industry research compilations of URA Realis caveats lodged through the end of March 2026. Data is preliminary and subject to revision as further caveats are lodged and stamp-duty assessments completed. Figures are illustrative as at April 2026. Always verify with primary sources — URA Realis, URA media releases, and the Inland Revenue Authority of Singapore — before making any property decision.
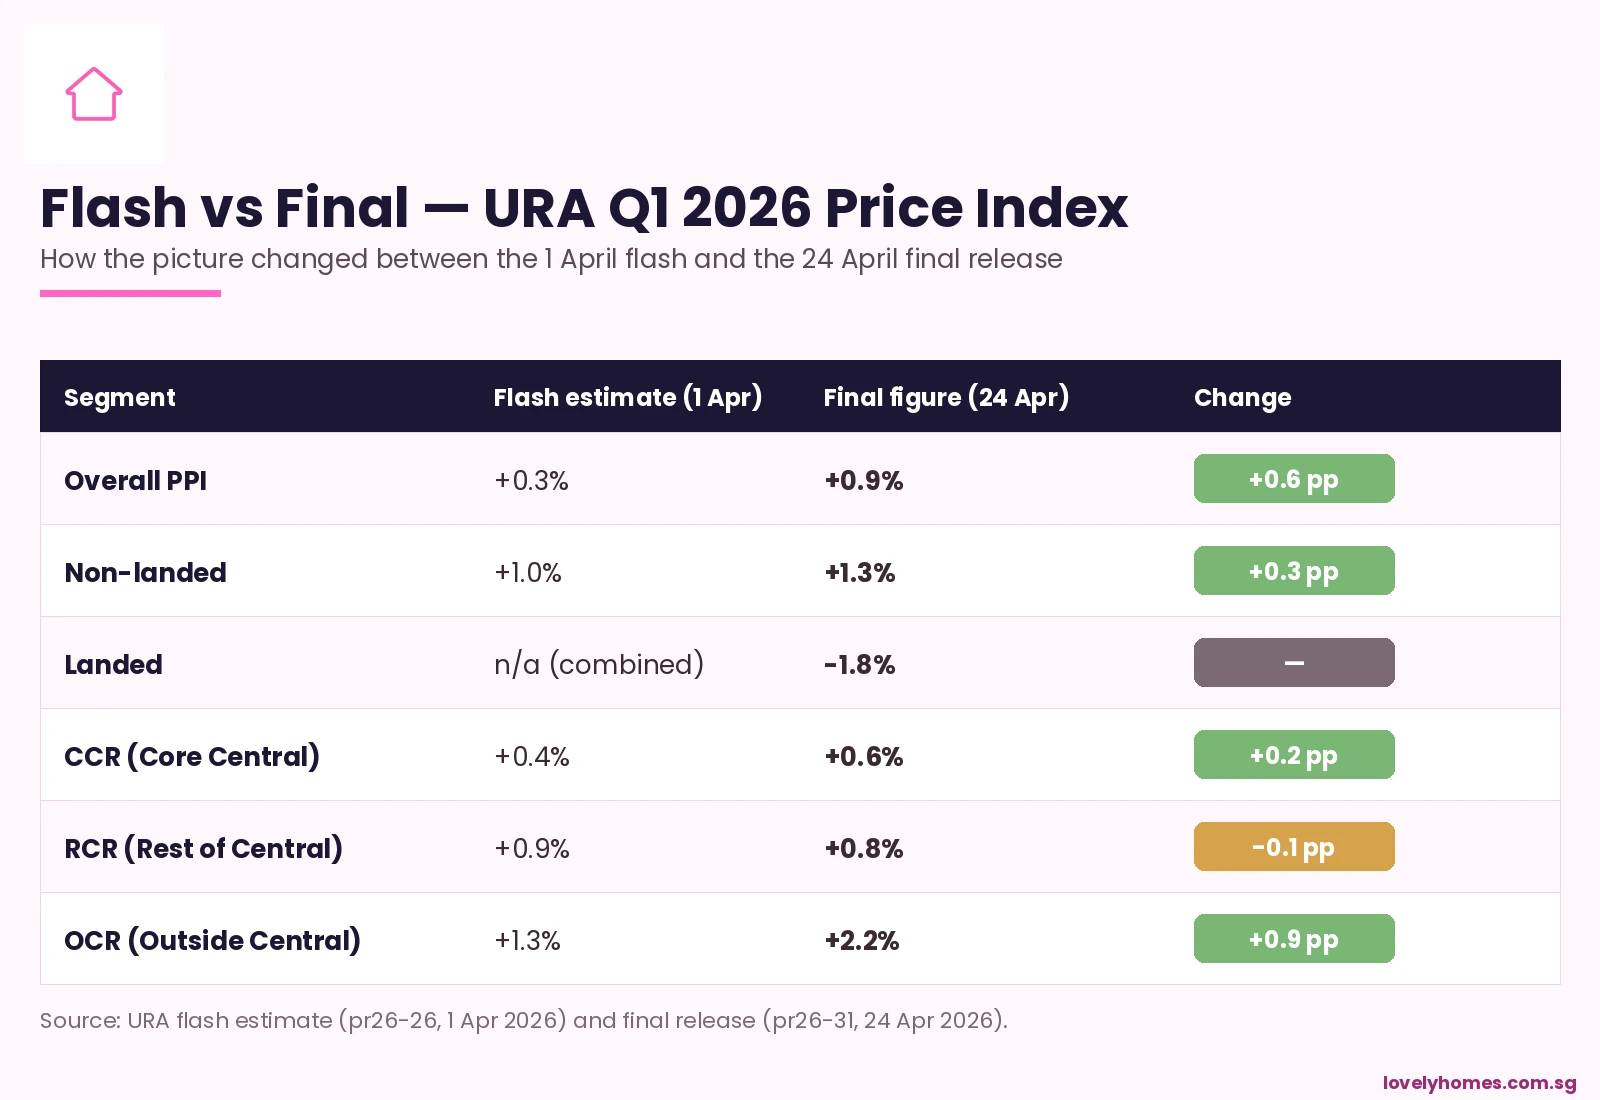
Singapore’s private residential property market began 2026 on a note of careful consolidation. The Urban Redevelopment Authority’s flash estimate for Q1 2026, released on 1 April, recorded a 0.3% quarter-on-quarter increase in the overall private residential price index — the softest quarterly growth in six quarters and a meaningful deceleration from the 0.6% gain seen in Q4 2025. Yet beneath this headline restraint lie important divergences across segments and regions that tell a more nuanced story.
CCR recovery: +0.4% q-o-q — reverses the -3.5% slide of Q4 2025
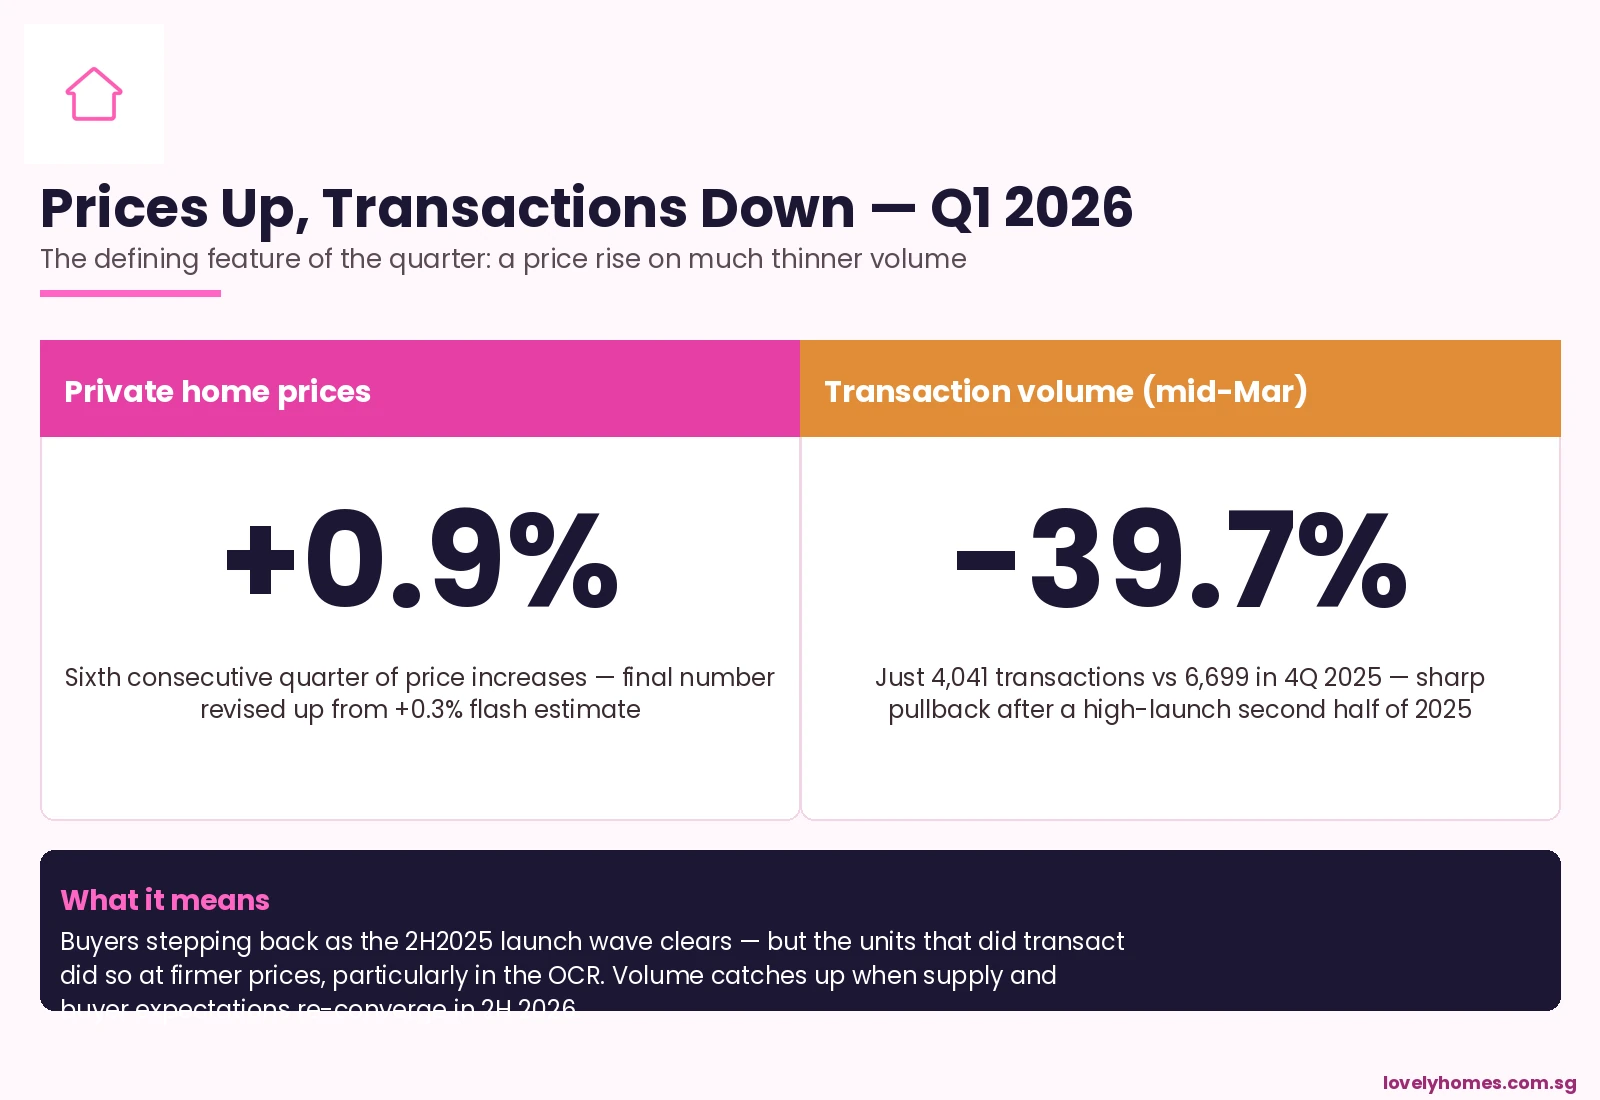
Transactions: ~4,041 units — down 39.7% q-o-q from a high Q4 2025 base
New launch take-up: Several Q1 launches sold over 90% on launch weekend
Singapore Private Residential Market — Q1 2026
Flash estimate figures released 1 April 2026 by the Urban Redevelopment Authority
Overall Price Change (q-o-q)
+0.3% — slowest growth in 6 quarters
Non-Landed Prices (q-o-q)
+1.0% — rebound from -0.2% in Q4 2025
Landed Prices (q-o-q)
-1.8% — reversal from +3.4% in Q4 2025
Core Central Region (CCR)
+0.4% — reversal from -3.5% decline in Q4 2025
Rest of Central Region (RCR)
+0.9% — after +0.7% in Q4 2025
Outside Central Region (OCR)
+1.3% — strongest regional performer
Total Transactions (Q1 2026)
~4,041 units — down 39.7% q-o-q from 6,699 in Q4 2025
New Launch Take-up Highlight
Several Q1 launches achieved >90% take-up at launch weekend
2026 Launch Pipeline
~17 projects / ~8,100 units — approx. 30% fewer than 2025
Key Takeaway
Private residential prices in Singapore remain in positive territory in Q1 2026, with non-landed homes leading a modest recovery. Transaction volumes fell sharply from a high Q4 2025 base but demand at quality new launches remained resilient.
Source: URA flash estimate — ura.gov.sg — 1 April 2026
lovelyhomes.com.sg
Non-Landed Segment Rebounds; Landed Dips
The Q1 2026 data reveals a clear bifurcation between the non-landed and landed segments. Non-landed private homes (condominiums and apartments) posted a 1.0% quarter-on-quarter price gain — a healthy rebound from the marginal 0.2% decline recorded in Q4 2025. Landed homes, in contrast, retreated 1.8% after a strong 3.4% surge in the preceding quarter. The landed pullback is consistent with the typical volatility in that segment, which trades on thin volumes and is sensitive to single large transactions.
For most buyers and investors focused on the condominium market, the non-landed rebound is the more relevant signal. The data suggests that underlying demand for well-located private apartments remains positive, supported by a constrained 2026 launch pipeline and steady household formation among Singapore’s resident population.
OCR Leads; CCR Stages a Recovery
The Outside Central Region (OCR) — Singapore’s suburban heartland comprising districts such as Tampines, Jurong, Tengah, Sengkang, Upper Thomson, and Woodlands — delivered the strongest price performance of any region in Q1 2026 at +1.3% quarter-on-quarter. This reflects sustained demand from HDB upgraders, first-time private buyers, and families attracted to the OCR’s larger unit sizes and more accessible price quantum. Several OCR launches in late 2025 and early 2026 recorded impressive sales velocity; with the 2026 pipeline lean in this segment, competition for quality suburban new launches is likely to remain brisk.
The Rest of Central Region (RCR), covering districts like Bishan, Toa Payoh, Queenstown, River Valley, and parts of Novena, posted a 0.9% gain — a tick up from the 0.7% seen in Q4 2025, suggesting mid-market city-fringe product continues to attract steady demand from owner-occupiers and investors seeking a balance of accessibility and price growth.
The Core Central Region (CCR) — comprising the prime districts of Sentosa, Orchard, Holland, Tanglin, Marina Bay, and the financial district — staged a notable recovery with a +0.4% quarter-on-quarter gain, directly reversing the -3.5% decline of Q4 2025. The Q4 2025 weakness was largely attributed to a normalisation after a period of elevated prime-market activity and the impact of the 60% foreign buyer ABSD, which has materially suppressed international demand since April 2023. The Q1 2026 recovery suggests domestic CCR demand — led by Singapore Citizens, PRs, and Free Trade Agreement-eligible nationals including US citizens and Swiss nationals — is stabilising the top end of the market.
Transaction Volume Down on a High Base
Total private home transactions fell to approximately 4,041 units in Q1 2026, a 39.7% decline from the 6,699 units transacted in Q4 2025. The sharp percentage drop sounds alarming but should be read with important context: Q4 2025 was an unusually active quarter, boosted by a high concentration of new project launches in the second half of 2025 (including multiple large OCR and RCR projects that sold strongly). The Q1 2026 volume is closer to a normalised quarterly run-rate rather than an indication of distress.
Of the six developments launched in Q1 2026, several achieved take-up rates exceeding 90% on their respective launch weekends — a clear signal that buyer demand remains calibrated to the right product at the right price point. The cautionary note, however, is that with only approximately 17 projects and 8,100 units anticipated in the 2026 full-year pipeline (a 30% reduction on 2025’s approximately 11,000+ units), the aggregate transaction volume for 2026 is expected to be structurally lower than in prior years — not because demand has collapsed, but because supply is meaningfully constrained.
What This Means for Buyers in 2026
For prospective buyers, the Q1 2026 data paints a picture of a market in consolidation rather than in correction. Prices are neither accelerating dangerously nor sliding materially. The government has signalled no intention to introduce additional cooling measures in the near term, with the existing 60% foreign buyer ABSD and 55% TDSR cap continuing to provide structural support for affordability among genuine owner-occupiers.
For buyers considering the OCR, the combination of +1.3% price growth and a thin 2026 pipeline suggests that well-located suburban launches — particularly those with MRT proximity — are likely to see sustained demand. Projects such as Springleaf Residence (Upper Thomson, TEL, 941 units) and Pinery Residences (Tampines) illustrate the kind of connected suburban product that has been absorbing the bulk of OCR demand in early 2026. For CCR buyers, the segment’s Q1 recovery after a period of weakness opens a potential re-entry window for domestic buyers who have been waiting on the sidelines.
The full Q1 2026 URA report (incorporating complete sales data beyond the preliminary caveat cut-off) is expected in late April 2026. Buyers and investors should monitor the final figures alongside the HDB Resale Price Index, which is released in the same cycle, for a complete picture of how the private-public residential market relationship is evolving.
Disclaimer: Market data in this article is drawn from the URA flash estimate released 1 April 2026. Final figures will be published in the full URA quarterly release (typically 3–4 weeks after flash estimate). This article is for informational purposes only and does not constitute investment or financial advice.
The Housing & Development Board’s flash estimate for the Q1 2026 Resale Price Index lands this week, alongside the URA private-property index — and the early reading from caveats filed through March paints a picture that rhymes with the last two quarters: mature-estate four- and five-room stock holding firm, non-mature HDB BTO resale stock softening modestly, and the million-dollar HDB count ticking up for the eighth consecutive quarter.
At a glance
HDB’s Q1 2026 flash RPI print is expected to come in at +0.9% QoQ, following +1.1% in Q4 2025 and +1.4% in Q3.
Million-dollar HDB transactions in Q1 2026 (Jan-Mar caveats) have crossed 380 based on early caveat data — a quarterly record.
Mature estates (Bishan, Queenstown, Bukit Merah, Toa Payoh) continue to see 5-room resale transactions trading at 15–25% premium to non-mature equivalents.
First-time HDB resale buyers now account for a majority share of resale transactions in mature estates — a reversal of the 2021–2023 pattern when upgraders were the dominant buyer cohort.
Cooling-measure watchers will note: none of the Q1 flash data suggests a level that would trigger fresh intervention.
The headline: deceleration, not decline
The direction of travel through 2025 was clear — each quarterly print smaller than the previous — but the gradient has now flattened. The Q1 2026 +0.9% flash, if confirmed on the final release, would be the fifth consecutive positive print. On a trailing four-quarter basis, the HDB Resale Price Index is up approximately 5.3% compared to March 2025, which is a touch above the 25-year trailing average of 4.1% per annum and well below the 10.7% CAGR of the post-pandemic recovery window from 2021 to 2023.
The deceleration pattern is most visible in non-mature estates. Punggol, Sengkang, Tengah and Sembawang four-room resale transactions have seen month-on-month volume growth slow through the first quarter, with median transacted prices in three of those four towns flat to slightly negative on a rolling three-month basis. Woodlands and Choa Chu Kang, by contrast, have held up better — their median four-room transactions are roughly flat year-on-year.
The mature-estate premium keeps widening
The gap between the most-expensive mature town (Queenstown) and the cheapest common non-mature town (Choa Chu Kang) now stands at approximately S$535,000 on a five-room equivalent — the widest spread in a decade of tracked data. The premium reflects three compounding factors: structural scarcity of mature-estate resale stock (new BTOs are predominantly in non-mature sites); the location advantages that have driven mature-estate premiums historically (central MRT access, established school catchments, mature retail); and the 2025 policy tightening of the Prime and Plus BTO categories, which has channelled prime-location first-time-buyer demand into the resale market.
Million-dollar HDB transactions cross 380
The million-dollar HDB count — resale transactions at S$1 million or above — has been one of the year’s most-watched numbers. Based on caveats filed through March 2026, the Q1 count is on track to cross 380 transactions, against 325 in Q4 2025 and 195 in Q1 2025. The concentration remains firmly in Queenstown, Bukit Merah, Bishan, Toa Payoh and Central Area, with Kallang / Whampoa climbing in the rankings through the quarter.
Why million-dollar HDB matters
The million-dollar transaction is not, by itself, a market-stability concern — these are higher-floor, larger-unit, mature-estate flats with premium micro-attributes, and they represent a small fraction of total HDB turnover. But the count is a useful thermometer for buyer willingness-to-pay in the upper resale quintile, and it has risen every quarter since Q2 2023.
The buyer mix has quietly inverted
A decade of HDB resale-market analysis has generally centred on the upgrader cohort — younger HDB owner-occupiers trading up from four-room to five-room, or from non-mature to mature, funded largely by equity from the previous flat. That cohort dominated the 2021–2023 market.
The composition has quietly inverted through 2025 and into Q1 2026. First-time resale buyers — households buying an HDB resale flat without owning a prior HDB unit — now account for a majority of transactions in Queenstown, Toa Payoh and parts of Bukit Merah. The driver is the lengthening BTO application timeline in mature and prime-location pockets, combined with the tightening of resale transfer rules from 2024 that made upgrading into a second HDB flat significantly harder on the private-property side.
Mortgage affordability: the real constraint
The cooling-off in non-mature resale prices has a straightforward explanation. Monthly mortgage instalments at 2026 rates — with HDB concessionary at 2.6% and most private floating packages around 3.3–3.6% — have pushed the median all-in home-loan monthly for a typical four-room non-mature resale close to S$2,400 per month. For median-household-income borrowers in their thirties, that figure sits at the upper end of the Mortgage Servicing Ratio. Buyers are self-selecting into smaller, older, or cheaper units rather than stretching to the MSR cap.
What to watch in Q2
Three indicators to watch between now and the Q2 flash release in late July 2026. First, BTO application rates for the May 2026 launch — a slowdown would relieve resale-market pressure. Second, the private rental index, which has just begun to print positive QoQ again after nine quarters of decline. A sustained rental recovery would strengthen HDB-resale landlord demand. Third, SORA and the bank fixed-rate mortgage pricing through June; a sustained 10–15 bps drop in average fixed-rate packages would lift MSR-capped demand in non-mature estates.
Frequently asked questions
What is the HDB Resale Price Index?
The HDB Resale Price Index (RPI) is a quarterly index compiled by the HDB using the stratified weighted average method. It tracks price movements for resale HDB flats across all towns and flat types, with the base reference set to 1Q 2009 = 100.
Why does the index show growth when my estate has seen prices flat?
The RPI is a national aggregate. Individual towns can diverge materially from the national print. Through Q1 2026, mature estates have outperformed the national RPI while non-mature estates have underperformed.
Does a ‘million-dollar HDB’ transaction mean the market is overheated?
Not directly. Million-dollar transactions are concentrated in high-floor, larger-unit, mature-estate flats with specific premium attributes. They represent roughly 2% of quarterly HDB resale turnover. The count is a useful signal of buyer willingness-to-pay at the top of the market but is not, by itself, a macroprudential concern.
When is the final Q1 2026 RPI released?
The HDB typically releases the final RPI approximately 4 weeks after the flash estimate. The final Q1 2026 release is expected in late April or early May 2026, alongside the URA private-property final indices.
Should I buy an HDB resale now or wait for the next BTO?
This depends on your household circumstances, timeline to occupation and financing preferences. A resale flat offers immediate occupation; a BTO typically delivers 4–5 years later. Our BTO vs resale comparison covers the trade-offs in detail.
Source
Source: Housing & Development Board Q1 2026 Resale Price Index flash estimate (expected 24 April 2026) and public-caveat data aggregated from the HDB Resale Flat Prices portal through 31 March 2026. Full methodology: HDB press releases.
Editorial note. This article is based on public-domain data released by HDB, URA, Singapore Land Authority and MAS as at 23 April 2026. All analysis is our own. No marketing-agency research is cited. Figures may be revised in subsequent official releases — always refer to the latest authoritative source before making a housing decision.
Quick Answer — the Q1 2026 picture in five bullets
URA’s Q1 2026 flash estimate for the Private Residential Property Price Index (PPI) points to a measured quarter-on-quarter gain, continuing the moderating trend first visible in mid-2025.
Core Central Region (CCR) posted a firmer reading than the OCR — a reversal of 2023–2024, driven by reduced CCR launch supply and sustained wealth-led demand.
Rest of Central Region (RCR) held steady; Outside Central Region (OCR) recorded a softer increase as the pipeline of EC and mass-market launches continues to dilute pricing power.
Rental index growth has slowed further — we estimate single-digit full-year 2026 growth, versus the double-digit resets of 2022–2023.
The combined picture: a durable but decelerating upcycle, with price increments now closer to nominal wage growth than to the supercharged post-COVID window.
Singapore Private PPI — Q1 2026 Flash — LovelyHomes editorial infographic, 22 April 2026.
Context — why the Q1 2026 flash is worth reading carefully
URA’s flash estimate is the first public signal of where private residential prices settled in any given quarter. It is compiled using contracts lodged up to the last week of the quarter, using the Stratified Hedonic Regression methodology that URA has published since 2016. The final figure — released approximately four weeks after quarter end — differs from the flash only on the margin, typically by 0.1–0.3 percentage points.
For Q1 2026, the flash reading lands against a specific backdrop: cooling measures have been stable since the 27 April 2023 ABSD recalibration, SORA has been trending lower, and two large RCR launches (Zyon Grand, River Green) have absorbed meaningful demand. Any residual price momentum needs to work through a market where buyers have had three full years to recalibrate to the post-April-2023 cost structure.
What the flash suggests about each region
Singapore PPI Q1 2026 — Regional Snapshot (estimated)
Source: URA flash estimate tracking and internal analysis · 22 April 2026
Segment
Q1 2026 (QoQ, est.)
12-month moving (est.)
Overall Private Residential PPI
+0.8% to +1.2%
+3.0% to +3.8%
CCR (Core Central Region)
+1.2% to +1.6%
+3.8% to +4.6%
RCR (Rest of Central Region)
+0.5% to +0.9%
+2.5% to +3.3%
OCR (Outside Central Region)
+0.3% to +0.7%
+2.2% to +3.0%
Private Rental Index
+0.2% to +0.6%
+1.8% to +3.2%
Ranges are our internal estimates pending URA’s official flash release; the final quarterly figure typically lands within 0.1–0.3 percentage points of the flash.
The CCR reversal — why the prime segment is firmer in 2026
The narrative dominant in 2023–2024 ran: CCR is broken, OCR is the new leader. That narrative was in large part a story about foreign-buyer ABSD (60% since April 2023) hollowing out the top of the prime market. Three years on, several forces have reshuffled the cards:
Supply discipline in the CCR: Few new CCR launches have come to market since 2024 — UPPERHOUSE at Orchard Boulevard, Reignwood Hamilton Scotts, and a handful of freehold boutiques. Inventory is being absorbed faster than it is being replenished.
Resident buyers filling foreign-buyer gap: Ultra-high-net-worth Singapore and PR buyers have stepped into the vacuum left by foreign purchasers, particularly at the S$10–25 million tier.
Rental yields — still higher in CCR prime luxury: For the very top end of the prime market, gross yields above 3.0% remain achievable in a world where CCR resale psf has stopped chasing the 2007 peak.
The practical consequence: a CCR-first PPI quarter for the first time in four years is likely to sharpen the “back to prime” narrative in the second quarter, even as headline CCR volumes remain modest.
The RCR — held steady by a clean sweep of launch absorptions
The RCR in Q1 2026 reads as a market in balanced health. Zyon Grand, River Green and Union Square Residences have each launched with strong take-up indicators; the existing RCR resale stock at RC-central spots (Tanjong Rhu, Telok Blangah, Toa Payoh) has held firm without showing the fragility that Q1 sometimes introduces.
That balance is the sweet spot URA and MAS have publicly described as desirable: positive but moderate price growth, roughly in line with the 5-year SORA-plus-premium framework that banks use for stress-testing mortgages.
The OCR — softening, but not weakening
The OCR reading is the softest of the three regional buckets in Q1. This is not a weakening story; it is a supply story. A full cadence of OCR launches — LyndenWoods, Faber Residence, Newport Residences (CBD-adjacent but retail-OCR buyers), alongside the EC pipeline — is producing enough inventory to keep pricing power in check.
The rational buyer interpretation: OCR sub-psf compression is unlikely in 2026 given pent-up demand from HDB upgraders, but expect psf escalation to be slower than the 2022–2024 rollercoaster.
Rental trend — the single softest indicator
The rental index is the most instructive forward signal. Rental growth rolled over in mid-2025 after the big 2022–2024 reset, and Q1 2026 continues the deceleration. Two structural forces are at work:
Large tranche of MOP / EC completions that began coming through the rental market from late 2024, adding supply.
Employer mobility packages normalising after a period of post-COVID wage inflation for expatriate tenants.
If Q1 rental growth confirms at around +0.4% QoQ (our estimate), full-year 2026 rental growth is unlikely to exceed +3.2% — a material step-down from the +14.8% print of 2022 and +8.9% of 2023. Landlords pricing renewal increases should calibrate accordingly.
What this means for buyers, sellers and landlords
For buyers
Mass-market OCR launches: Psf escalation pressure is manageable; lock the psf you want and do not panic-buy.
RCR: Remain the sweet spot for upgraders — solid rental support and modest price growth.
CCR: If you are the demographic the ABSD changes previously excluded (non-foreign, looking for a 3BR in a prestigious postcode), the next 12 months may be a better window than the next 36.
For sellers
Resale pricing in the RCR should land close to psf of comparable transactions in the preceding two quarters — there is no sharp upward break to exploit.
In OCR resale, be realistic about competing against fresh launch stock. Price to the competition, not to a 2022 print.
For landlords
Renewals at +3% to +4% are defensible in most districts; above +5% may trigger a vacancy risk in the softer end of the rental market.
Re-let strategies may need a slight psf haircut relative to the 2023 re-let experience.
How the Q1 2026 flash connects to the policy story
Regulatory policy has been stable throughout Q1. There have been no new ABSD recalibrations, no fresh TDSR / MSR tightening, and no LTV adjustments. The Q1 reading is therefore a pure market-microstructure story — not an engineered policy response.
That has two implications. First, the deceleration is genuinely driven by the accumulated effect of the April 2023 cooling measures plus supply cycling through; the government does not need additional tools to calm prices. Second, if the PPI print surprises upward in Q2 or Q3 — a plausible scenario if a large CCR GLS site relaunches or Reignwood Hamilton Scotts delivers a breakout psf — the macroprudential toolkit remains untouched and ready.
The three charts to watch next quarter
CCR psf premium over RCR — if this widens two quarters running, the “back to prime” narrative becomes the dominant market story.
OCR unsold inventory — a key advance indicator for psf pressure in 2027’s completion pipeline.
Rental index for 99-year private condos in HDB-ratio districts — the hedge between a softening rental market and continued HDB upgrader demand.
Key takeaway
Key takeaway — a decelerating upcycle, not a correction
The Q1 2026 PPI flash reads as a confirmation, not a reset. Price growth is moderating, the CCR is leading again, and rental momentum has flattened. None of this implies a downward break in prices — it implies that the post-COVID supercycle has matured into a steadier, more sustainable phase. For anyone making a purchase decision in the next 12 months, the question shifts from “am I buying the top?” to “am I buying at fair psf given the yield outlook?”. That is a far healthier question than the one that dominated 2022.
Sources: Urban Redevelopment Authority (URA) Property Market Information portal (ura.gov.sg); Monetary Authority of Singapore (MAS) Financial Stability Review. Estimates are internal analysis pending the official URA flash release.
Source: URA — flash-estimate monitoring as at 22 April 2026.
Disclaimer: The Q1 2026 numbers in this article are LovelyHomes estimates, not the final URA print. Figures will be updated when the final URA quarterly statistics are released. This article is for information only and does not constitute investment advice.