Tanjong Pagar Neighbourhood Guide Singapore 2026: D02 Prices, GSW and Investment Outlook
Quick Answer: Tanjong Pagar (D02) at a Glance
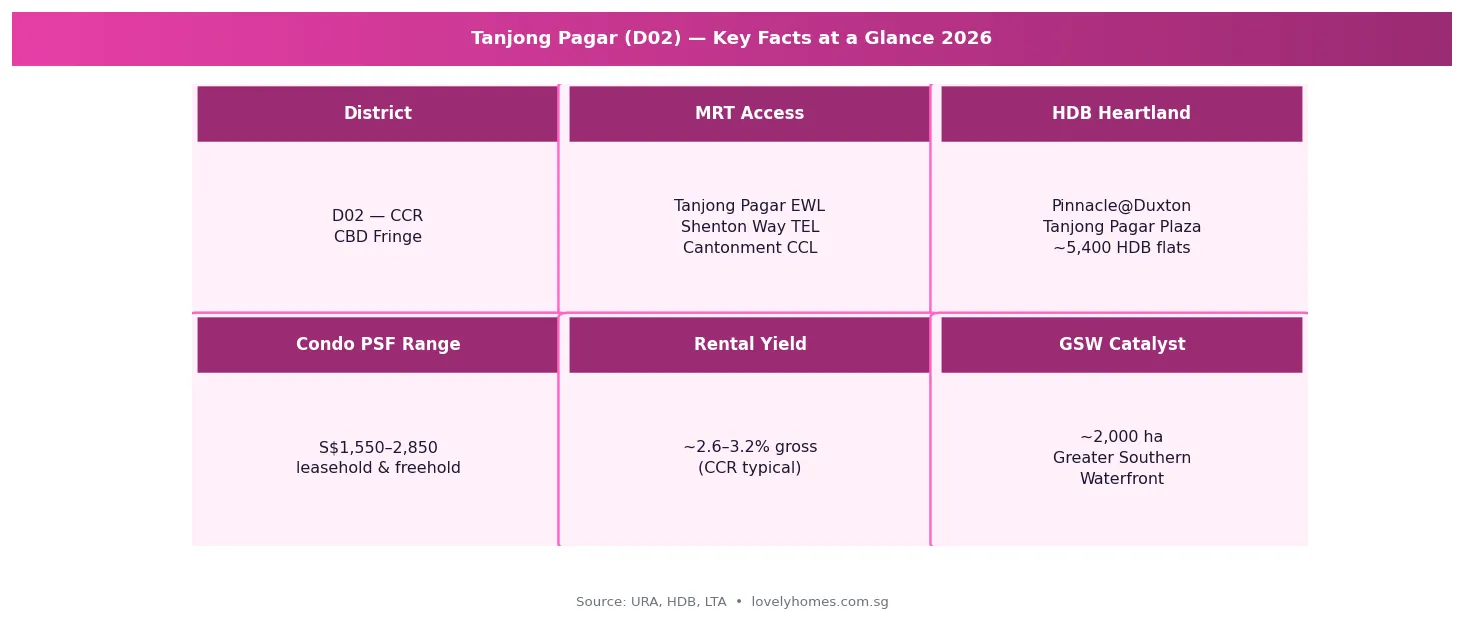
- Location: District 02, Core Central Region (CCR), southern edge of Singapore’s CBD — Chinatown, Tanjong Pagar, Anson Road corridor
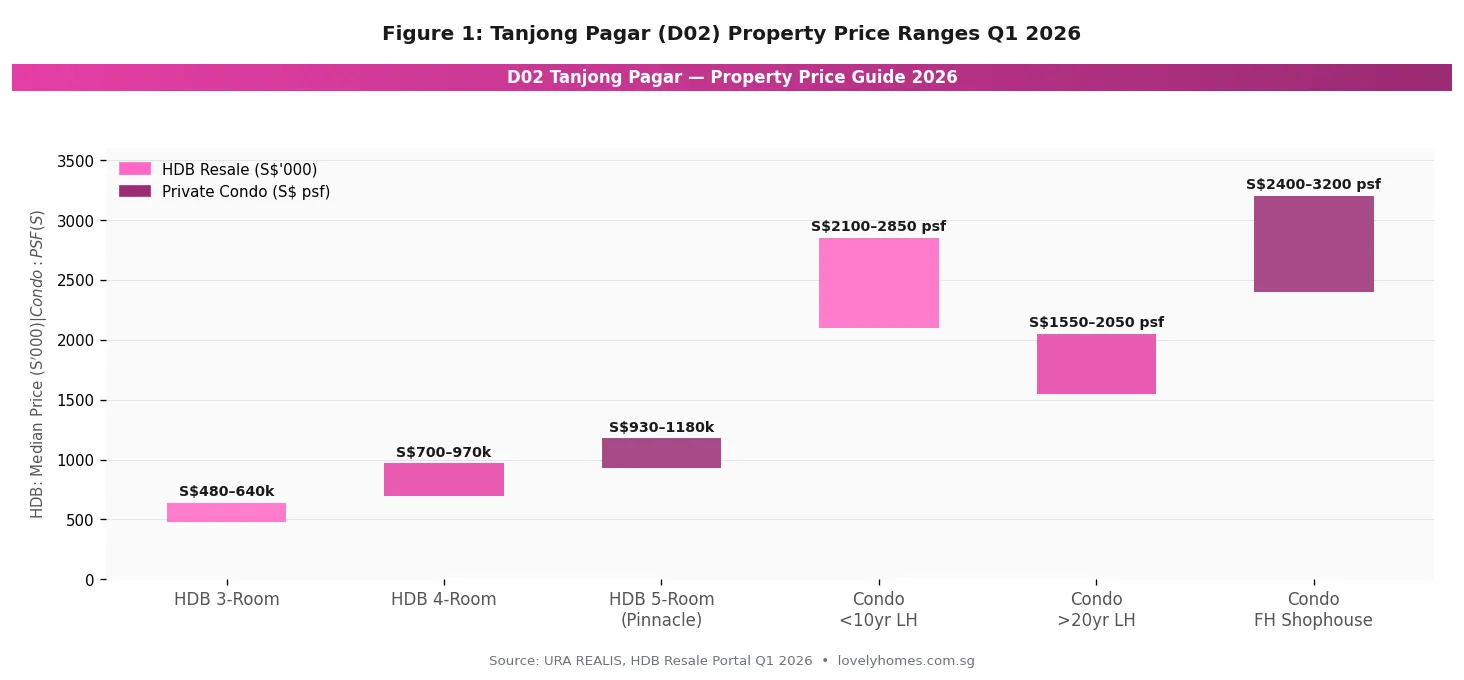
- HDB resale prices (Q1 2026): 3-room S$480k–S$640k; 4-room S$700k–S$970k; 5-room at Pinnacle@Duxton S$930k–S$1.18M
- Private condo PSF: S$1,550–S$2,050 (older leasehold) to S$2,100–S$2,850 (newer/freehold)
- MRT access: Tanjong Pagar EWL (EW15), Shenton Way TEL (TEL17), Cantonment CCL (CC28) — three-line connectivity
- Rental yield: ~2.6–3.2% gross (CCR typical range); stronger for smaller-format units near CBD
- Key catalyst: Greater Southern Waterfront (GSW) — ~2,000 ha of land transformation planned over the next two to three decades
- Who buys here: Expat professionals, CBD workers, upgraders seeking CCR address, investors targeting GSW uplift
- Watch: Supply is thin — no major new private residential GLS in D02 for several years; scarcity premium is real
Tanjong Pagar is one of Singapore’s most layered neighbourhoods. It is at once a bustling CBD business district, a conserved Peranakan and shophouse enclave, a mature HDB heartland anchored by the globally celebrated Pinnacle@Duxton, and the gateway to Singapore’s most ambitious land transformation project — the Greater Southern Waterfront (GSW). For property buyers and investors in 2026, the neighbourhood presents a rare combination: tight existing supply, a proven rental market, and a long-term government-backed regeneration catalyst that will reshape the southern coast of Singapore over the coming decades.
This guide covers everything you need to know about buying, renting, and investing in Tanjong Pagar — from live Q1 2026 price data across HDB resale and private condominiums, to the eligibility rules that govern who can buy what, a worked cost example, and an honest assessment of what the Greater Southern Waterfront means for property values in D02.
Where Is Tanjong Pagar and What Makes It Distinctive?
Tanjong Pagar sits in District 02, bounded roughly by Outram Road to the west, Maxwell Road and Neil Road to the north, Keppel Road to the south, and Anson Road to the east. The district is administered within the Outram planning area, and sits firmly within Singapore’s Core Central Region (CCR) — the premium market segment encompassing the traditional prime districts (D9, D10, D11), the CBD core (D1, D2, D6), and Sentosa.
What distinguishes Tanjong Pagar from the rest of the CCR is its mix. Unlike Orchard Road (D9/D10) or Holland Village (D10), which are predominantly private residential, Tanjong Pagar houses approximately 5,400 HDB flats alongside office towers, conserved shophouses, food courts, Chinatown Heritage Centre, and one of Singapore’s most recognisable public housing landmarks. This diversity of tenure and use gives the neighbourhood an urban texture that attracts a broad buyer and tenant base.
Transport Connectivity: Three MRT Lines and Walking-Distance Access
Connectivity is one of D02’s strongest selling points. Residents can access three MRT lines without a bus transfer:
Tanjong Pagar MRT (EW15 — East-West Line): The original station, opened in 1987, connects directly west to Jurong and east to Tampines, Changi Airport, and Pasir Ris. The one-stop hop to Raffles Place (EW14) places the financial district within a two-minute train ride. Outram Park (EW16/NE3/TE17) — one stop west — offers further cross-platform access to the North-East Line and Thomson-East Coast Line.
Shenton Way TEL (TEL17 — Thomson-East Coast Line, Stage 3): Opened in November 2022, Shenton Way TEL sits a short walk north of the Tanjong Pagar residential cluster. The TEL offers seamless one-transfer connectivity to Woodlands (via Orchard and Newton), to East Coast (via Bayshore and Bedok South on TEL Stage 4), and eventually to Sungei Bedok where a cross-platform interchange with the East-West Line will complete the full loop. For Tanjong Pagar residents, the TEL meaningfully reduces commute times to the northern towns and to the Katong/Marine Parade corridor.
Cantonment MRT (CC28 — Circle Line): Opened in September 2022 as part of the Circle Line Stage 6 (closing the loop), Cantonment station sits on Cantonment Road just south of the Pinnacle@Duxton. The Circle Line connects Tanjong Pagar residents directly to one-north, Harbourfront, Dhoby Ghaut, and the eastern nodes of the CCL without going through the city centre interchange.
This three-line connectivity is uncommon even by Singapore standards. Most heartland towns have one or two lines; D02’s triple access gives it a commuting advantage that supports both tenant demand and rental premiums.
HDB Resale Market in Tanjong Pagar: Prices, What to Expect
The HDB resale market in Tanjong Pagar is among the most expensive in Singapore for public housing. The reasons are structural: limited supply (most of the area is private or commercial), exceptional connectivity, and the prestige associated with the Pinnacle@Duxton address. Buyers should expect to pay a meaningful premium over comparable flats in Queenstown or Buona Vista, let alone OCR towns like Tampines or Sengkang.
| Flat Type | Approx. Floor Area | Q1 2026 Median Price | Price Range | Key Precinct |
|---|---|---|---|---|
| 3-Room | ~65–73 sqm | S$555,000 | S$480k–S$640k | Tanjong Pagar Plaza, Cantonment Rd |
| 4-Room | ~90–105 sqm | S$820,000 | S$700k–S$970k | Tanjong Pagar Plaza, Pinnacle (lower floors) |
| 5-Room (Pinnacle) | ~110–120 sqm | S$1,050,000 | S$930k–S$1.18M | Pinnacle@Duxton exclusively |
Pinnacle@Duxton — the seven-tower, 50-storey public housing development completed in 2010 — warrants special mention. Units here, particularly those on higher floors with city and sea views, have consistently transacted above S$1 million since 2021. The development enjoys Minimum Occupation Period (MOP) completed status, and resale units come with the added draw of the iconic sky bridge and rooftop gardens, which are open to the public. Buyers should note: as a leasehold HDB flat with a 99-year tenure commencing 2010, Pinnacle units have approximately 83 years remaining as at 2026 — factoring in lease decay is essential when assessing long-term value.
HDB Eligibility Rules That Apply in D02
The standard HDB resale eligibility framework applies — Singapore Citizens and Permanent Residents who meet the citizenship/family nucleus requirements may purchase. There are no specific restrictions unique to D02, but buyers should note: if any flat in the precinct falls within a Prime classification zone (under HDB’s August 2024 Prime/Plus/Standard framework for BTO), resale of those units after MOP will attract a clawback on subsidies received at purchase. As at 2026, most Tanjong Pagar resale flats are legacy stock not subject to new-framework clawbacks — but prospective buyers should verify the specific block’s classification with HDB before committing.
Private Condo and Freehold Market in D02
D02 Tanjong Pagar has a limited supply of private condominiums compared to neighbouring districts. Development sites are scarce in this dense, mixed-use environment. Notable private residential projects in and around the precinct include Icon (leasehold, completed 2007), One Shenton (leasehold, Shenton Way), V on Shenton (leasehold), 76 Shenton (freehold conservation shophouse redevelopment), and the Artra development at Alexandra View. Freehold conservation shophouses on Club Street, Tanjong Pagar Road, and Duxton Hill command premium valuations as alternative assets.
The PSF range varies significantly by age, tenure, and location within the precinct. As a general guide for Q1 2026:
| Property Type | Tenure | PSF Range (S$) | Typical Monthly Rent (2BR) | Est. Gross Yield |
|---|---|---|---|---|
| Condo <10 yr old, LH | 99-year | S$2,100–S$2,850 | S$5,800–S$7,500 | ~2.8–3.1% |
| Condo >15 yr old, LH | 99-year | S$1,550–S$2,050 | S$4,200–S$5,600 | ~2.9–3.2% |
| Freehold shophouse resi | Freehold | S$2,400–S$3,200 | S$6,000–S$9,000 | ~2.5–2.9% |
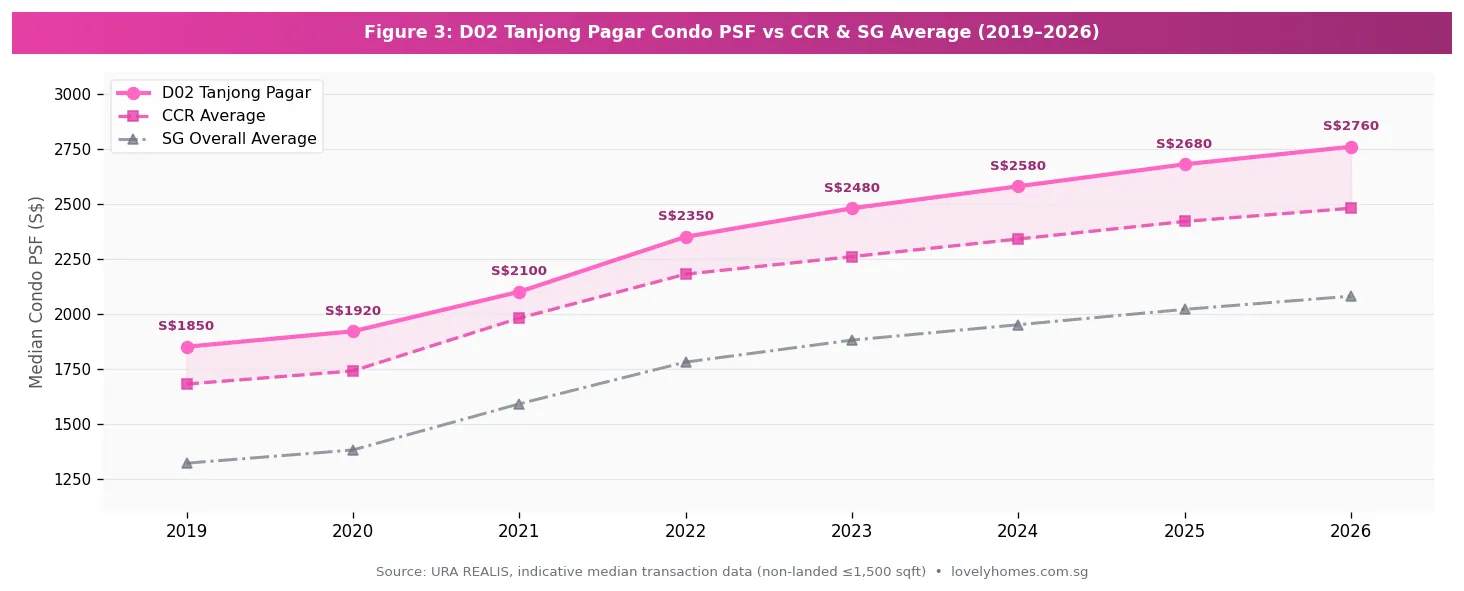
As Figure 3 illustrates, D02 has consistently traded at a premium above the CCR average — reflecting the district’s CBD-adjacency advantage. The gap widened between 2021 and 2023 as post-pandemic demand for city-fringe living spiked. Since 2024, the gap has stabilised, with D02 running approximately S$250–S$320 psf above the CCR mean. The absence of significant new supply — no major GLS site has been released in D02 in recent years — has supported prices even as broader CCR activity moderated in 2024.
The Greater Southern Waterfront: What It Means for Tanjong Pagar Property
The Greater Southern Waterfront (GSW) is the Singapore Government’s most ambitious urban transformation project south of the city. It encompasses approximately 2,000 hectares of land stretching from Pasir Panjang in the west to Marina East in the east — a stretch of southern coastline currently occupied by port terminals, industrial facilities, golf courses, and government land. As the Tanjong Pagar Port (the world’s largest container port by throughput when it operated) progressively relocates to Tuas by the early 2030s, this vast land bank becomes available for mixed-use development over the following two to three decades.
For Tanjong Pagar property owners, the GSW is both an opportunity and a long-dated one. Key facts that property buyers should understand:
Scale and timeline: At 2,000 ha, the GSW is larger than Marina Bay and Tampines combined. Development will be phased over 20–30 years. The first parcels to emerge will be around Keppel and Telok Blangah; those closest to Tanjong Pagar could see activity within 10–15 years.
Planned character: URA’s masterplan envisions a live-work-play precinct with new residential districts, public green spaces, a new waterfront promenade, cultural institutions, and a potential new MRT connection along the southern coast. The Keppel Club site (approximately 44 ha) was the first major GSW parcel to be tendered, with the winning developer awarded the white site in early 2023 for a mixed-use development that will include over 9,000 residential units — becoming one of Singapore’s largest planned private housing estates.
Property value implications: Historical precedent from Marina Bay and one-north suggests that government-planned transformations deliver measured but real uplift to surrounding residential values — typically concentrated in the 5–10 years before and during initial development. For D02 owners, the GSW catalyst is a hold thesis rather than an immediate trading play.
Worked Example: Buying a Tanjong Pagar Condo in 2026
The Scenario: Mr and Mrs Tan (SC/SC), first-time buyers, purchasing a 2-bedroom condo
Property: 2-bedroom leasehold condo near Tanjong Pagar, 700 sqft at S$2,400 psf = S$1,680,000
Stamp duty: Buyer’s Stamp Duty (BSD) = 1% on first S$180k + 2% on next S$180k + 3% on next S$640k + 4% on next S$500k + 5% on remainder
= S$1,800 + S$3,600 + S$19,200 + S$20,000 + S$9,000 = BSD S$53,600
ABSD: S$0 — SC first property, ABSD exempt
LTV and downpayment: With income of S$15,000/mth combined, TDSR ceiling is 55% → max monthly debt S$8,250. Assume 75% LTV bank loan at 3.5% over 25 years:
Loan = S$1,260,000; monthly repayment ≈ S$6,310 → TDSR 42.1% PASS
Cash required upfront:
— 5% cash downpayment: S$84,000 (cash only; CPF cannot cover first 5%)
— 20% balance: S$336,000 (cash or CPF OA)
— BSD: S$53,600
— Legal fees / stamp duty / valuation: ~S$6,000
— Total upfront: approx. S$479,600 (depending on CPF OA balance)
Note: SPR or SC second-property buyers would pay ABSD of 5% (SPR first) or 20% (SC second) respectively, materially increasing the total cost. Always compute your personal profile’s ABSD liability before committing.
Why Tanjong Pagar Matters for Property Investors in 2026
In a market where OCR prices have risen sharply since 2020 and the gap between CCR and OCR has narrowed, Tanjong Pagar offers a rare proposition: a CCR address at a price point that, in historical context, is more accessible than it has been. The CCR-to-OCR price differential compressed significantly between 2021 and 2024 as mass-market demand pushed OCR prices upward while CCR remained relatively range-bound.
For long-term holders, D02 has three structural advantages that distinguish it from comparable CCR districts. First, the supply pipeline is thin — no significant new private residential completions are expected in D02 through 2028, meaning existing stock bears no dilution risk from new units coming online. Second, the tenant pool is diversified across CBD professionals, Chinatown heritage seekers, and increasingly, short-stay visitors and digital nomads who value the neighbourhood’s walkable character. Third, the GSW represents a call option on Singapore’s next major urban precinct — one that, unlike speculative GLS bids, requires no premium payment.
Comparable CCR districts (D9 Orchard, D10 Bukit Timah, D11 Novena) all carry higher average PSFs and lower yield profiles. D02’s position as the undervalued cousin of the prime districts has been a persistent feature of the Singapore market, partly because of the neighbourhood’s historic industrial associations and partly because of its relative unfamiliarity to overseas buyers. Both factors are changing.
What Might Come Next for Tanjong Pagar Property
This section reflects editorial analysis and speculation based on current trends. It should not be treated as a forecast or investment advice.
The most consequential near-term catalyst for D02 values is likely the Keppel integrated development — the first major GSW residential project — which, if it proceeds on schedule, could deliver initial units by the late 2020s to early 2030s. When Marina Bay Sands and the Marina Bay Financial Centre arrived, surrounding Districts 1 and 2 saw demonstrable price appreciation driven by improved amenity, connectivity, and perception uplift. A similar dynamic is plausible as the first GSW precincts activate, though the scale and timeline introduce significant uncertainty.
The URA Q2 2026 price index (released 1 July 2026, URA pr26-51) showed the CCR rebounding +2.0% quarter-on-quarter, outperforming the RCR (-1.4%) and OCR (-0.2%). If the CCR rebound is sustained, D02 stands to benefit disproportionately given its supply constraints and improving sentiment around the GSW. That said, global interest rate trajectories and Singapore’s continued vigilance on cooling measures (ABSD rates remain elevated since 2023) remain the key headwinds for any near-term price acceleration.
Frequently Asked Questions: Tanjong Pagar Property
Can a foreigner buy property in Tanjong Pagar?
Foreigners may purchase private condominiums in Tanjong Pagar freely, but may not purchase HDB flats (including Pinnacle@Duxton). Foreign buyers pay a 60% ABSD on their purchase price, on top of BSD. Freehold conservation shophouses classified as strata commercial or strata residential may be available, but restrictions apply — consult a licensed property agent and conveyancing solicitor before proceeding. Singapore Permanent Residents (SPRs) pay 5% ABSD on their first residential property purchase.
What is the MOP for HDB flats in Tanjong Pagar?
HDB resale flats in Tanjong Pagar (including Pinnacle@Duxton) have a standard Minimum Occupation Period of 5 years from the date the seller obtained the keys. You cannot resell or rent out the entire flat during MOP. After MOP, the full flat may be rented out, subject to HDB’s rental eligibility rules. New BTO flats in prime-classified zones carry an extended 10-year MOP under the framework introduced in August 2024.
How does buying a Pinnacle@Duxton flat differ from a standard HDB purchase?
Pinnacle@Duxton units transact as standard HDB resale flats under the HDB resale process — there is no special purchase mechanism. However, buyers should be aware of several unique features: the 50-storey height means piped gas is unavailable above certain floors; the sky bridge and rooftop garden access was previously charged (S$6 for residents) and open to the public; and the premium commanded by higher floors can be substantial. Lease decay is an important consideration: with a 99-year lease commencing 2010, the remaining lease in 2026 is approximately 83 years. HDB’s loan eligibility will be affected by the lease duration — ensure the flat meets the remaining-lease requirement for your desired loan tenure.
Is there a significant COV (Cash Over Valuation) in Tanjong Pagar?
In a tight supply market like D02, COV is common. COV is the amount a buyer pays above the HDB-commissioned bank valuation — it must be paid entirely in cash, not CPF. For popular blocks and high floors at Pinnacle@Duxton, COV of S$30,000–S$80,000 has been observed in recent transactions. Buyers should budget for COV explicitly and factor it into their cash liquidity planning alongside the standard 5% cash downpayment and BSD.
What is the Greater Southern Waterfront and when will it affect property prices?
The Greater Southern Waterfront (GSW) is Singapore’s government-planned transformation of approximately 2,000 hectares of southern coastal land, from Pasir Panjang to Marina East, as the Tanjong Pagar Port relocates to Tuas by the early 2030s. Development will proceed in phases over 20–30 years. The Keppel integrated development (white site awarded 2023) is the first major residential precinct to emerge from the GSW, with an estimated 9,000+ homes planned. Property values in D02 are unlikely to see an immediate step-change from GSW; the effect will be gradual, strongest when the first GSW precincts open and new amenities, waterfront access, and additional MRT nodes materialise. Buyers today are effectively pre-positioning.
What rental income can I expect from a Tanjong Pagar condo?
Based on Q1 2026 rental market data, a 2-bedroom unit (600–800 sqft) in a leasehold condo in D02 typically commands S$4,200–S$7,500 per month, depending on age of the building, floor level, and furnishing. Smaller studio or 1-bedroom units (400–500 sqft) rent in the S$3,200–S$5,000 range and are popular with single CBD professionals. Gross rental yields typically fall in the 2.6–3.2% range for private condos at current price levels — not the highest in Singapore but supported by consistently low vacancy given the CBD tenant base. HDB flats may be rented out after MOP; rental returns on HDB in D02 can be relatively attractive given the lower absolute price relative to nearby private units.
Are there upcoming GLS or new launch condos in Tanjong Pagar?
As at July 2026, there are no confirmed GLS sites in District 02 Tanjong Pagar on the URA Confirmed List for 1H or 2H 2026. The GSW Keppel integrated development is the closest major upcoming supply, but it is physically distinct from the current D02 residential cluster and is expected to be launched as a new growth node rather than a competitor to existing D02 stock. Supply scarcity in D02 proper is expected to persist through at least 2028, which supports both rental and capital values.