Singapore Property Market Forecast 2H 2026: Price Outlook, Key Risks and What Buyers Should Know
Quick Answer: Singapore Property Market Forecast 2H 2026
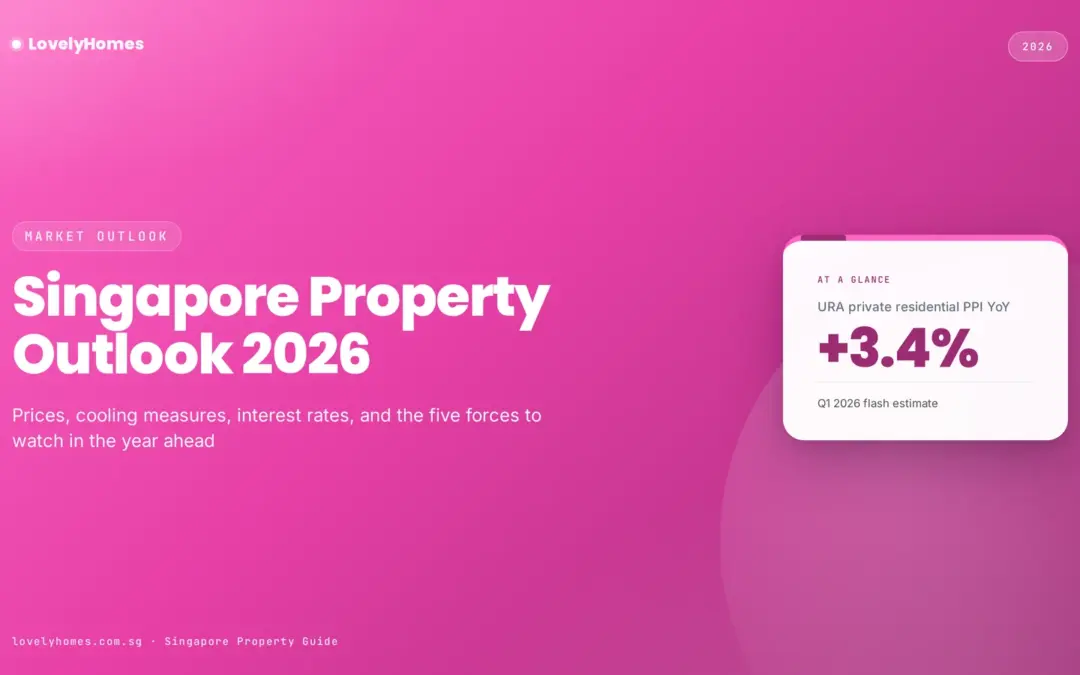
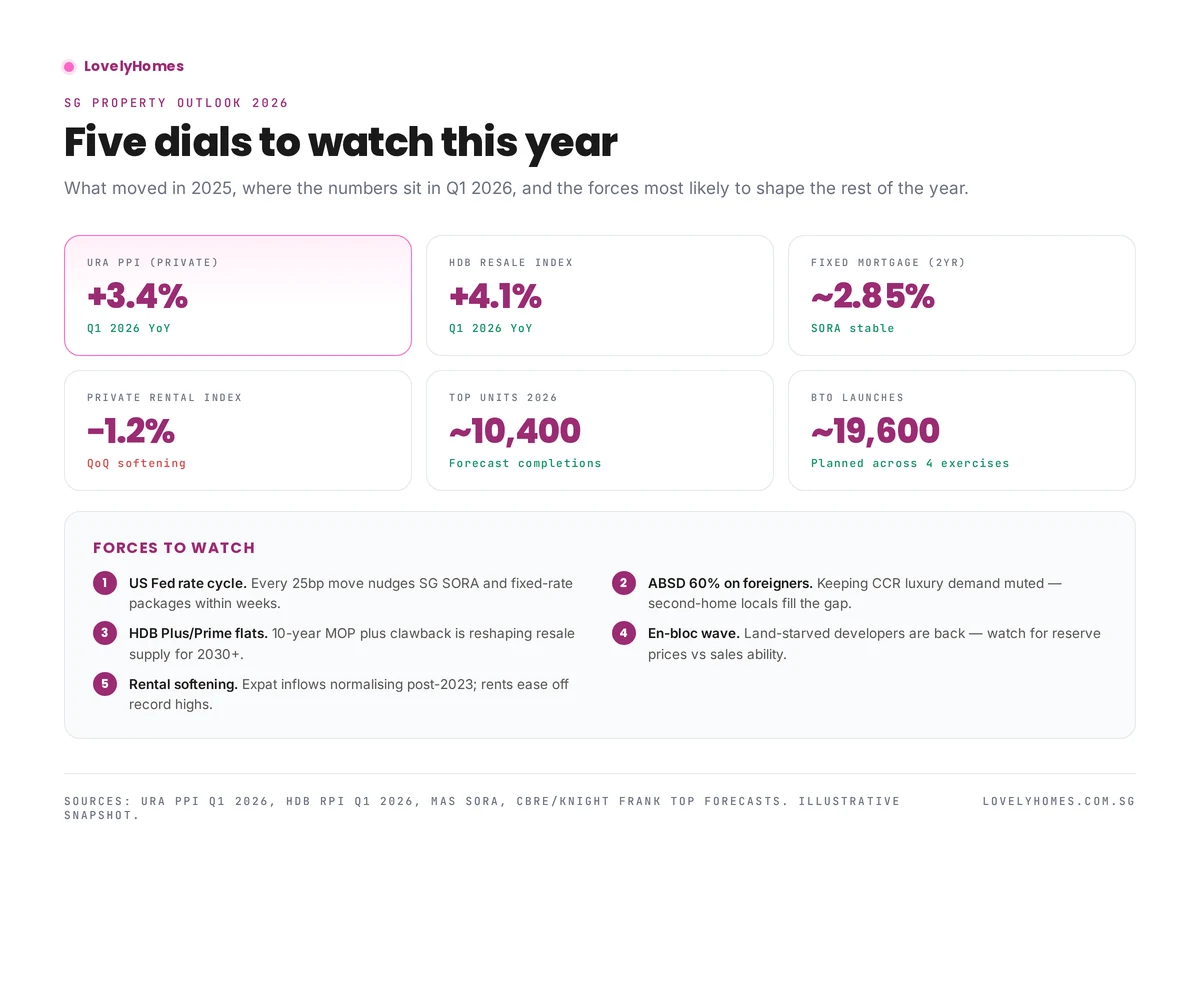
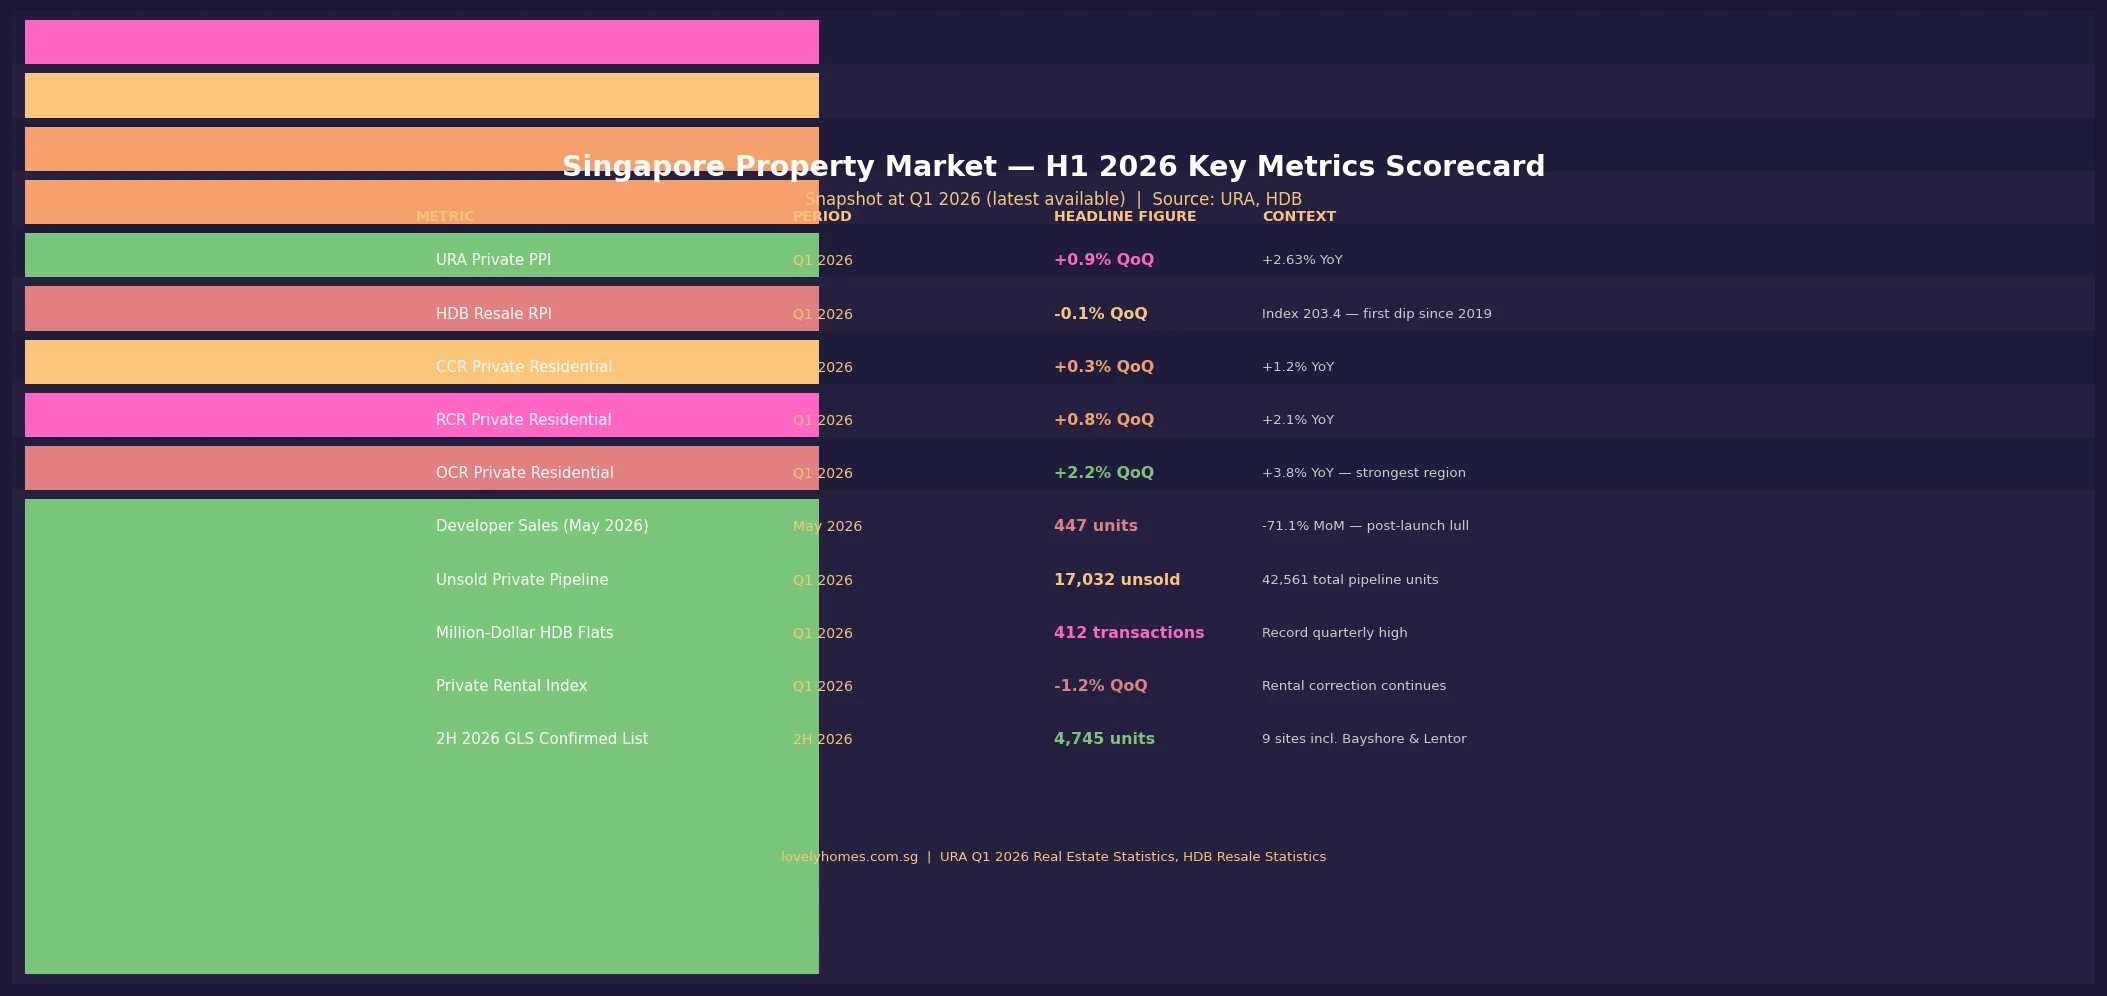
- Private residential prices rose 0.9% QoQ and 2.63% YoY in Q1 2026, with the Outside Central Region (OCR) leading at +2.2% QoQ — price growth is positive but moderating.
- HDB resale recorded its first quarterly dip (-0.1% QoQ) since Q2 2019; index sits at 203.4. Not a crash — more of a pause after a five-year run.
- 2H 2026 GLS launches 9 confirmed-list sites (4,745 units), adding meaningful supply to OCR and RCR. Pricing discipline from developers is expected.
- Key risk: interest rates remain elevated at 3.0–3.5% for bank mortgages; affordability is stretched for many first-time buyers.
- Key catalyst: any US Federal Reserve rate cut signals would unlock significant pent-up demand — watch the September and December 2026 Fed meetings.
- For buyers: fundamentals remain sound — Singapore’s employment is near-full, rental demand supports investment yield, and supply is finite. Timing the market is less reliable than time in the market.
- URA Q2 2026 Flash Estimates are expected in early July 2026 and will be the next major data point.
H1 2026 in Review: Where the Singapore Property Market Stands
As the calendar turns to the second half of 2026, Singapore’s property market presents a nuanced picture. Private residential prices continued their gradual upward trajectory in Q1 2026, with the Urban Redevelopment Authority (URA) reporting a Property Price Index (PPI) increase of 0.9% quarter-on-quarter — a modest but consistent gain that extends a trend stretching back to the post-pandemic recovery that began in mid-2020. On a year-on-year basis, the private residential index is up 2.63%, a pace that is firm but well below the double-digit growth seen during the post-pandemic surge of 2021 to 2023.
The Housing Development Board’s Resale Price Index (RPI), however, told a slightly different story. At 203.4 in Q1 2026, the HDB resale market recorded a 0.1% quarterly decline — the first such dip since Q2 2019. This is not alarming in isolation: the index had surged more than 54% since its 2019 trough, and a modest pause is consistent with natural market digestion. What it does signal is that the exceptional run of HDB resale price appreciation is transitioning into a more measured phase.
Private Residential Market: A Three-Speed Story
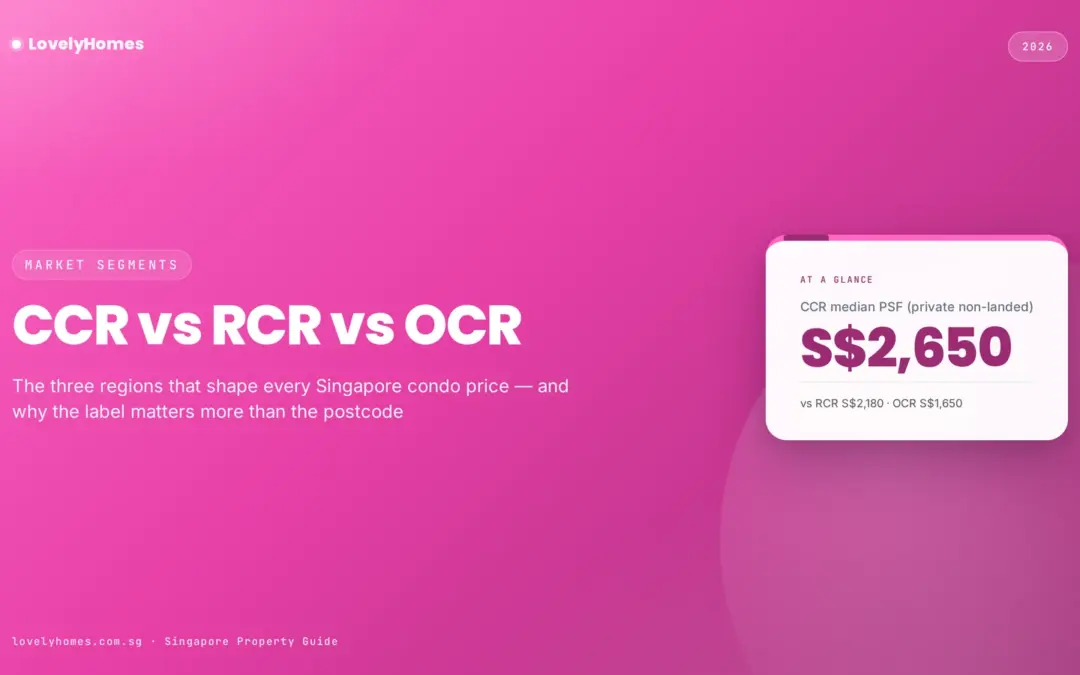
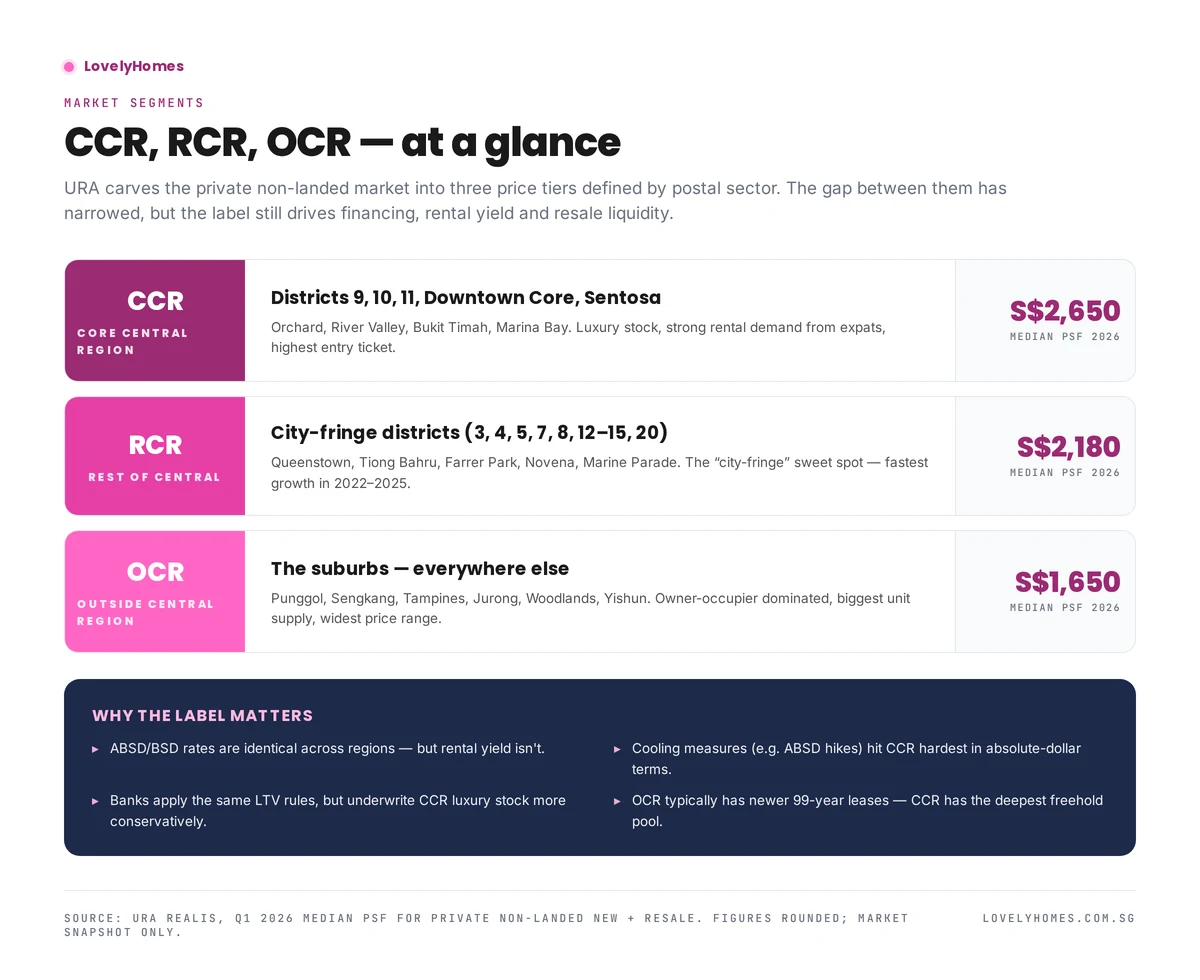
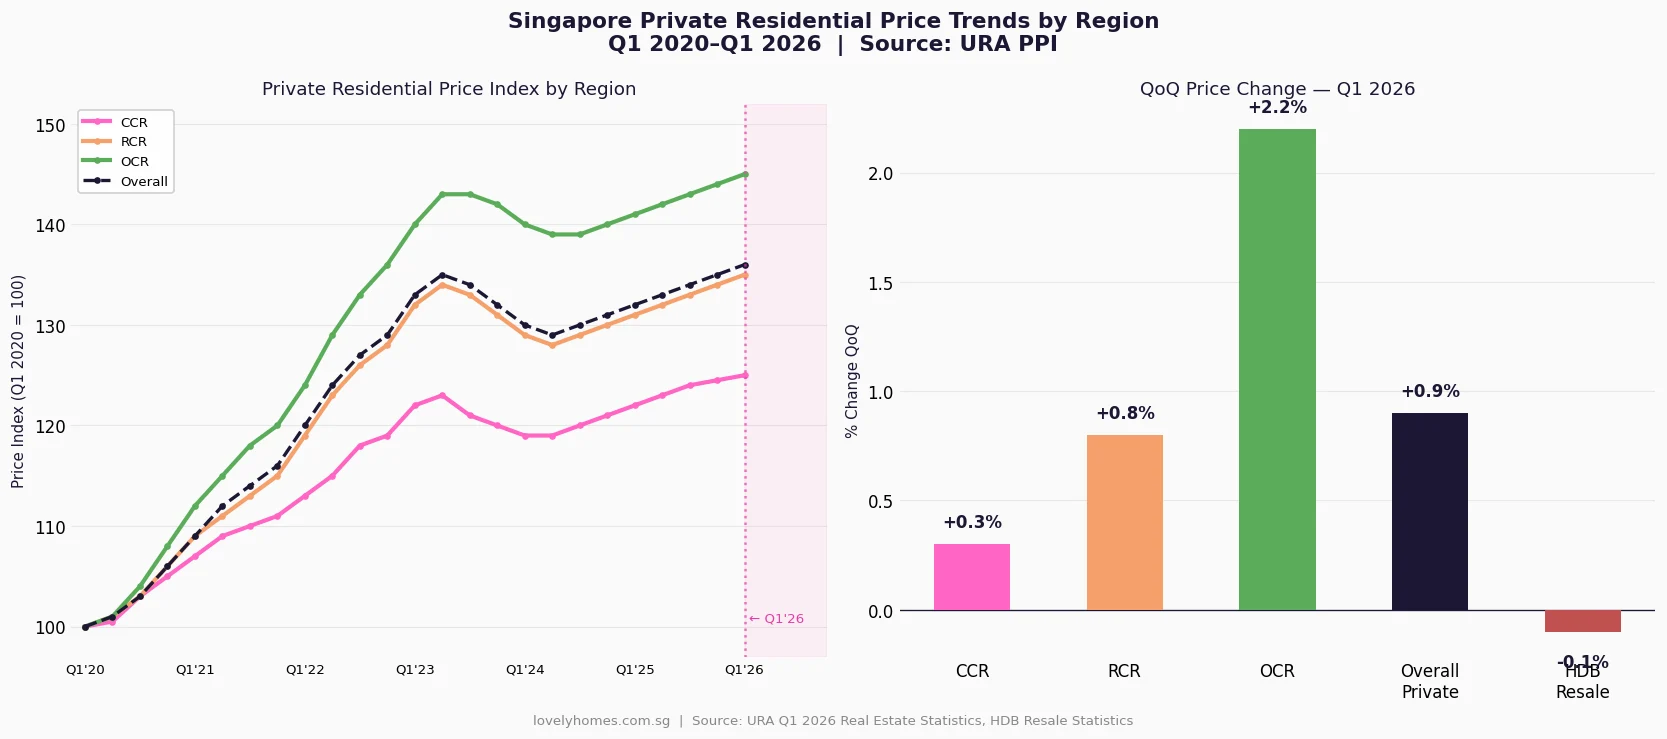
The defining characteristic of Singapore’s private residential market in 2026 is regional divergence. The three planning zones administered by URA — the Core Central Region (CCR), Rest of Central Region (RCR), and Outside Central Region (OCR) — have performed at markedly different speeds in 2026.
The OCR is the undisputed pace-setter. A 2.2% quarterly gain in Q1 2026, following similar momentum in late 2025, reflects genuine demand from HDB upgraders — a cohort whose Minimum Occupation Period (MOP) clears in waves and who target mass-market new launches in the S$1.3M–S$1.8M range. The 2H 2026 GLS programme deliberately concentrates supply here (Tampines Street 94, Bayshore Road), which should moderate any further sharp price acceleration without causing a price correction.
The RCR recorded 0.8% QoQ growth — solid mid-field performance driven by a mix of first-time private buyers, professionals, and some foreign-related buying in the city-fringe. River Valley Green Parcel C (awarded June 2026 at a top bid of approximately S$1,730 psf ppr) is the headline indicator of developer confidence in this zone.
The CCR grew just 0.3% QoQ, a subdued reading that reflects several headwinds: the 60% Additional Buyer’s Stamp Duty (ABSD) on foreigners that has been in place since April 2023 continues to suppress international transaction volumes; and the global macro uncertainty discussed in the risk section below has weighed on ultra-high-net-worth discretionary buying. That said, CCR is not in distress — it remains a long-term beneficiary of Singapore’s family office growth and wealth inflows.
HDB Resale Market: A Healthy Pause, Not a Reversal
Singapore’s HDB resale market has been one of the defining investment stories of the 2020s. From a low point in 2019 (RPI ≈ 132), prices surged to an index of 203.4 by Q1 2026 — a 54% cumulative increase. The Q1 2026 dip of 0.1% QoQ is, in that context, the market catching its breath after an exceptional run rather than a structural reversal.
Two counterintuitive data points reinforce this view. First, million-dollar HDB transactions reached a record quarterly high of 412 in Q1 2026 — indicating that at the premium end of the resale market (large mature-estate flats, high-floor units in sought-after towns), demand remains fierce. Second, overall HDB resale transaction volumes for Q1 2026 remained healthy, with four-room flats accounting for the largest share (approximately 2,690 transactions in Q1 2026 alone) at a median price of around S$575,000.
For 2H 2026, the HDB resale market is likely to remain range-bound rather than sharply appreciating or correcting. MOP cohorts from the 2016–2019 BTO launches are gradually clearing, releasing units back to the resale market — but supply from this channel is relatively thin compared to the 2013–2016 peak cycle. Demand remains supported by couples who cannot access BTO (due to income ceiling, citizenship mix, or urgency) and Permanent Residents who remain ineligible to buy BTO directly.
Developer Sales and the New Launch Pipeline
Developer sales activity is the indicator most directly shaped by new launch timing. The monthly data tells a story of feast and famine: January to April 2026 saw 1,120, 895, 1,348 and 1,548 units sold respectively — solid months driven by a cluster of project launches. May 2026 crashed to 447 units (-71.1% month-on-month), not because demand evaporated, but because there were few projects launching that month.
The pipeline going into 2H 2026 remains substantial. URA data shows 17,032 unsold units in the private pipeline as of Q1 2026 (total pipeline including units not yet launched: 42,561). The 2H 2026 GLS Confirmed List adds nine further sites including Lentor Gardens Parcel A and B, Bayshore Road, Tampines Street 94, and an EC site at Jurong East. These launches are phased across 2H 2026 into 2027, so the impact on completed supply will be felt primarily in 2028–2030.
Rental Market: Correction Underway, Yields Compressing
Singapore’s private residential rental market began correcting in 2024 after a record two-year surge and that correction extended into 2026. The URA rental index fell 1.2% QoQ in Q1 2026, following declines across 2024 and 2025. In absolute terms, rents remain significantly above their pre-pandemic levels — a 2BR in D15 that rented for S$2,800/month in 2019 may still command S$4,200–S$4,800/month in 2026 depending on specification — but the exceptional post-pandemic pricing has normalised.
For investors, this rental correction compresses gross yields. A S$1.5M 2BR in the RCR yielding S$4,500/month gross generates a gross yield of approximately 3.6%, which is broadly comparable to bank deposit rates in 2026. Net yield after management fees, property tax, and maintenance is lower — making the case for property investment in 2026 primarily a capital appreciation thesis rather than a pure income play.
2H 2026 Market Outlook Summary
| Segment | Base Case | Bull Case | Bear Case |
|---|---|---|---|
| Private Residential (Overall) | +1%–2% for full year 2026 | +3%–4% if rates ease and demand recovers | Flat to -1% if global recession deepens |
| OCR (Mass Market) | Continues outperforming; +2%–3% YoY | +4%–5% with strong HDB upgrader demand | Supply pressure from GLS launches moderates gains |
| RCR (City Fringe) | Steady +1%–2% YoY | +3% with new launch interest | Flat if affordability ceiling is hit |
| CCR (Core Central) | Sideways to +1%; foreign buyer ABSD drag | +2%–3% if ABSD reviewed or wealth inflows surge | -1%–2% if global HNW sentiment deteriorates |
| HDB Resale | ±0.5% QoQ; range-bound in H2 | +1%–2% if upgrader demand stays robust | -1% if affordability stress bites flat demand |
| Private Rental | Further -2%–4% as supply catches up | Stabilises if employment influx resumes | Deeper correction if expat headcount falls |
Worked Example: The Chen Family — Buy in 2H 2026 or Wait?
Mr and Mrs Chen are Singapore Citizens in their early 30s. They have cleared their HDB MOP on their Bishan 4-room flat and are looking to upgrade to a 3-bedroom OCR condo. They have combined income of S$13,500 per month, CPF OA savings of S$180,000, and cash of S$120,000.
They are eyeing a 3BR at an upcoming OCR launch in Q3 2026 priced at S$1.65M. Under the ABSD SC couple remission scheme, they can purchase the new condo and claim a full refund of the 20% ABSD (S$330,000) provided they sell their HDB flat within six months of the condo purchase date.
Key numbers: BSD S$47,600 (payable from CPF); ABSD S$330,000 (cash, but refundable within six months of HDB sale); 5% cash S$82,500; legal fees ~S$5,500. Bank loan: 75% LTV = S$1,237,500 at 3.2% over 30 years → monthly repayment approximately S$5,338. TDSR = S$5,338 ÷ S$13,500 = 39.5% (PASS, under 55%). Total cash needed upfront: ~S$208,000 (cash component + ABSD float pending HDB sale).
Should they wait? If OCR prices rise another 2% by Q1 2027, the same unit would cost S$1,683,000 — an additional S$33,000. If interest rates fall 50 bps by then, monthly repayments fall by ~S$300/month. The calculus slightly favours acting when they are ready rather than trying to time the market precisely, provided the ABSD remission window can be managed. See our guide on ABSD remission for SC couples for the full rules.
What Might Come Next: Risks and Catalysts for 2H 2026
The Singapore property market operates at the intersection of domestic fundamentals (employment, wage growth, HDB upgrader cohorts) and global macro forces (US interest rates, geopolitical risk, capital flows). For the second half of 2026, both sides of that equation are in play.
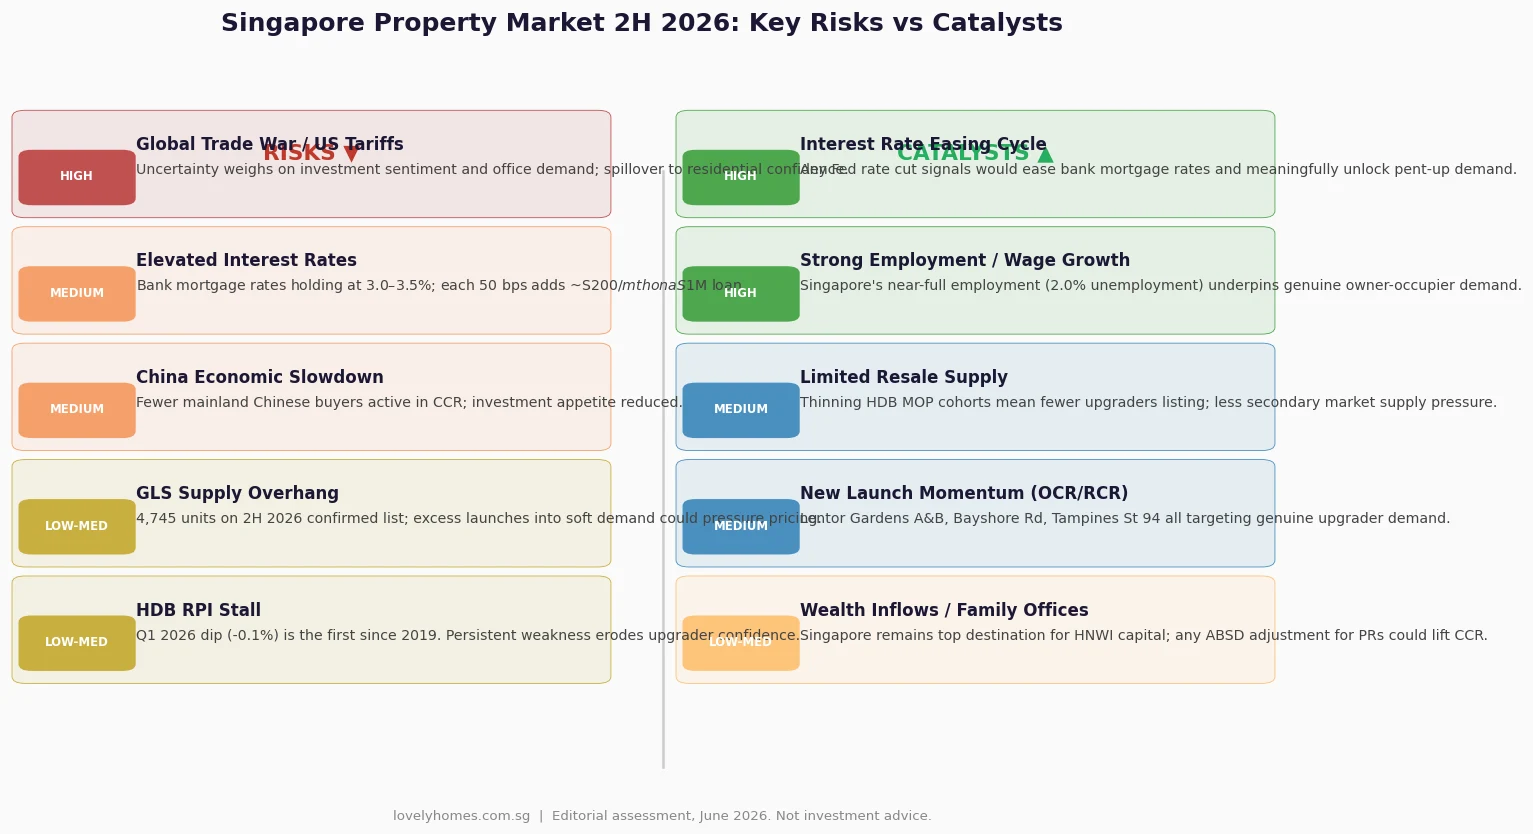
Key downside risks include the persistence of elevated interest rates — if the US Federal Reserve holds rates through 2026 without cutting, Singapore bank mortgage rates (which track SORA and swap rates) will remain in the 3.0–3.5% range, keeping affordability stretched. Continued global trade disruptions from US tariff policy create a dampening effect on business investment sentiment and, indirectly, on expatriate headcounts and rental demand. China’s economic slowdown reduces the pool of Chinese-origin buyers who were historically active in the CCR.
Key upside catalysts include the prospect of Fed rate cuts in September or December 2026 — even one 25-basis-point cut would move Singapore’s forward rates and boost buyer confidence. Singapore’s own fundamentals remain strong: the unemployment rate is approximately 2.0%, wage growth is positive, and the Government’s managed-supply approach via the GLS programme means developers are not flooding the market with distressed inventory. Any relaxation of ABSD for permanent residents (which has been debated, though there is no official signal) would be an immediate CCR and RCR catalyst.
Frequently Asked Questions
Will Singapore property prices drop in 2H 2026?
A broad price correction in 2H 2026 is not the base-case scenario for most analysts. Singapore’s property market is underpinned by limited land supply, robust employment, and the Government’s disciplined GLS programme which calibrates supply to demand. The most likely outcome for 2H 2026 is modest positive growth in the private residential segment (0%–2% for the full year in a base case) and range-bound movement in HDB resale. A sharp correction would require a confluence of events unlikely to materialise simultaneously: a major spike in unemployment, a severe global financial shock, and a government decision to release large additional land supply. None of these is the current outlook.
When will the URA Q2 2026 Flash Estimates be released?
Based on URA’s established release pattern, the Q2 2026 Flash Estimates for the private residential property price index are expected in the first week of July 2026 — likely 1 or 2 July. The full Q2 2026 real estate statistics (including detailed regional breakdowns, rental index, and developer sales data) typically follow approximately three to four weeks later. The flash estimate gives a preliminary QoQ price change figure; the full release provides granular transaction and rental data. LovelyHomes will publish a dedicated analysis article as soon as the data is available.
What does the HDB resale -0.1% dip in Q1 2026 actually mean for sellers?
A -0.1% quarterly change in the HDB Resale Price Index is, in practical terms, negligible. On a S$600,000 flat, it represents a S$600 notional price movement — far smaller than the typical negotiation buffer in any individual transaction. What it signals is a shift in market psychology: buyers are less willing to pay premiums above valuation (Cash-Over-Valuation, or COV), and the exceptional seller’s market conditions of 2021–2024 have normalised. Sellers should still expect good prices — the index is 54% above its 2019 trough — but they should set realistic expectations and price to comparable transactions rather than aspirationally. For guidance on reading HDB data, see our HDB Resale Price Index Guide.
Is this a good time to buy a private property in Singapore?
This depends entirely on your personal financial circumstances, intended holding period, and purpose. If you are buying for genuine owner-occupation (primary home or long-term family residence), timing the market precisely is less important than buying within your means — ensuring your TDSR is comfortable, that you have adequate cash reserves, and that your loan tenor is appropriate. If you are buying as an investment (rental yield or capital appreciation), you need to stress-test the numbers at current mortgage rates (3.0–3.5%) and assess whether the rental yield justifies the carrying cost. For a personalised assessment, consult a licensed financial adviser and a property professional. See also our Singapore Property Financing Guide for a full breakdown of LTV, TDSR, and MSR rules.
How does the 2H 2026 GLS supply affect new launch prices?
The 2H 2026 Government Land Sales Confirmed List adds nine sites capable of yielding approximately 4,745 private and EC units. This is a substantial supply injection, particularly into the OCR and RCR. In theory, more supply means developers compete harder for buyers, which moderates launch prices. In practice, Singapore developers rarely slash prices — they tend to phase launches to match demand and hold firm on pricing. The more likely outcome is that new launches in 2H 2026 are priced at modest premiums (5%–8%) to recent comparables rather than at exceptional premiums. Buyers interested in specific sites such as Lentor Gardens Parcels A and B, Bayshore Road, or Tampines Street 94 should monitor the URA tender awards and developer launch announcements as they are made throughout 2H 2026. Full details of all 2H GLS sites are in our 2H 2026 GLS Programme Guide.
What is the ABSD rate for Singapore Citizens buying a second property in 2026?
A Singapore Citizen purchasing a second residential property pays 20% ABSD on the purchase price or market value, whichever is higher. This is paid in cash (CPF cannot be used for ABSD). For SC couples who own an HDB flat, the 20% ABSD on their second private property can be refunded under the SC Couple ABSD Remission Scheme, provided the HDB flat is sold within six months of the completion of the private property purchase. The full rules are detailed in our ABSD Remission Guide and Complete ABSD Singapore 2026 Guide.
How do I track the Singapore property market between official URA releases?
Between URA quarterly releases, you can monitor real-time trends through several free sources. The URA REALIS portal (accessible via My SingPass) provides transaction-level data for private residential properties. The HDB Resale Flat Prices portal shows individual HDB transactions. SRX Property and EdgeProp Singapore publish weekly market commentaries based on caveats lodged. The Business Times Real Estate section and Channel NewsAsia Property cover major announcements and tender results. For a guide on how to interpret the data you find, see our HDB Resale Price Index Guide and CCR RCR OCR Property Guide.
Related Articles
- Singapore Property Market Mid-Year Review 2026: H1 Results, Price Trends and 2H Outlook
- Singapore 2H 2026 GLS Programme: 9 Sites, 4,745 Units and What It Means for Buyers
- ABSD Singapore 2026: Complete Guide to Additional Buyer’s Stamp Duty
- Singapore CCR RCR OCR Property Guide 2026: Regions, Districts and Price Differences
- Singapore Property Financing Guide 2026: LTV, TDSR, MSR and HDB vs Bank Loan Explained
- ABSD Remission and Refund Guide 2026: SC Couple Scheme and 6-Month Window
- Singapore HDB Resale Price Index Guide 2026: What the RPI Measures and Q1 2026 Data
Click outside or press Esc to close