Singapore Property Market Q2 2026: URA Full Statistics
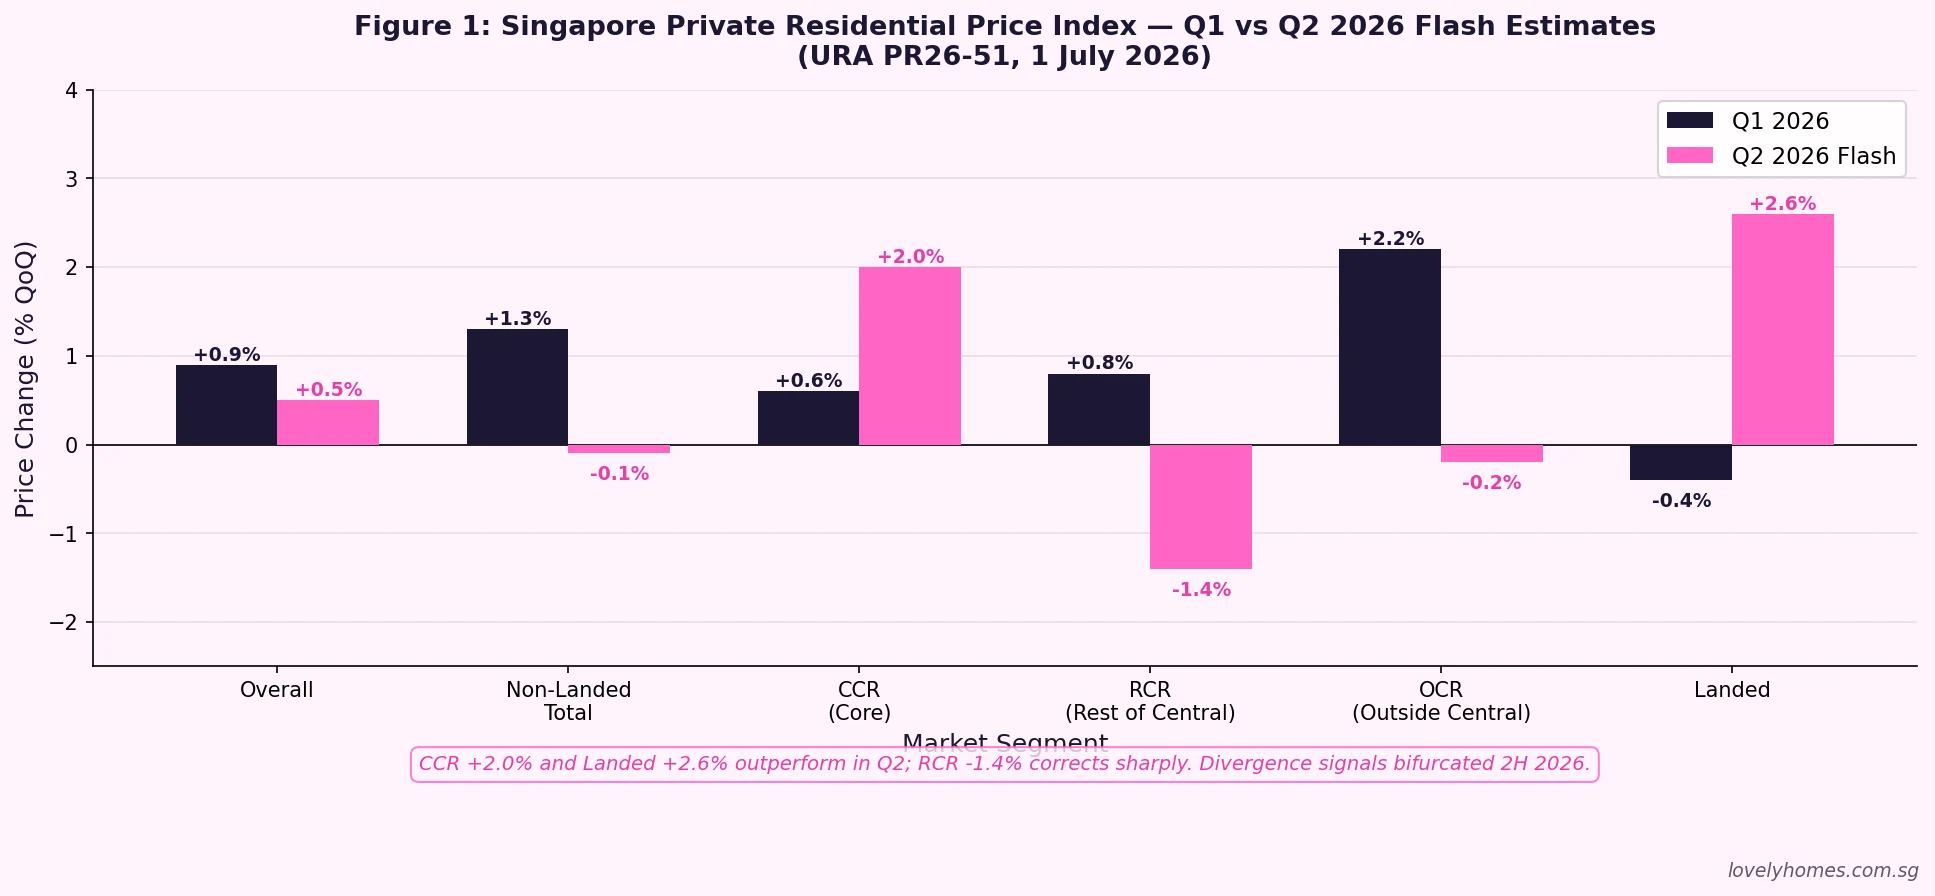
The Urban Redevelopment Authority (URA) released its full Q2 2026 private residential statistics on 24 July 2026 (press release pr26-57), completing the picture that the flash estimate of 1 July 2026 (pr26-51) had begun to sketch. The full data confirms a modestly slowing market: overall prices rose 0.5% for the quarter, H1 2026 cumulative gains are 1.4%, and a striking regional divergence has emerged — with the Core Central Region (CCR) accelerating even as the Rest of Central Region (RCR) corrected by 1.2%.
Quick Answer: Singapore Property Market Q2 2026
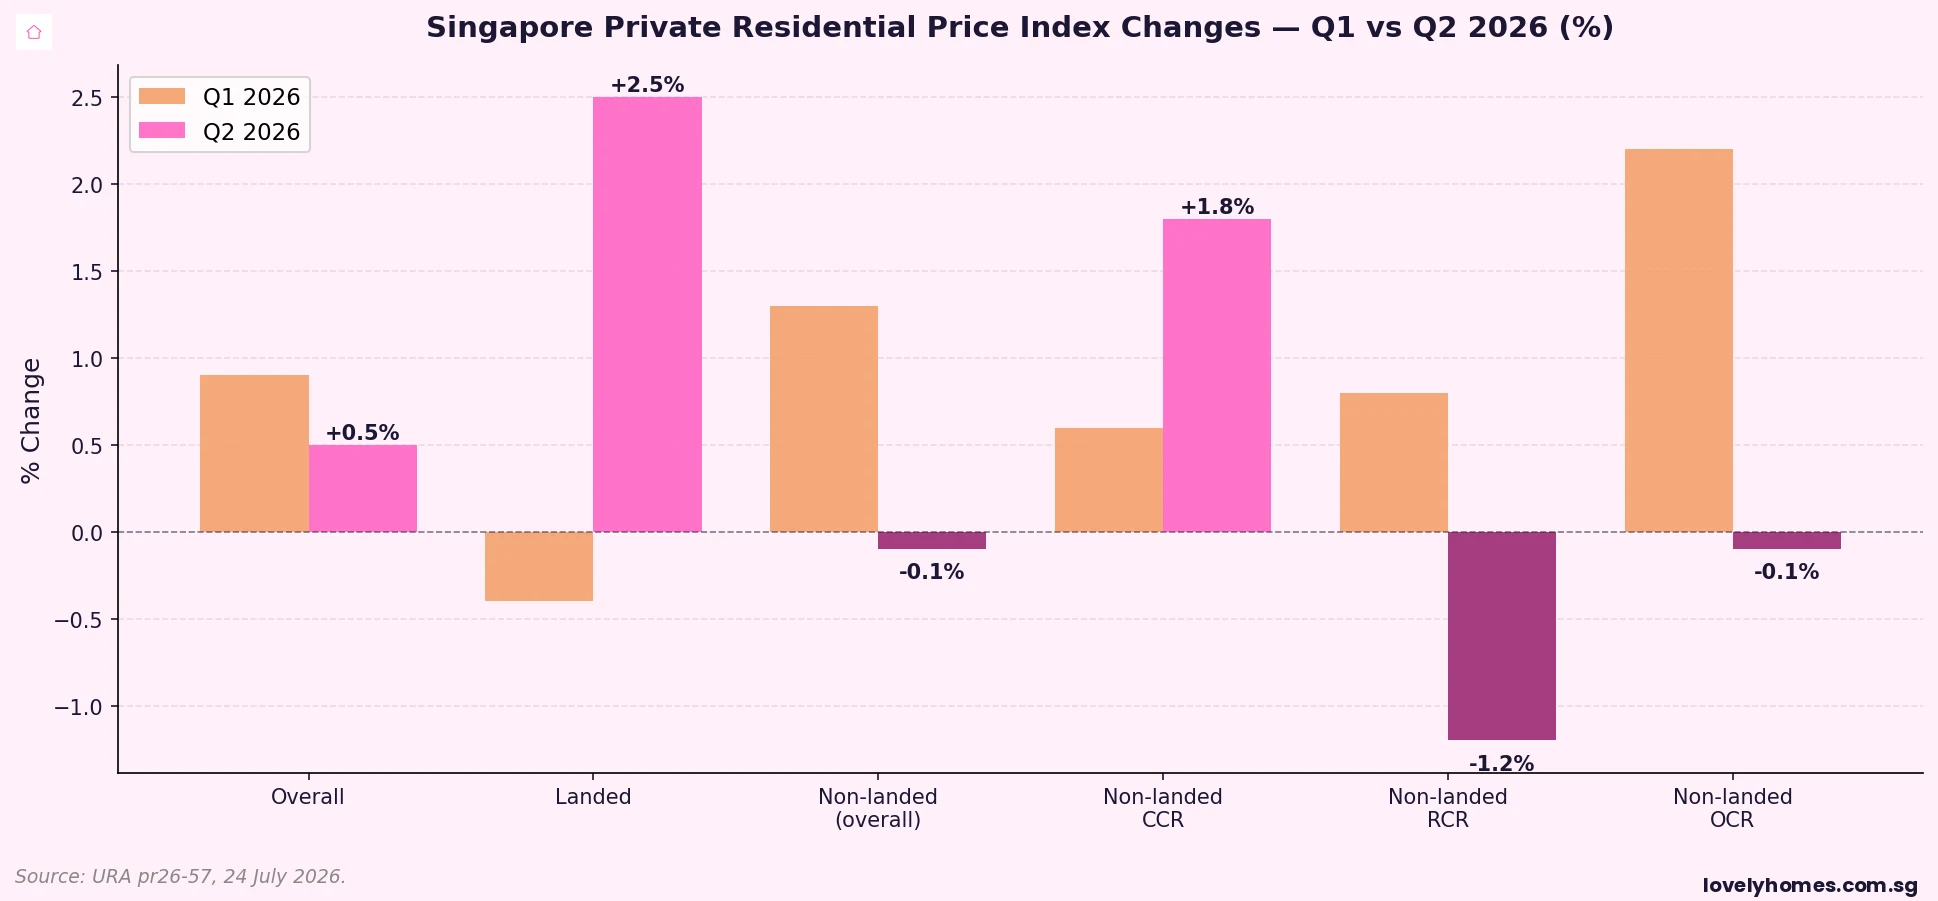
- Overall private residential price index: +0.5% in Q2 2026 (vs +0.9% in Q1 2026); H1 2026 cumulative: +1.4%
- Landed: +2.5% (sharp rebound from -0.4% in Q1)
- Non-landed overall: -0.1% (reversal from +1.3% in Q1)
- CCR non-landed: +1.8% | RCR: -1.2% | OCR: -0.1%
- Developer sales: 2,141 units (excl. ECs) — highest in five quarters
- Resale: 3,813 transactions — 62.0% of all sales, up from 59.6% in Q1
- Vacancy rate: 6.4% overall; CCR 8.3%, RCR 6.1%, OCR 5.6%
- Rental: +0.7% overall; landed +2.7%; CCR +1.2%; OCR -0.3%
- Pipeline unsold (with planning approval): 15,810 units — near-5-year low
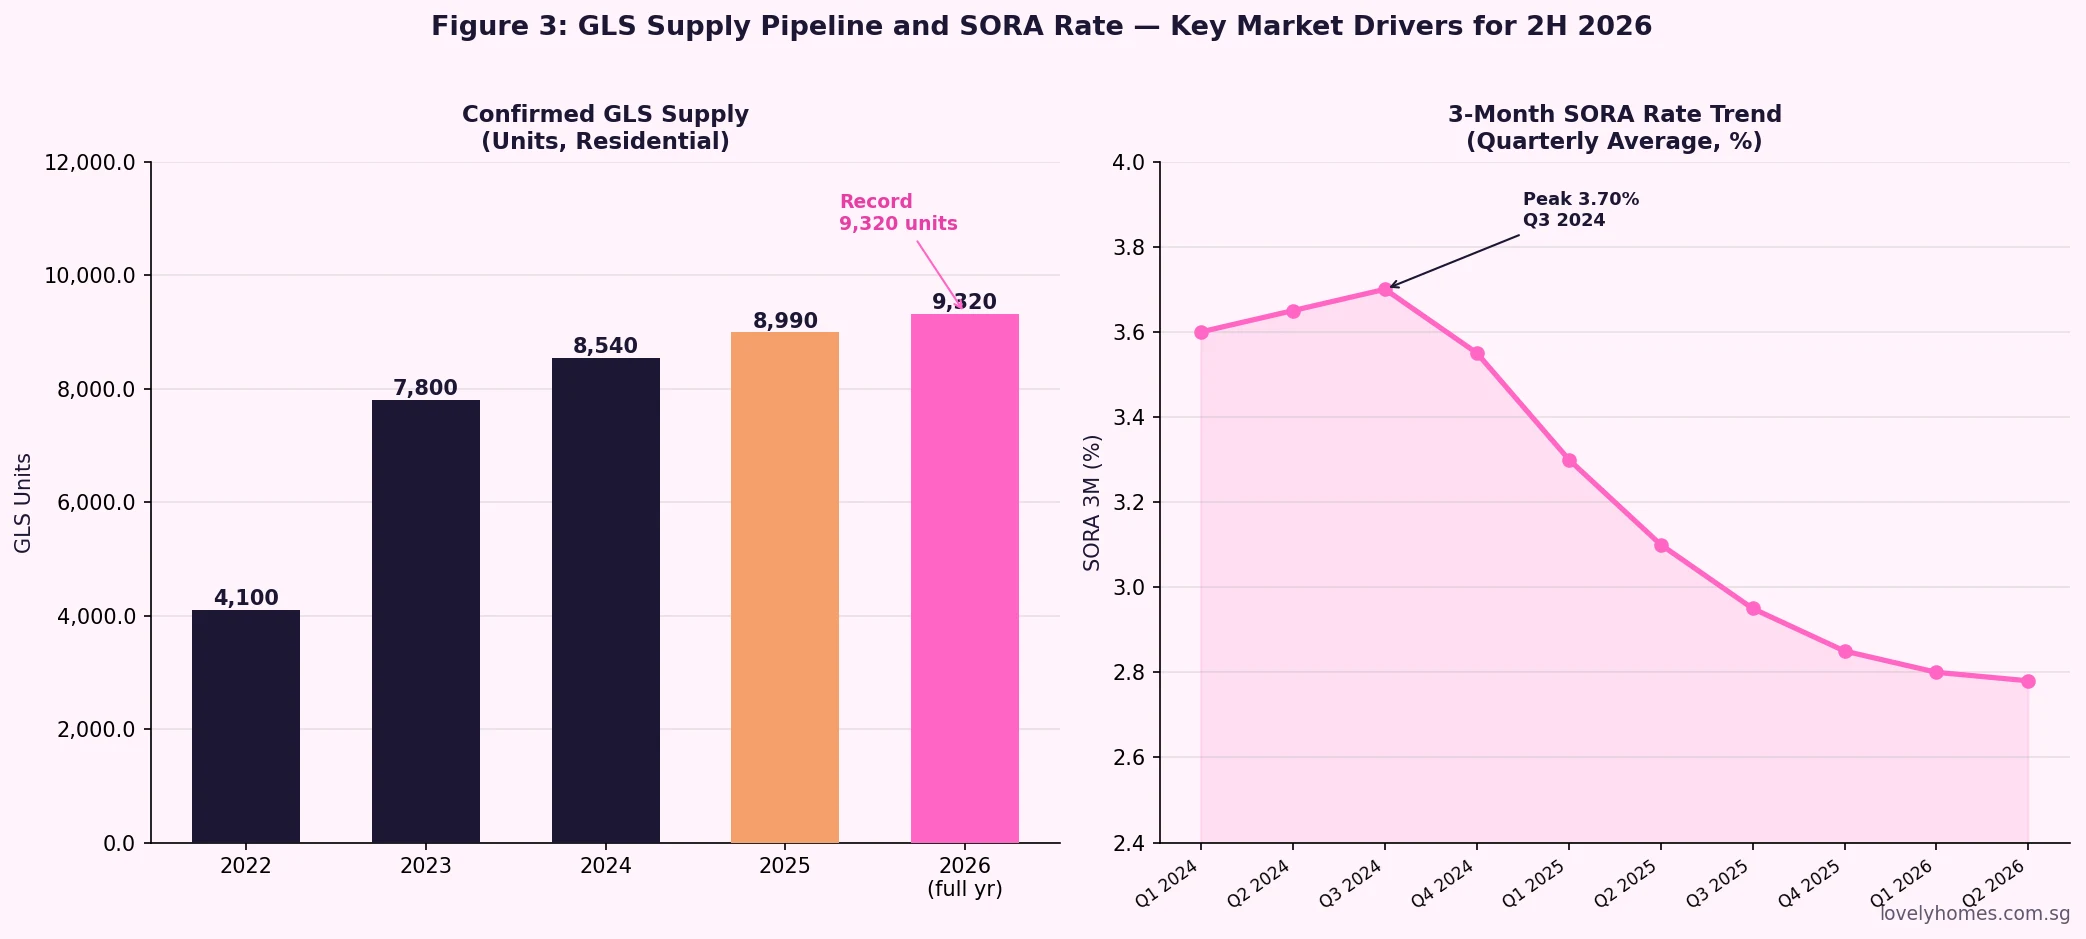
- GLS supply: 4,745 units on H2 2026 Confirmed List; full-year 9,320 units — >50% above 10-year annual average
Private Residential Prices: Overall and By Segment
The headline 0.5% price gain for Q2 2026 represents a deceleration from Q1’s 0.9% and brings the cumulative H1 2026 increase to 1.4% — modestly below the 1.8% recorded in H1 2025. The Government’s statement accompanying the release notes that the macroeconomic outlook “remains highly uncertain” and advises households to “exercise prudence when purchasing property and taking out mortgage loans.”
Landed vs Non-Landed: A Tale of Two Markets
The landed segment swung sharply to +2.5% in Q2 2026 after a -0.4% decline in Q1. This reversal was driven by a pick-up in Good Class Bungalow (GCB) and semi-detached transactions as domestic high-net-worth buyers — many of whom had paused in Q4 2025 and Q1 2026 — returned to the market. Landed supply in Singapore is constitutionally constrained: foreigners may not purchase landed homes without Singapore Land Authority (SLA) approval, and only certain long-term residents qualify. This structural scarcity underpins landed prices over the medium to long term.
Non-landed properties, by contrast, edged down 0.1% — a modest reversal from Q1’s 1.3% gain. This masks a significant regional split: the CCR gained 1.8% (its strongest quarter in 18 months) while the RCR fell 1.2% (likely reflecting large-unit resale softness at the city fringe) and the OCR was nearly flat at -0.1%.
Why Is the CCR Outperforming?
The CCR’s return to outperformance in Q2 2026 likely reflects several converging factors. First, the ABSD shock of April 2023 (foreigners’ rate raised to 60%) had suppressed CCR demand for several quarters; two years on, some wealthy buyers have adjusted and are re-entering. Second, Singapore’s continued status as a global wealth hub — reflected in new family office registrations and ultra-high-net-worth relocations — has sustained demand for trophy units in Orchard, Nassim and Marina Bay. Third, the CCR pipeline is tighter relative to its buyer pool than it was three years ago.
Developer Sales, Launches and Resale Market

Developer Market
Developers launched 1,783 uncompleted private residential units (excluding Executive Condominiums) in Q2 2026, slightly below Q1’s 1,844. Developer sales of 2,141 units exceeded launches for the first time since Q4 2024, implying that unsold inventory from previously launched projects was absorbed. The launch-to-sale ratio of 1.20 (sales exceeding launches) is healthy and suggests no near-term overhang problem at the new-launch segment.
For ECs, the quarter was notably quiet: zero EC units were launched (vs 1,320 in Q1 2026, which had included a large EC project), and 175 EC units were sold from prior launches.
Resale Market
The resale segment was Q2 2026’s standout story. At 3,813 transactions (excluding ECs), resales hit a level not seen since Q2 2022. Resales now account for 62.0% of all private residential sales — up from 59.6% in Q1 — confirming a structural shift towards secondary-market activity as HDB upgraders and move-up buyers transact on existing stock rather than waiting for new launches. Sub-sales (a proxy for speculative flipping) rose modestly to 194 transactions (3.2% of total), unchanged as a proportion — suggesting no alarming speculative uptick.
Supply Pipeline and Completions
Pipeline: Unsold Inventory Trending Down
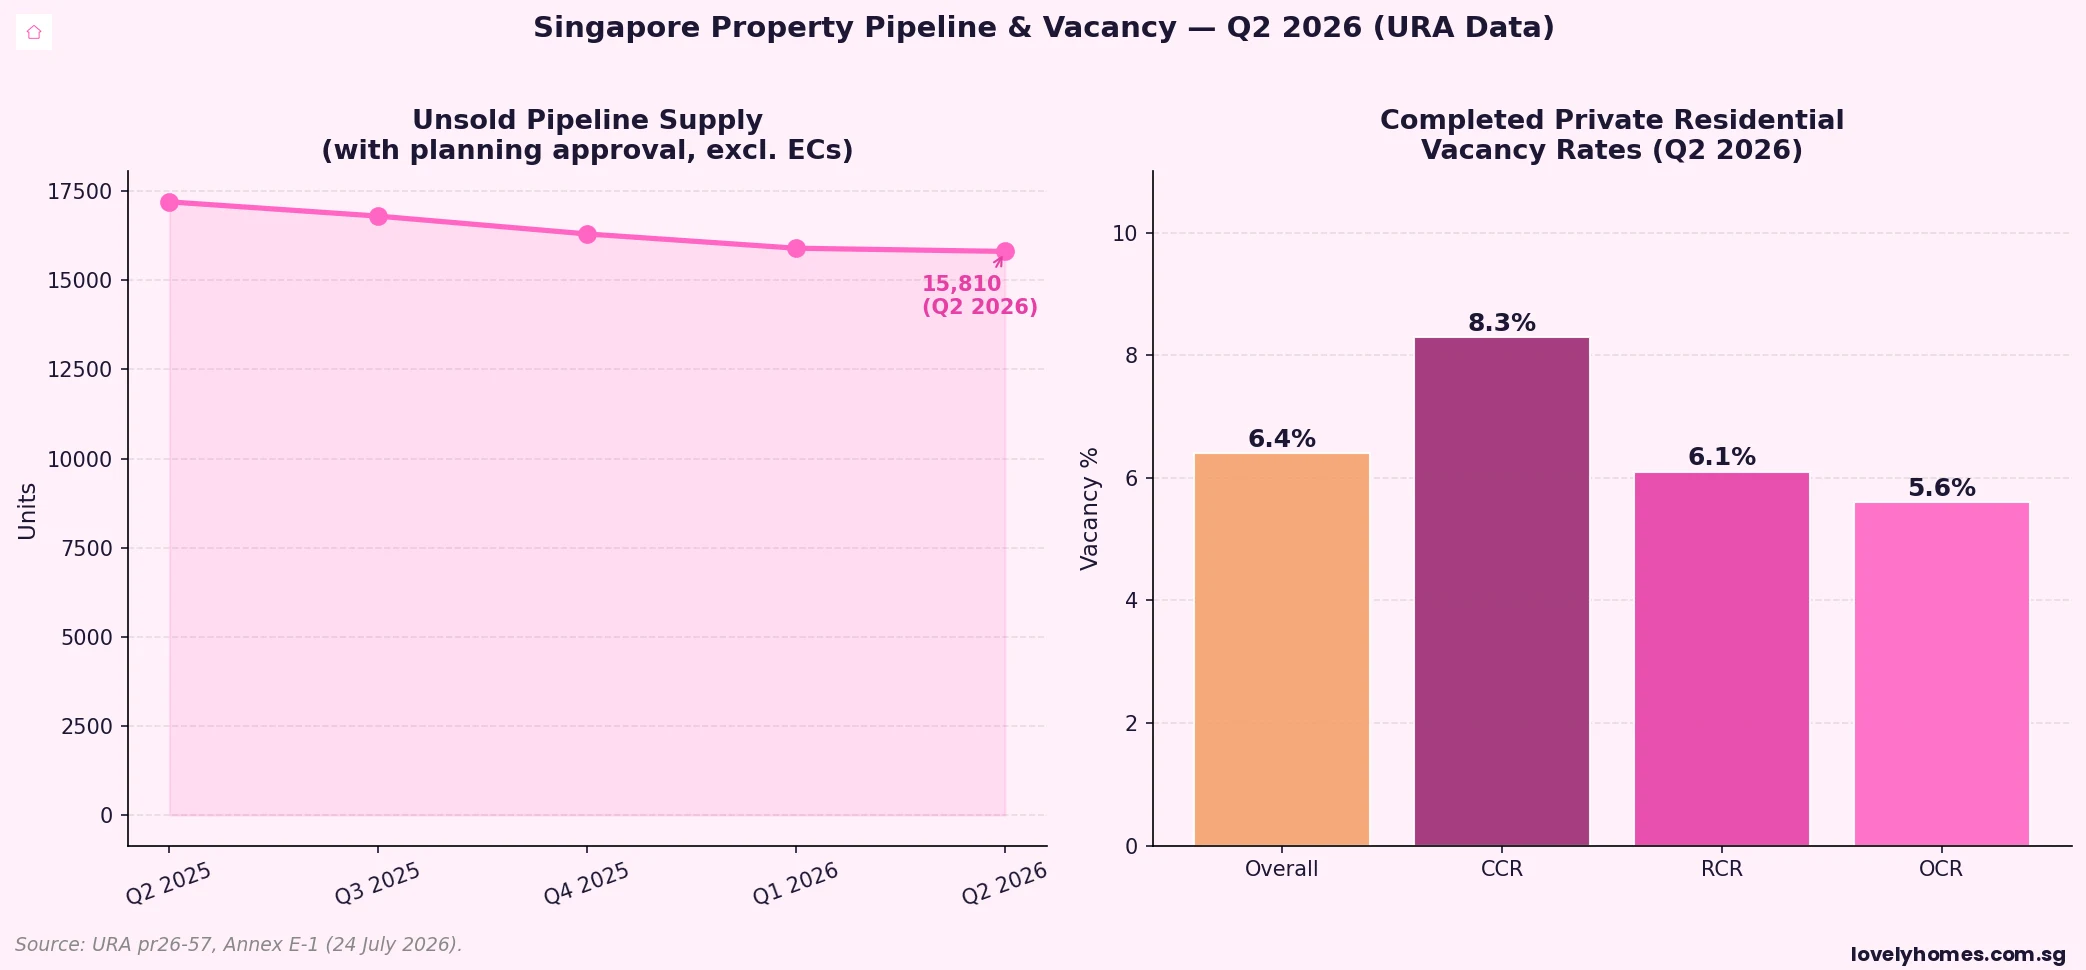
As at end-Q2 2026, there were 42,472 units in the supply pipeline with planning approval (including ECs), of which 15,810 remained unsold. This is near the lowest level in five years, consistent with the steady absorption that developer sales data shows. An additional 18,153 unsold units — including 4,745 on the H2 2026 Confirmed List — have not yet received planning approval, meaning the market will need to absorb significant future supply.
Looking further out, about 60,600 private residential units (including ECs) are expected to complete in the coming years: approximately 25,900 by 2028 and 34,700 from 2029 onwards. This completions pipeline is substantial and is one reason the Government has signalled that it is maintaining — not cutting — GLS supply: the full-year 2026 Confirmed List of 9,320 units is more than 50% above the 10-year annual average.
Vacancy: Rising Slightly, Still Manageable
The overall vacancy rate for completed private residential units (excluding ECs) rose to 6.4% in Q2 2026, from 6.2% in Q1. By region: CCR 8.3% (up from 8.2%), RCR 6.1% (down from 6.3%), OCR 5.6% (up from 5.2%). The CCR’s persistently high vacancy reflects a structural feature of that market: prime units sit vacant between tenancies or are held as pied-à-terre by owners who travel frequently. An 8.3% CCR vacancy does not signal distress so long as rental yields and capital values are supported, but it does cap near-term rental upside.
Rental Market (Q2 2026)
Rentals of private residential properties rose 0.7% overall in Q2 2026 (vs +0.3% in Q1). Landed rentals surged 2.7% (vs +0.1% in Q1), likely driven by a tight landed-rental supply and demand from expat families seeking landed homes in prime districts. Non-landed rentals rose 0.4% overall. By region: CCR +1.2%; RCR unchanged (0.0%); OCR -0.3%.
The OCR rental decline (-0.3%) may partly reflect elevated new supply in suburban areas as completions outpaced absorption. For investors holding OCR condos, rental yields remain the highest of the three regions but gross yields face mild downward pressure if the completions pipeline delivers on schedule.
Commercial Property: Office and Retail (Q2 2026)
While the LovelyHomes editorial focus is primarily residential, the URA Q2 2026 release covers all property sectors.
Office: Prices +0.4% (vs +0.2% in Q1); rentals +0.8% (vs -0.2% in Q1 — a meaningful reversal). The island-wide office vacancy rose to 11.0% (from 10.8%), as completions outpaced net take-up. Pipeline: 848,000 sqm GFA.
Retail: Prices +0.8% (vs +2.2% in Q1); rentals +0.6% (vs -0.6% in Q1 — also a reversal). Retail vacancy rose to 6.5% (from 6.3%), with net occupied space declining for the second consecutive quarter. Pipeline: 604,000 sqm GFA.
Q2 2026 Key Statistics: Summary Table
| Metric | Q1 2026 | Q2 2026 | Change |
|---|---|---|---|
| Overall PPI (private residential) | +0.9% | +0.5% | Slower |
| Landed prices | -0.4% | +2.5% | Sharp rebound |
| Non-landed overall | +1.3% | -0.1% | Reversed |
| Non-landed CCR | +0.6% | +1.8% | Accelerated |
| Non-landed RCR | +0.8% | -1.2% | Reversed sharply |
| Non-landed OCR | +2.2% | -0.1% | Stalled |
| Rental index (overall) | +0.3% | +0.7% | Strengthened |
| Developer launches (excl. ECs) | 1,844 | 1,783 | -61 units |
| Developer sales (excl. ECs) | 2,013 | 2,141 | +128 units |
| Resale transactions (excl. ECs) | 3,225 | 3,813 | +588 (18%) |
| Vacancy rate (overall, excl. ECs) | 6.2% | 6.4% | +0.2pp |
| Unsold pipeline (w/ planning approval) | ~15,900 | 15,810 | Declining |
Source: URA pr26-57, 24 July 2026. Q1 2026 unsold pipeline is an estimate.
Worked Example: How Q2 2026 Data Affects a Purchase Decision
Consider a Singapore Citizen (SC) couple deciding in July 2026 between purchasing a resale condo unit in the CCR versus an OCR project. They have S$800,000 in combined savings and CPF Ordinary Account (OA) and earn S$18,000 per month combined.
| Consideration | CCR Option (D10 condo) | OCR Option (D18 condo) |
|---|---|---|
| Unit: 800 sqft, 2BR+study | S$3,200,000 (S$4,000 psf) | S$1,280,000 (S$1,600 psf) |
| BSD (IRAS, 2026) | S$112,600 | S$32,400 |
| ABSD (1st property SC) | Nil | Nil |
| 25% downpayment | S$800,000 | S$320,000 |
| 75% bank loan | S$2,400,000 | S$960,000 |
| Monthly mortgage (3.5% p.a., 25 yr) | ~S$11,980 | ~S$4,790 |
| TDSR limit (55% of S$18k) | S$9,900 — OVER TDSR | S$9,900 — serviceable |
| Downpayment available? | S$800k available = just covered | S$320k needed, S$800k available |
| Q2 2026 price direction | CCR +1.8% — momentum positive | OCR -0.1% — sideways |
| Estimated gross rental yield | 2.8–3.2% | 3.5–4.2% |
In this example, the CCR option fails the TDSR test: the monthly mortgage of S$11,980 exceeds the TDSR ceiling of S$9,900 (55% of S$18,000). The couple would need to either reduce the loan amount (larger downpayment) or choose a smaller unit. The OCR option is comfortably within TDSR. This exercise illustrates why the Q2 2026 CCR outperformance does not benefit all buyer segments equally — the CCR’s price point is simply inaccessible for median-income Singaporean households without significant liquid capital beyond CPF.
What This Means for Buyers, Sellers and Investors
For HDB upgraders eyeing OCR condos, the near-flat Q2 2026 OCR price movement is relatively benign — the dramatic outperformance of 2023 and early 2024 has unwound, and entry prices are more predictable. However, the strong resale market means good-value units are being absorbed quickly.
For investors watching the CCR, the +1.8% Q2 price gain is a meaningful reversal of trend, but the 8.3% vacancy and upcoming pipeline completions in districts 9 and 10 mean that rental yield compression remains a risk in the near term.
For sellers, the 3,813 resale transactions in Q2 suggest genuine market depth — the highest quarterly resale volume in four years. Well-priced units in good locations are transacting; overpriced listings are sitting.
What Might Come Next: H2 2026 Outlook
The following is forward-looking commentary based on current data trends. It is not a forecast or financial advice.
The Government’s explicit guidance to maintain a “high and steady supply” of private housing through GLS — with the 9,320-unit full-year 2026 Confirmed List — signals that price stability (rather than appreciation) is the policy goal. With H1 2026 cumulative gains of 1.4% already below H1 2025’s 1.8%, the full-year 2026 outcome is likely to settle in the 2–3% range for the overall index — assuming no major global macro shock. The landed sector, with structural scarcity and resilient wealth-based demand, may outperform. RCR could see continued choppiness as city-fringe supply normalises post-peak-launch years. OCR is the most policy-sensitive segment and will be watched closely for signals of demand-supply imbalance in Tampines North and Tengah.
Frequently Asked Questions About Singapore Property Market Q2 2026
Did private property prices rise or fall in Q2 2026?
Overall, private residential property prices in Singapore rose by 0.5% in Q2 2026, according to URA’s full statistics released on 24 July 2026 (pr26-57). This was slower than the 0.9% gain in Q1 2026, bringing the cumulative H1 2026 increase to 1.4%. Within this overall figure, landed prices rose a strong 2.5%, while non-landed prices edged down 0.1%. The CCR (Core Central Region) was the standout gainer at +1.8% for non-landed properties.
How does Q2 2026 compare to the same quarter last year?
URA’s full data release does not directly provide a year-on-year comparison for the price index, but based on the cumulative change data: H1 2026 private residential prices are up 1.4% versus H1 2025’s 1.8%. This suggests that the pace of price gains is moderating on a year-on-year basis. The resale market shows more resilience: 3,813 resale transactions in Q2 2026 compare favourably to lower quarterly volumes in 2025.
Why are developer sales higher than launches in Q2 2026?
Developer sales of 2,141 units exceeded launches of 1,783 units in Q2 2026 because buyers were purchasing from previously launched but unsold projects — specifically from launches in Q4 2025 and Q1 2026 that had not fully sold out at initial launch weekend. This “overhang absorption” is a normal market dynamic and is generally positive: it means developer inventory is being cleared without needing to discount prices aggressively.
What is the current vacancy rate for private residential properties?
As at end-Q2 2026, the overall vacancy rate for completed private residential units (excluding ECs) is 6.4%, up from 6.2% in Q1 2026. By region: CCR is 8.3%, RCR is 6.1%, and OCR is 5.6%. The CCR’s higher vacancy reflects its greater dependence on expatriate tenants and the structural tendency for prime units to sit between tenancies longer than mass-market units.
How much new supply is coming to the Singapore private housing market?
URA’s Q2 2026 data shows about 60,600 private residential units (including ECs) in the completions pipeline over the coming years: roughly 25,900 by 2028 and 34,700 from 2029 onwards. For new launches specifically, the H2 2026 GLS Confirmed List adds 4,745 units, bringing the full-year 2026 total to 9,320 units — over 50% above the 10-year annual average. This is a deliberate policy choice by the Government to maintain market stability through supply rather than additional demand-side measures.
Does the URA Q2 2026 data suggest a property crash is coming?
No. The URA data shows a gradually moderating market — not one in distress. Key indicators that would precede a significant correction (sharp ABSD increase, mass foreclosures, severe unemployment, major credit tightening) are not present in the Q2 2026 data. The Government’s stated policy is to maintain a “steady supply” and “stable” market, not to cool prices aggressively. However, the combination of high global uncertainty, elevated vacancy in CCR, and a large upcoming completions pipeline does mean that capital gains from private property should not be assumed. For official guidance, always consult MAS, URA and IRAS.
Related Articles
- ABSD Singapore 2026: Complete Guide to Additional Buyer’s Stamp Duty
- Singapore Property Cooling Measures Timeline 2009–2026
- OMG at Marina Gardens Lane — New Launch
- Aurea Singapore at Marina Bay
- THE ORIE at Toa Payoh — New Launch
Disclaimer
This article is based on URA press release pr26-57 released 24 July 2026 and is for general informational purposes only. It does not constitute financial, investment, legal or property advice. All price indices, transaction volumes, vacancy rates and rental figures are sourced from URA and are subject to revision. Prior-quarter estimates are indicative and sourced from industry data. Readers should not make property purchase or investment decisions based solely on this article. Consult a Singapore-registered property salesperson (CEA), lawyer and financial adviser before transacting. Official data: ura.gov.sg, eservice.ura.gov.sg/reis, iras.gov.sg, mas.gov.sg.
Tags: URA Q2 2026, Singapore property market, private residential, property price index, resale transactions, CCR RCR OCR, property news Singapore, landed property, rental index, real estate statistics