Dover Drive GLS 2026: RCR Benchmark Analysis — D05 Pricing, Investment Outlook and Buyer’s Guide
Quick Answer — Dover Drive GLS 2026: Key Facts
- Award date: 30 March 2026 by the Urban Redevelopment Authority (URA) under the 1H 2026 Confirmed List.
- Location: District 5 (D05), Queenstown Planning Area — RCR (Rest of Central Region), near Commonwealth MRT (EWL) and one-north MRT (CCL).
- Site: Approximately 15,700 sqm, GPR 3.5, yielding an estimated 285–320 residential units on a 99-year leasehold tenure.
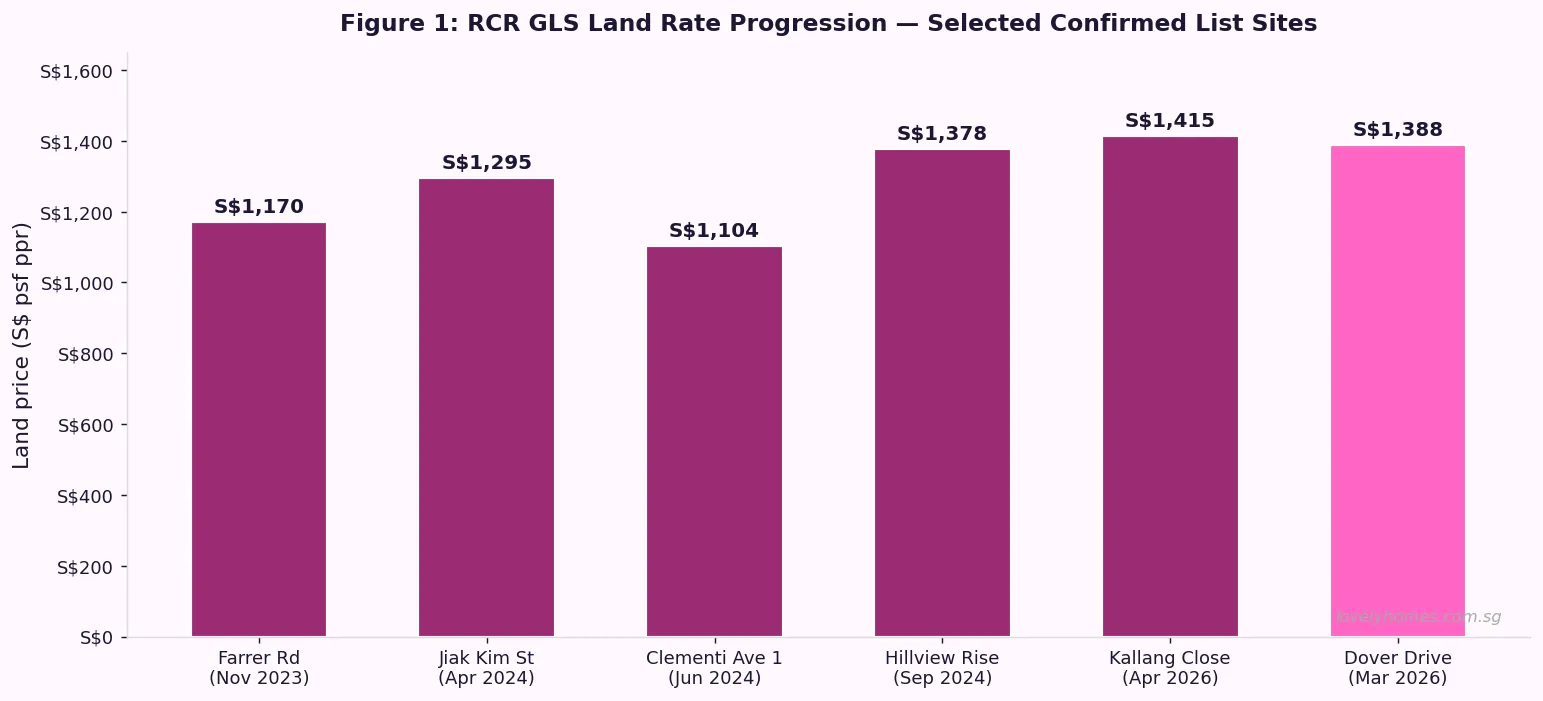
- Land price benchmark: Industry reports indicate the site was awarded at approximately S$1,388 psf ppr — consistent with recent RCR confirmed-list benchmarks (Kallang Close: S$1,415 psf ppr, April 2026).
- Estimated launch price: S$1,950–S$2,200 psf, translating to approximately S$1.6M–S$2.5M for a 1- to 3-bedroom unit.
- Investment case: The one-north employment node (Biopolis, Fusionopolis, Mediapolis) anchors strong rental demand; gross yields of 3.2–3.8% are achievable for well-located 1- and 2-bedroom units.
- ABSD note: Singapore Citizens purchasing their first property pay zero ABSD; second-property SC buyers face 20% ABSD on the full purchase price.
- Timeline: Construction typically takes 3–4 years post-tender; an estimated launch window of Q3–Q4 2027 is plausible.
What Is the Dover Drive GLS Site?
The Dover Drive Government Land Sales (GLS) site is a residential 99-year leasehold parcel released by the URA under Singapore’s 1H 2026 Confirmed List — the government’s bi-annual programme of land tenders intended to calibrate private housing supply. Situated along Dover Road in the Queenstown Planning Area (District 5), the site occupies a prime RCR position with direct connectivity to the East-West Line (EWL) at Commonwealth MRT and the Circle Line (CCL) at one-north MRT, making it one of the more strategically located parcels in the 1H 2026 tranche.
The tender closed on 26 March 2026 and the award was announced by URA on 30 March 2026. The land parcel measures approximately 15,700 sqm with a plot ratio (GPR) of 3.5, giving a maximum gross floor area (GFA) of roughly 54,950 sqm. Assuming an average unit size of 65–70 sqm net sellable, the site is expected to yield between 285 and 320 residential units, with a likely mid-to-high-rise tower configuration of 20–30 storeys.
Dover Road itself is a quiet, tree-lined arterial that runs through one of Singapore’s most established educational and research corridors — home to Ngee Ann Polytechnic, National University of Singapore (NUS), Anglo-Chinese School (Independent), NUS High School of Mathematics and Science, and the sprawling one-north cluster comprising Biopolis, Fusionopolis, Mediapolis, and the JTC LaunchPad. This employer and educational density creates structural demand for rental accommodation that underpins the investment case for any new launch in the area.
Why the Dover Drive GLS Land Rate Matters for RCR Pricing
Land price benchmarks set by GLS tenders directly feed into developers’ breakeven calculations, which in turn set the floor for launch prices. Understanding this chain of cost-pass-through is essential for any buyer or investor evaluating a new launch project.
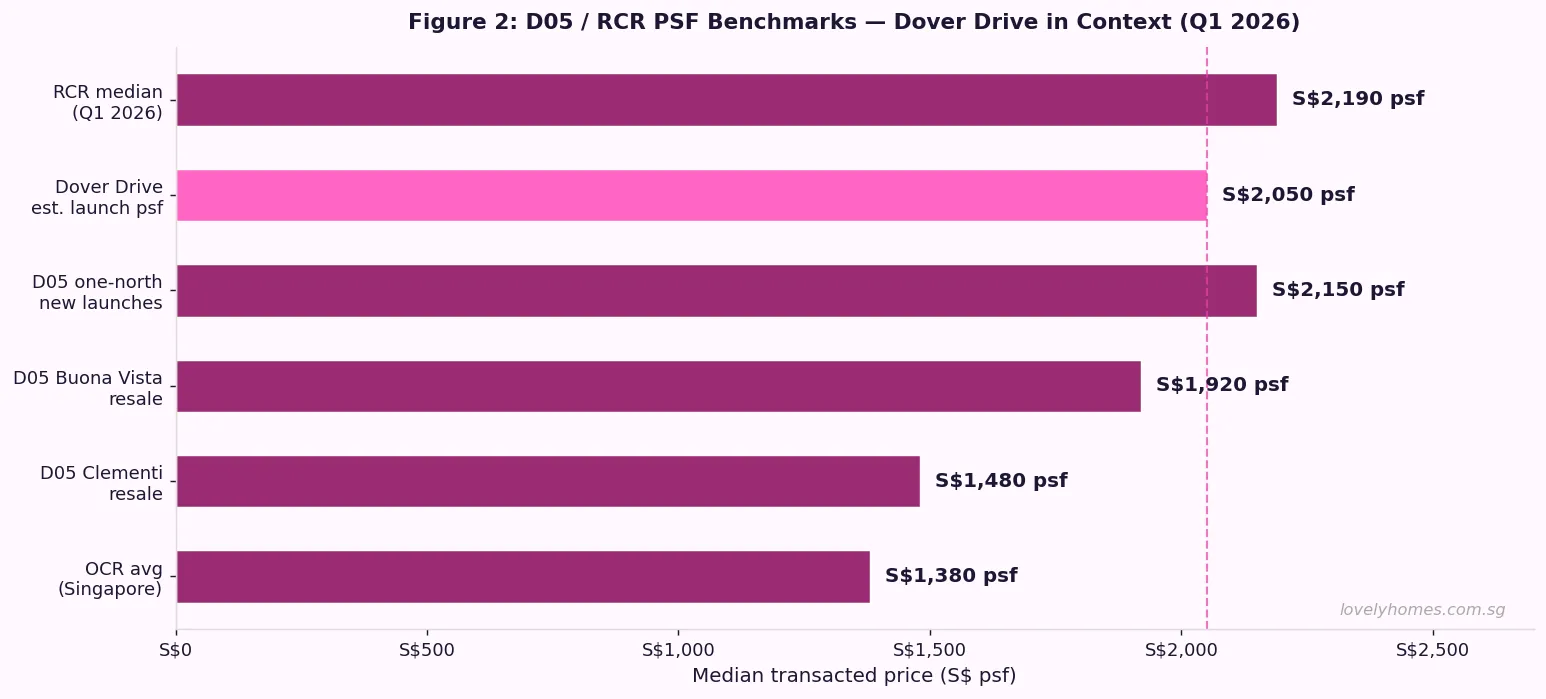
Industry analysts typically model a developer’s cost stack as follows: land acquisition + construction costs + professional fees + financing costs + developer’s margin (typically 12–18%). For a site awarded at approximately S$1,388 psf ppr, applying standard RCR assumptions yields an estimated breakeven of around S$1,800–S$1,950 psf. This directly informs the expected launch price range of S$1,950–S$2,200 psf, which would place Dover Drive’s future project solidly within the upper end of the RCR market — above Clementi resale averages (S$1,480 psf) but below CCR new launches at S$3,000+ psf.
Comparable RCR benchmarks further contextualise this data point:
- Kallang Close GLS (awarded April 2026): S$1,415 psf ppr — Frasers-Mitsubishi consortium, RCR Kallang.
- Hillview Rise GLS (awarded September 2024): S$1,378 psf ppr — OCR-adjacent, Bukit Timah fringe.
- Clementi Avenue 1 GLS (awarded June 2024): S$1,104 psf ppr — pure OCR, lower land cost.
Dover Drive’s estimated rate of S$1,388 psf ppr is consistent with RCR pricing dynamics — meaningfully above Clementi’s OCR land cost but below the S$1,491 psf ppr that Sim Lian paid for the Holland Plain (CCR) site in May 2026. The distinction matters: buyers purchasing at Dover Drive’s expected launch price are paying for a genuine RCR location with CCR-adjacent amenities, at a price point below CCR launch levels.
The one-north and Educational Corridor — Rental Demand Drivers
Any investment analysis of Dover Drive begins with an honest audit of who will actually rent the units. The answer, in this precinct, is unusually clear: the one-north employment cluster is one of Singapore’s highest-density concentrations of knowledge-economy jobs. Biopolis alone houses more than 50 biomedical research institutes; Fusionopolis is home to agencies including the Infocomm Media Development Authority (IMDA), A*STAR, and dozens of private-sector technology firms; Mediapolis anchors Singapore’s media and digital-content industry; and the JTC LaunchPad at one-north houses hundreds of startups. The combined workforce exceeds 50,000 employees — many of them well-paid professionals who prefer to rent within walking or short-MRT distance of the office.
Layered on top of this is the NUS student and postdoctoral research community. NUS enrolls approximately 40,000 students annually, with a significant proportion drawn from overseas or from Singapore households that prefer students to live near campus. The NUS High School of Mathematics and Science and ACS(I) add another demographic of parents willing to pay a premium for proximity to these schools.
This confluence of rental demand drivers — high-income working professionals at one-north and a large academic community at NUS — provides the structural basis for Dover Drive’s rental yield projections of 3.2–3.8% gross for 1- to 2-bedroom units. For a 1BR unit estimated at S$1.65M, an annual rental income of approximately S$58,000 (S$4,800/month) would represent a gross yield of 3.5%. By comparison, the broader RCR median gross yield for private condos in Q1 2026 sits at approximately 3.3%, suggesting Dover Drive’s micro-location may support a modest yield premium.
Summary: Key Site Parameters and Investment Metrics
| Parameter | Detail |
|---|---|
| GLS site address | Dover Drive, Queenstown Planning Area, D05 |
| URA tender award | 30 March 2026 (1H 2026 Confirmed List) |
| Tenure | 99-year leasehold |
| Site area | ~15,700 sqm |
| Plot ratio (GPR) | 3.5 |
| Maximum GFA | ~54,950 sqm |
| Estimated units | 285–320 residential units |
| Est. land rate | ~S$1,388 psf ppr (industry estimate) |
| Est. launch price | S$1,950–S$2,200 psf |
| MRT access | Commonwealth MRT (EWL) ~800m; one-north MRT (CCL) ~1.2km |
| Est. gross rental yield | 3.2–3.8% (1BR–2BR) |
| Est. launch window | Q3–Q4 2027 (subject to construction timeline) |
Acquisition Costs by Buyer Profile
Stamp duty is a material cost element that varies significantly by buyer profile. For a Dover Drive 2-bedroom unit estimated at S$2.05M, the total stamp duty picture looks as follows:
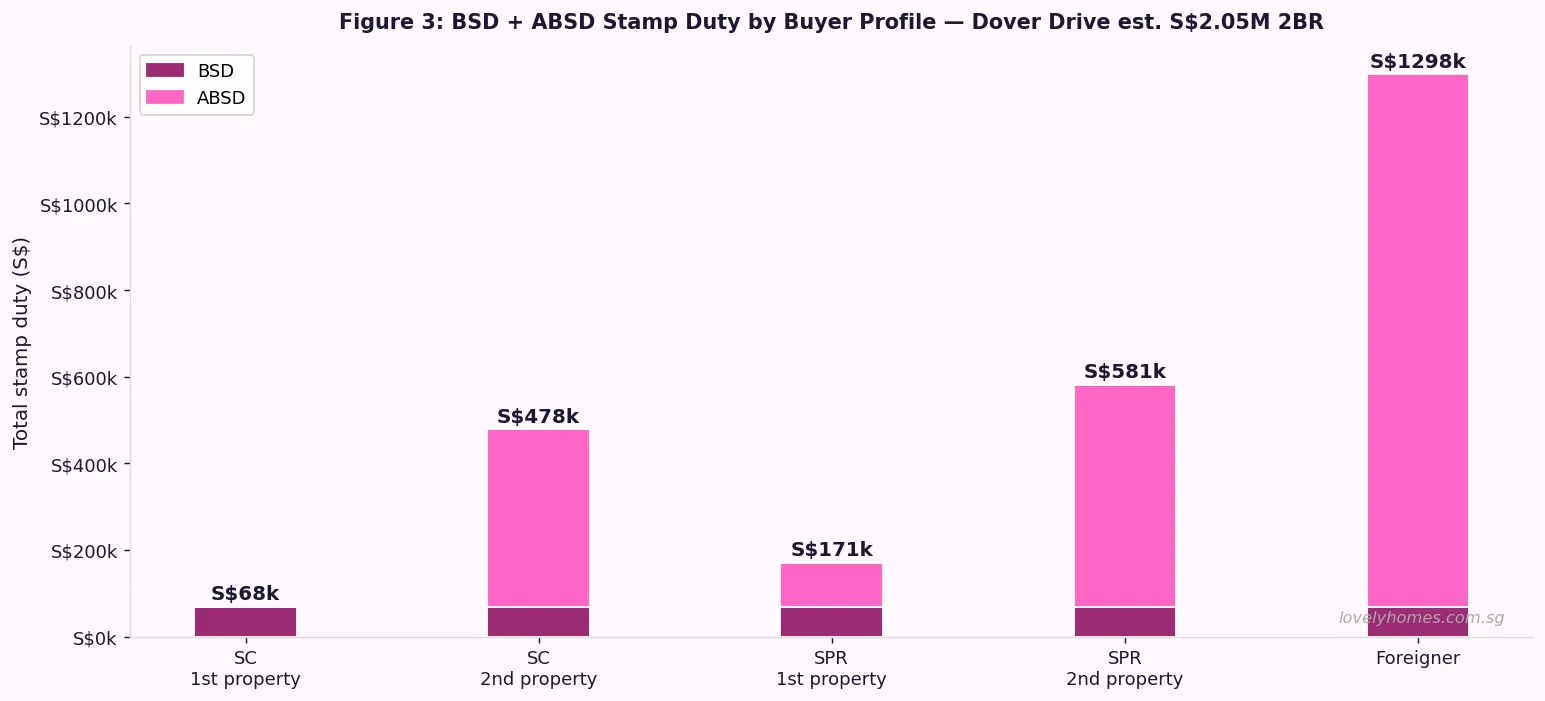
The Buyer’s Stamp Duty (BSD) is payable by all buyers on a progressive scale administered by the Inland Revenue Authority of Singapore (IRAS). For a S$2.05M purchase, BSD is calculated as: 1% on the first S$180,000 + 2% on the next S$180,000 + 3% on the next S$640,000 + 4% on the next S$500,000 + 5% on the remaining S$550,000 = S$68,400 BSD.
Singapore Citizens (SC) purchasing their first residential property pay zero Additional Buyer’s Stamp Duty (ABSD) — making their total stamp duty S$68,400 (3.3% of purchase price). SC purchasing a second property face 20% ABSD (S$410,000) on top of BSD, bringing total stamp duty to S$478,400 — a 23.3% effective rate that significantly alters the investment calculus. Foreign purchasers face a 60% ABSD rate under the April 2023 cooling measures, amounting to S$1,230,000 on a S$2.05M unit — effectively making Dover Drive economically inaccessible to most foreigners absent exceptional circumstances.
Worked Example: Mr and Mrs Yeo — SC Couple, First Property
Worked Example — SC Couple, First Property, Dover Drive 2BR S$2.05M
Profile: Mr and Mrs Yeo, both Singapore Citizens, combined monthly income S$14,000. First residential property purchase. Both currently renting.
BSD: S$68,400 (IRAS progressive scale)
ABSD: S$0 (SC first property)
Total stamp duty: S$68,400
Bank loan (75% LTV): S$1,537,500
Cash / CPF downpayment (25%): S$512,500
→ Minimum cash (5% of purchase price): S$102,500
→ Balance via CPF OA: up to S$410,000
Monthly repayment (3.0% p.a., 25 years): S$7,291/month
TDSR (55% x S$14,000 = S$7,700 limit): 52.1% ✓ PASS
Upfront cash required:
Cash downpayment: S$102,500
BSD: S$68,400
Legal fees (est.): S$4,500
Valuation + misc: S$2,000
Total upfront: ~S$177,400
At 3.0% interest over 25 years, the Yeos’ monthly repayment of S$7,291 sits comfortably within the TDSR threshold of S$7,700 (55% of S$14,000 joint income). Their CPF Ordinary Account savings of approximately S$200,000 combined can fund part of the S$410,000 CPF portion of the downpayment, with the remainder drawn from cash savings or supplementary CPF contributions over time.
Estimated gross rental yield if rented out instead of owner-occupied: 3.5% p.a. (~S$5,979/month). Net yield after property tax and maintenance: approximately 2.8%.
What This Means for D05 Buyers and the Broader RCR Market
The Dover Drive GLS award is significant beyond the single site. As one of only a handful of RCR parcels released under the 1H 2026 Confirmed List, its land price sets a reference point that influences pricing expectations for the entire D05/RCR resale and new-launch market. Sellers of resale condos in the Commonwealth, Holland Road, and Queenstown sub-markets now have a credible data point to anchor asking prices — and buyers negotiating resale prices will find it harder to push below this implied new-launch floor.
For the broader Singapore property market, the moderate RCR land rate — lower than the CCR Holland Plain rate of S$1,491 psf ppr — signals that developers retain some pricing discipline even in sought-after corridors. The government’s continued steady release of GLS land is its primary mechanism for moderating price growth, and the 1H 2026 programme’s 3,940 confirmed-list private residential units (down from 5,030 in 2H 2025) suggests a deliberate calibration toward managing supply without flooding the market.
What Might Come Next — D05 Outlook
Looking ahead, several catalysts could further support property values in the Dover Drive / D05 corridor. The Greater Southern Waterfront (GSW) masterplan — which progressively redevelops the southern coastline from Pasir Panjang to Marina East — extends northward influence into the Queenstown and Buona Vista sub-markets. The planned relocation of Pasir Panjang Terminal operations would unlock significant waterfront land, adding long-term capital appreciation potential to nearby residential markets.
On the infrastructure side, the Cross Island Line (CRL), while primarily serving the north-eastern and eastern corridors in its Phase 1 (2030), has a future stage tentatively planned to connect through the one-north cluster — a development that, if confirmed, would add a third MRT line to the already well-served D05 corridor. Any CRL confirmation would likely catalyse a rerating of D05 property values.
However, buyers should also consider the risks. At an estimated S$1,950–S$2,200 psf, Dover Drive’s future project will be priced at a meaningful premium to current D05 resale condos (~S$1,480–S$1,920 psf), requiring a positive view on continued capital appreciation. Macroeconomic headwinds — including the possibility of higher-for-longer interest rates and global growth slowdowns — could dampen transaction volumes and delay capital appreciation timelines. As with all 99-year leasehold properties, buyers should factor in lease-decay risk on a 30–40 year holding horizon.
FAQ — Dover Drive GLS and D05 Property
When will the Dover Drive GLS development be launched for sale?
Following the tender award on 30 March 2026, the winning developer typically requires 12–18 months for design, planning approval, and showflat construction. A public launch in Q3–Q4 2027 is a plausible estimate, though this depends on the developer’s sales strategy and market conditions at the time. Watch URA’s Urban Redevelopment Authority website and the developer’s official project website for the official preview and balloting dates.
Is Dover Drive OCR or RCR, and does it matter?
Dover Drive falls within the Rest of Central Region (RCR) — a classification that sits between the Outside Central Region (OCR, predominantly HDB heartlands and suburban private estates) and the Core Central Region (CCR, the prime districts D9/D10/D11). RCR typically offers better connectivity and amenities than OCR at a price premium, but without the full CCR price point. For foreign buyers, ABSD applies equally across all regions at 60% (effective 27 April 2023), so the OCR/RCR/CCR distinction does not affect ABSD liability — only the underlying purchase price does.
Can a Singapore Permanent Resident (SPR) buy at Dover Drive?
Yes. Singapore Permanent Residents (SPR) may purchase private condominiums, including any new launch at the Dover Drive site, without SLA approval — unlike landed property. An SPR purchasing their first residential property pays 5% ABSD, while an SPR buying a second or subsequent property faces 25% ABSD. SPRs may use their CPF Ordinary Account savings for the downpayment and monthly instalments, subject to the CPF housing withdrawal limits and the property’s remaining lease (99-year leasehold from 2026 means the CPF Valuation Limit is unlikely to be a constraint for most SPRs of working age).
How does Dover Drive compare to the Holland Plain GLS (D10, CCR)?
The Holland Plain GLS site (awarded 12 May 2026 to Sim Lian, D10 CCR) is a meaningfully different proposition. At S$1,491 psf ppr land rate versus Dover Drive’s estimated S$1,388 psf ppr, Holland Plain commands a ~7% land cost premium — which flows through to an expected launch price range of S$3,100–S$3,800 psf versus Dover Drive’s S$1,950–S$2,200 psf. Holland Plain is freehold, a significant tenure advantage for long-term holders. Dover Drive offers a far more accessible absolute entry price (S$1.6M–S$2.5M for 1–2BR vs S$3M+ at Holland Plain) and a larger pool of qualifying buyers under TDSR constraints. The rental demand profiles also differ: Holland Plain targets expatriate families and CCR high-net-worth buyers, while Dover Drive targets the one-north professional and NUS academic community.
What schools are near Dover Drive?
The Dover Drive corridor is exceptionally well served by reputable schools. Within 1–2km: NUS High School of Mathematics and Science (gifted programme), Anglo-Chinese School (Independent) (ACS(I), IBDP and O-Level), and Ngee Ann Polytechnic (tertiary). Within 2–3km: New Town Primary School and Queenstown Primary School (both established neighbourhood schools). The broader D05 area also has access to Henry Park Primary School (within 1km of Holland Village, approximately 2.5km from Dover Drive) and National University of Singapore (walking distance). This educational density is a strong structural driver of rental demand from both families and the academic community.
What happens to existing D05 resale condo prices when Dover Drive launches?
Historically, a new GLS launch at a higher per-psf price than the surrounding resale market creates an upward anchoring effect on resale prices. Sellers and agents use the new launch’s pricing as a reference point to justify higher resale asking prices. In the near term (pre-launch), resale condos in the Commonwealth, Ghim Moh, and Holland Road area may see modest appreciation as market participants anticipate the new benchmark. However, any uplift is not guaranteed — if the new launch is poorly received or market conditions weaken, the anticipated anchor effect may not materialise. Buyers should evaluate each resale transaction on its own merits rather than assuming new-launch pricing always lifts the entire sub-market.
Can I use CPF to pay for Dover Drive?
Yes, subject to CPF Board rules on housing withdrawals. For a 99-year leasehold property where the remaining lease covers the buyer’s age to at least 95 years (i.e., at least 95 minus current age years remaining at the point of purchase), the full CPF housing withdrawal limit applies. For a 2026 purchase, the 99-year lease runs to 2125 — well beyond the 95-year threshold for all working-age buyers. CPF Ordinary Account (OA) savings may be used for the downpayment (above the minimum cash requirement of 5% of purchase price), monthly loan instalments (subject to the Valuation Limit and Withdrawal Limit), and stamp duty. Note that CPF accrued interest (currently 2.5% p.a. OA rate) must be returned to the CPF account on sale, which reduces net cash proceeds from any future disposal.