HDB Resale Market Q1 2026: First Price Decline in 7 Years — What It Means for Buyers and Sellers
For the first time in nearly seven years, Singapore’s HDB resale prices fell — even if only fractionally. HDB’s Q1 2026 Public Housing Statistics, released in April 2026, showed the Resale Price Index (RPI) declining 0.1% quarter-on-quarter to 203.4, the first quarterly dip since Q2 2019. The data paints a nuanced picture: overall resale volumes are cooling, year-on-year price growth has slowed sharply to just 1.2%, and yet million-dollar transactions reached a record 412 in Q1 2026 — a paradox that reveals the two-speed market now operating in Singapore’s public housing segment.
- HDB Resale Price Index (RPI): 203.4 — down 0.1% q-o-q (first quarterly decline since Q2 2019).
- Year-on-year price growth: +1.2% — the slowest since Q3 2023.
- Transaction volume: 6,179 resale transactions — down 4.5% year-on-year.
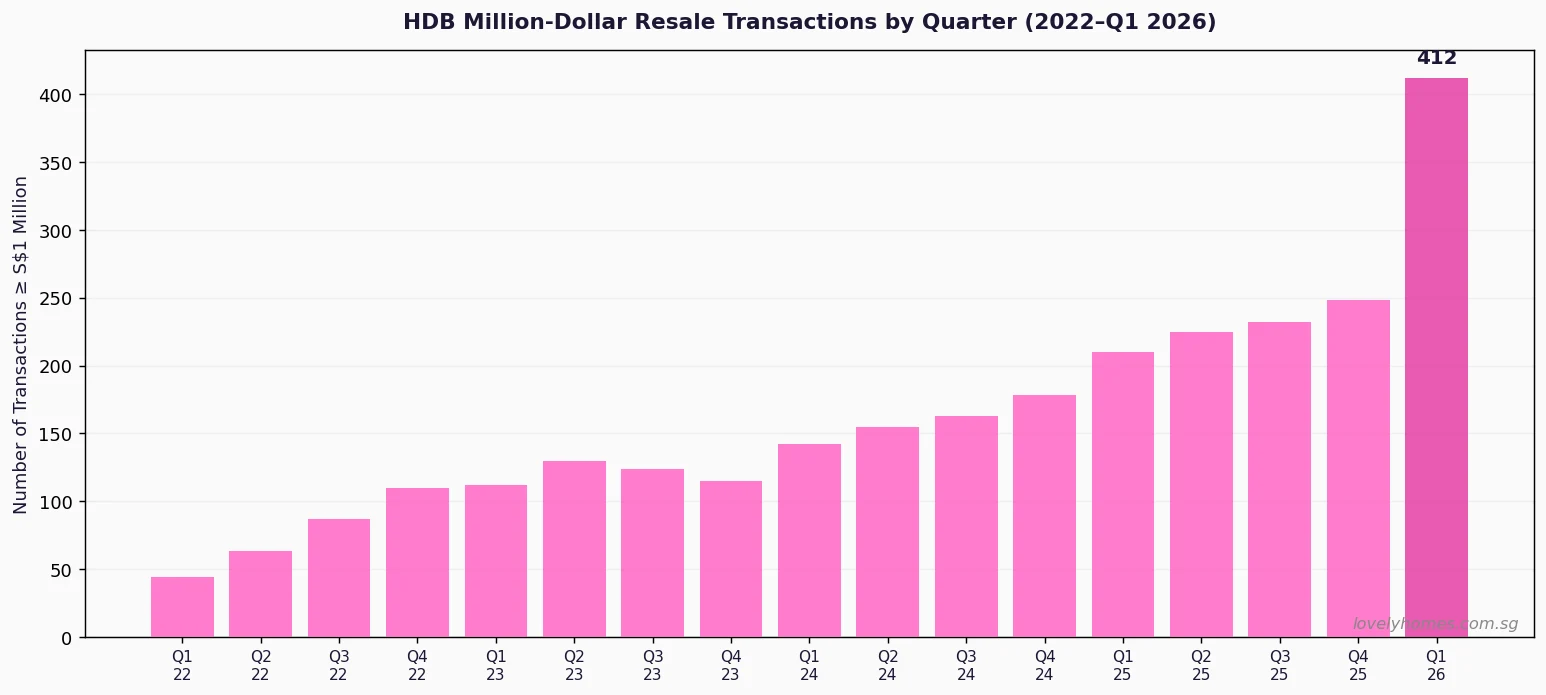
- Million-dollar transactions: 412 in Q1 2026 — a record high.
- MOP wave: approximately 13,480 HDB flats reached their 5-year MOP in 2026, nearly double the 2025 figure.
- Private rental market linkage: rental softening is reducing the “upgrade and rent out HDB” incentive for some owners, contributing to reduced speculative resale demand.
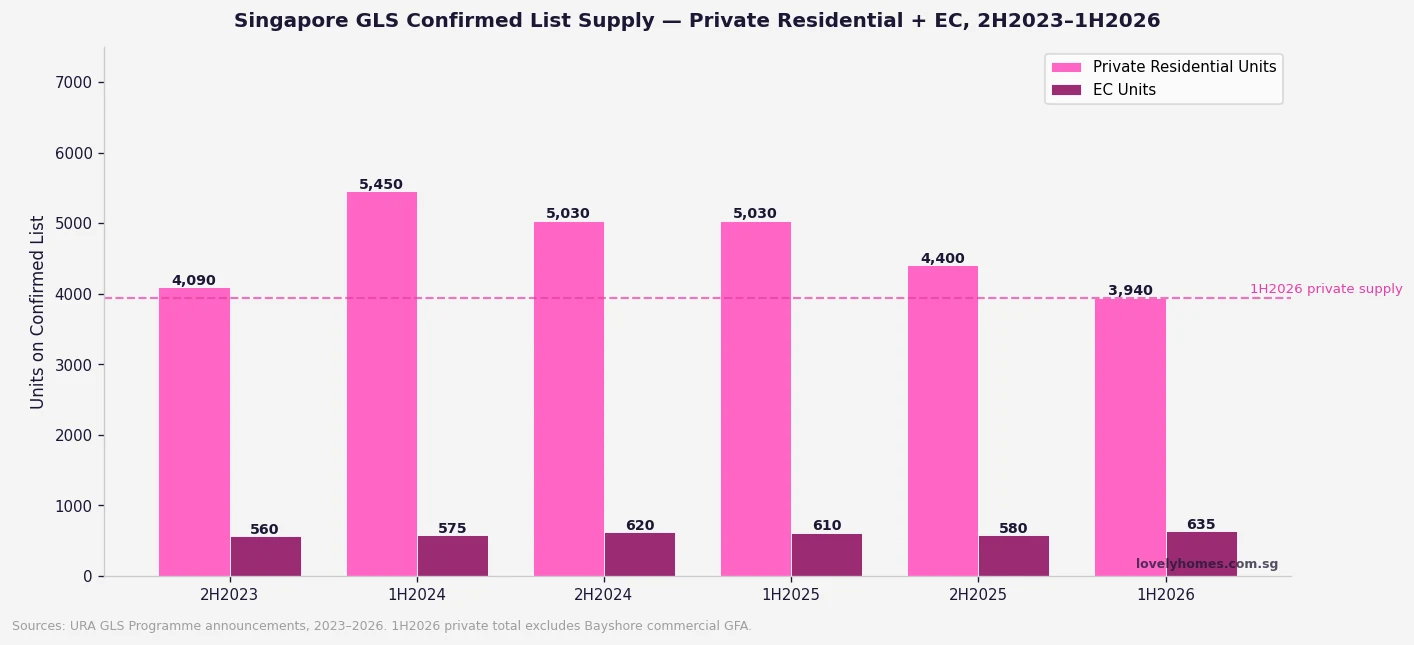
- Policy context: the Plus and Prime classification system (introduced in August 2023) is reshaping buyer segmentation as the first Plus/Prime resale eligibility windows approach.
The RPI Decline in Context: Seven Years of Unbroken Growth
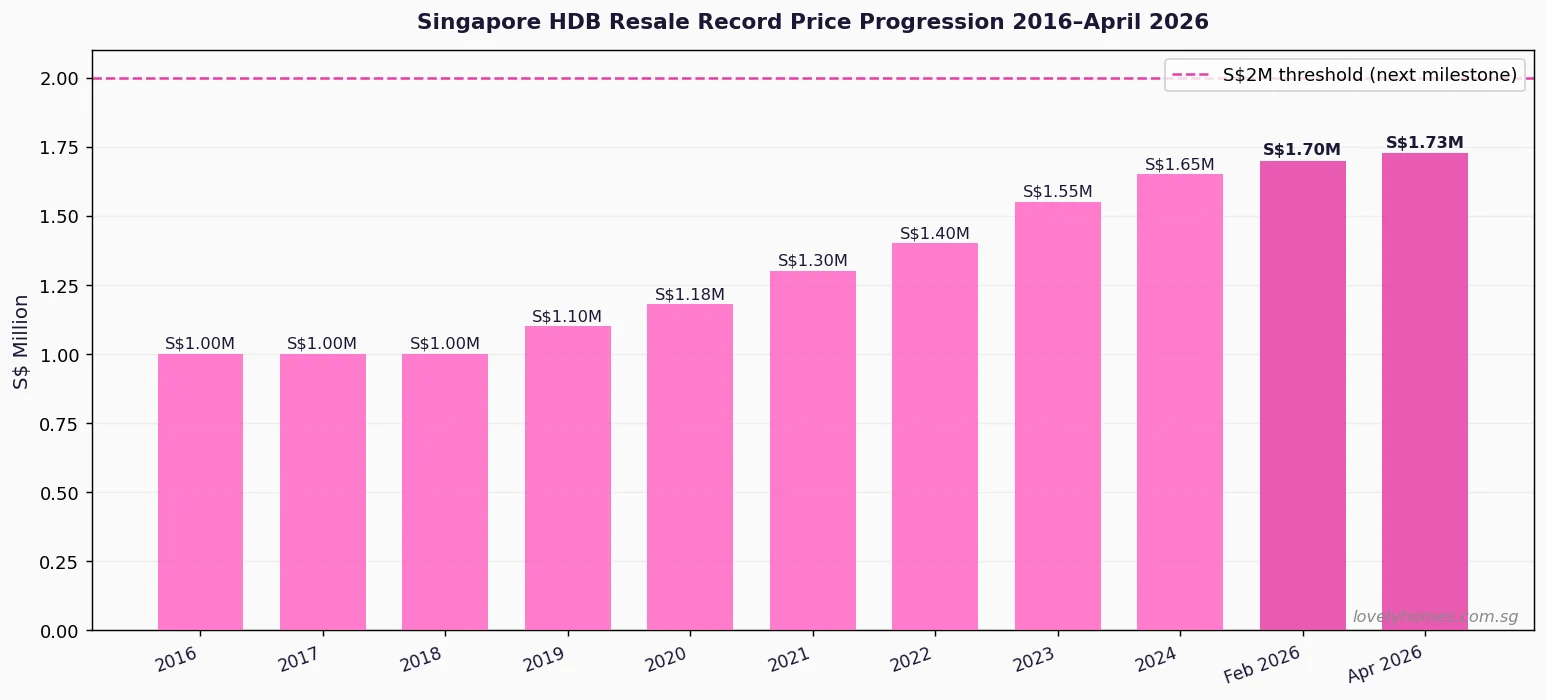
From Q3 2019 onwards, the HDB Resale Price Index rose every single quarter — through the pandemic (with brief deceleration), through the post-COVID demand surge, through the April 2023 cooling measures, and through 2024 and 2025. The cumulative appreciation from Q2 2019 (RPI ~133) to Q4 2025 (RPI 203.6) was approximately 52.7% — an extraordinary run for a heavily regulated, subsidised housing segment. The Q1 2026 dip to 203.4 represents a moderation of 0.2 index points, or 0.1% — statistically a rounding event, but symbolically significant as the end of an uninterrupted run.

HDB itself noted in its Q1 2026 release that the resale market had shown “a moderation in the rate of price increase over the past few quarters”, and that the supply of HDB flats reaching their Minimum Occupation Period (MOP) was rising sharply. The estimated 13,480 HDB flats reaching MOP in 2026 — nearly double the approximately 7,800 in 2025 — is the most consequential structural driver of the current cooling. As MOP-completed flat owners enter the market to sell and upgrade, both resale supply and demand are rising simultaneously, creating a more balanced trading environment.
The Million-Dollar Paradox: Record High Transactions, Cooling Overall
The headline number that appears contradictory is the record 412 million-dollar HDB transactions in Q1 2026. How can overall prices be falling while the number of million-dollar transactions is at an all-time high? The answer lies in market segmentation.
Million-dollar HDB transactions are concentrated in a narrow segment of premium units: large flats (5-room, maisonette, executive apartment) in high-value locations (Bukit Merah, Queenstown, Toa Payoh, Bishan, and the central belt broadly), often in high-floor, sought-after blocks with good views and remaining lease. In Q1 2026, the headline S$1.728M transaction for a Henderson Road flat set a new all-time record. These premium units are experiencing their own distinct supply constraint — there are simply very few of them coming onto the market in prime locations — and demand from upgraders and investors for these specific assets remains robust.

Meanwhile, in the broader resale market — the typical 4-room flat in a heartland town — the MOP wave is producing more supply than demand can fully absorb. Towns like Punggol, Sengkang, Tampines, and Woodlands are seeing increased listing volumes from the 2021 BTO cohort hitting their MOP, and buyers in these towns have more choices and more negotiating power than they did 12–18 months ago. The RPI dip is primarily a story of this broader heartland segment moderating, even as the premium central-belt segment continues to push records.
What This Means for HDB Resale Buyers and Sellers in 2026
| Scenario | Implication of Q1 2026 Data |
|---|---|
| Buyers — heartland towns (Punggol, Sengkang, Tampines, Woodlands) | More favourable conditions: more listings, softer asking prices vs 2024–2025, more negotiating room on resale premium over valuation. This is the best entry environment in 2–3 years for buyers in these areas. |
| Buyers — prime belt (Bukit Merah, Queenstown, Toa Payoh, Bishan) | Market still competitive for premium units. Sellers in these locations are holding firm given scarcity. Buyers should budget for cash-over-valuation (COV) at premium blocks. The RPI dip has not meaningfully softened these micro-markets. |
| Sellers — MOP-completing 2021 BTO cohort | Act sooner rather than later: the 13,480 MOP-completions in 2026 will peak and then taper. By Q3–Q4 2026, listing competition from MOP-completers will be at its highest. Sellers who list in Q2 2026 face less competition than those who list later in the year. |
| Upgraders (HDB → private) | The HDB-to-private upgrade path remains viable, but the ABSD 20% on a second property is unchanged. The cooling of HDB prices reduces the equity upgraders can extract from their resale. Careful timing of the sale-and-purchase sequence is critical — see our ABSD guide. |
| HDB landlords (subletting rooms) | The private rental market softening (private rents +0.3% in Q1 2026, vs +4–6% in 2022) is reducing the “upgrade and rent out HDB” equation’s attractiveness. This has reduced one strand of speculative demand for large HDB flats. |
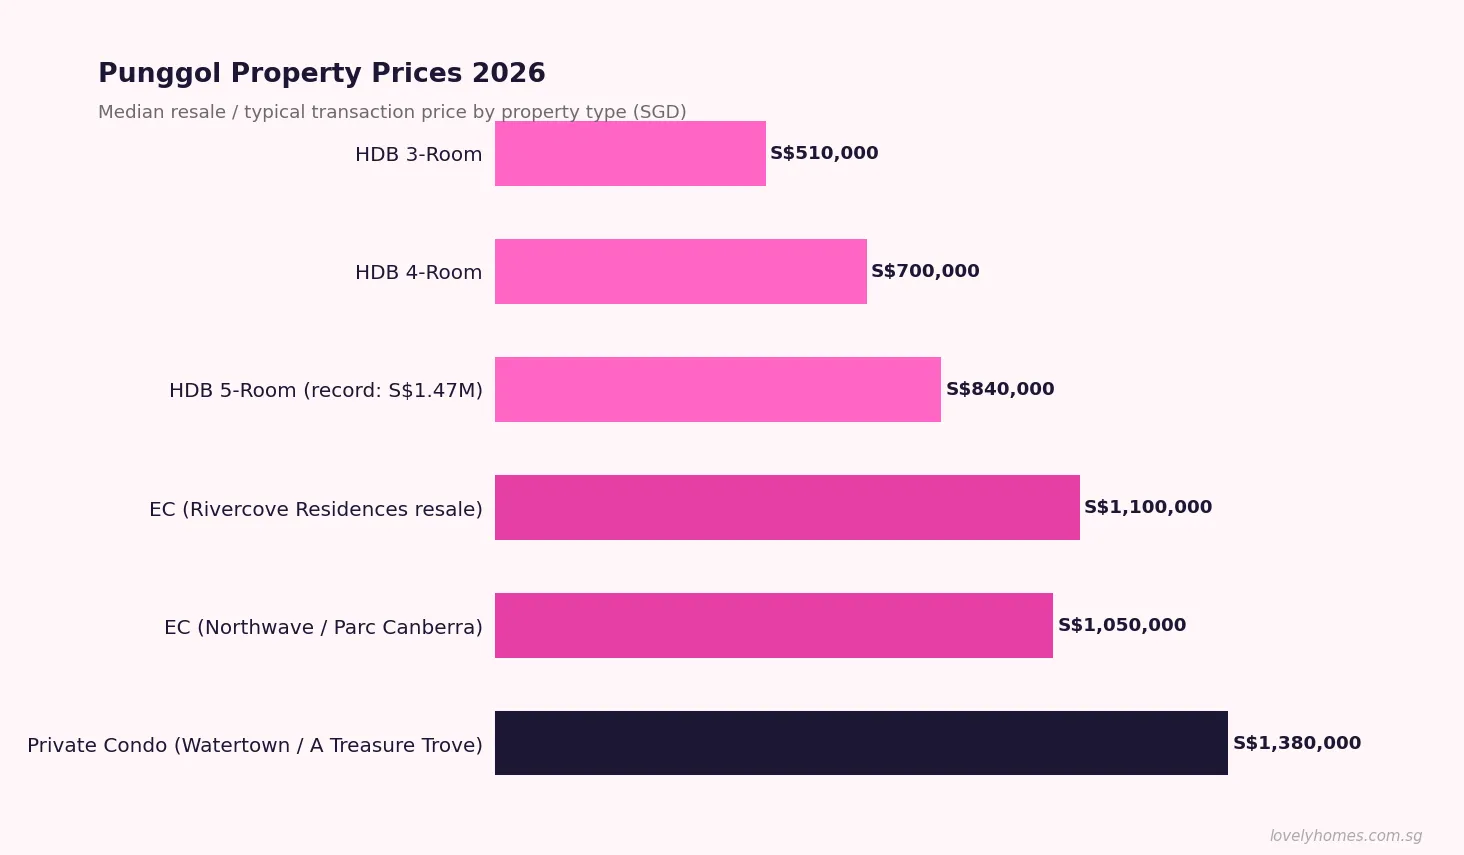
Worked Example: Selling a Punggol 4-Room in the Current Market
The Lims purchased a BTO 4-room flat in Punggol in 2021 for S$380,000. Their MOP completes in mid-2026. They are considering selling to upgrade to a private condominium in Tampines. Based on current Q1 2026 market conditions in Punggol for a comparable unit, resale transacting prices are approximately S$550,000–S$580,000.
At a sale price of S$565,000 — a conservative estimate in the current softer market — the Lims would realise net cash proceeds after CPF OA refund (with accrued interest) and HDB loan repayment of approximately S$95,000–S$130,000 depending on their CPF usage and outstanding loan balance. This is a workable but not ample downpayment for a Tampines private condominium at S$1.2M–S$1.4M. They would need to factor in ABSD of 20% on the private condo if they buy before completing the HDB sale — a S$240,000–S$280,000 additional cost that would consume most or all of their available cash. The most prudent approach is to complete the HDB sale first, use the proceeds toward the condo downpayment, and then buy the private property as a first-time owner (0% ABSD).
What Might Come Next: HDB Resale Market Outlook for 2026–2027
The Q1 2026 dip is most likely the beginning of a gentle plateauing phase rather than a significant correction. The structural support for HDB resale prices remains robust: strong employment, sustained household formation, limited BTO supply in mature estates, and the continuing aspirational value of central-belt HDB flats. However, the MOP wave through 2026 and 2027 will keep resale supply elevated in growth towns, and the Plus/Prime classification’s subsidy-clawback rules are beginning to affect buyer eligibility calculations for units built post-August 2023.
URA’s Q1 2026 caution about “uncertain macroeconomic outlook” is a live risk variable — if global trade conditions deteriorate and employment sentiment weakens, discretionary HDB upgrade transactions are the first to soften. Conversely, if the June 2026 BTO ballot demand data shows continued oversubscription (particularly for the Bishan and Bukit Merah Prime sites), it would reinforce the view that underlying demand for well-located public housing remains structurally strong.
Related Articles
- HDB Record Resale Prices Singapore 2026: S$1.728M Henderson Road Flat and the March Towards S$2 Million
- ABSD Singapore 2026: Complete Guide to Additional Buyer’s Stamp Duty
- HDB BTO Application Process Singapore 2026: Step-by-Step Guide from Eligibility to Keys
- June 2026 BTO Launch Preview: 6,900 Flats Across 7 Projects in 5 Towns
- CPF Housing Grant for Resale Singapore 2026: Complete Guide to EHG, PHG and Step-Up Grant
Frequently Asked Questions
Is the HDB resale market going to crash in 2026?
A 0.1% quarterly dip does not constitute a crash, and the structural conditions for a significant correction are not currently present. Singapore’s economy remains near full employment, household balance sheets are sound, and HDB resale prices are underpinned by genuine owner-occupier demand. The current softening reflects supply normalisation (MOP wave) and buyer prudence in an elevated-interest-rate environment, not a collapse in demand. A 5–10% correction over the next 12–18 months is plausible in the heartland segment if the MOP supply wave continues and macro conditions worsen, but this remains speculative.
Will the Government remove HDB cooling measures given the price decline?
Unlikely. The Government has historically been reluctant to loosen cooling measures on a 0.1% quarterly data point, preferring to see sustained trend evidence before adjusting policy. The current measures — wait-out periods, ABSD on second properties, LTV caps, TDSR/MSR constraints — are unlikely to be eased in 2026 absent a more significant downturn. It is worth noting that the April 2023 ABSD increase was applied when private prices were accelerating; a moderation in HDB prices would not typically trigger an ABSD reversal as the two markets are governed by separate policy rationales.
Why are million-dollar HDB transactions still rising if the market is cooling?
Million-dollar HDB transactions are driven by a specific micro-market: large units in premium central locations with long remaining leases, high floors, or exceptional views. This segment is structurally supply-constrained — fewer than 1% of HDB units meet these criteria — and demand from affluent Singaporean families who want to remain in public housing for cultural or financial reasons is sustained. The broader “average” market (heartland 4-room flats) is what the RPI captures, and this is where the cooling is most apparent. The two trends are not contradictory — they reflect the increasing stratification of Singapore’s public housing market.
How does the HDB RPI decline affect the CPF accrued interest I owe on my flat?
CPF accrued interest accumulates regardless of property prices — it is the notional interest (currently 2.5% per annum) that would have been earned had your CPF OA funds not been used for the property. On sale, the accrued interest must be returned to CPF before you can receive cash proceeds. A stagnating or declining property price does not reduce the accrued interest obligation; it simply means the gap between your sale proceeds and the CPF refund amount narrows. In extreme cases where a property value falls below the total CPF used (principal + accrued interest), there is a shortfall that buyers must make up from cash. This is called the CPF refund shortfall, and it is a genuine risk for buyers who purchased at peak prices with high CPF usage.
What towns are most affected by the MOP supply wave in 2026?
The 13,480 flats reaching MOP in 2026 are predominantly from the 2021 BTO launch cohort, which was particularly heavy in Punggol, Sengkang, Tengah (first wave), Tampines, Sembawang, and Woodlands. These OCR and fringe towns will see the highest relative increase in resale listing supply in 2026. Towns with fewer MOP-completers in 2026 — such as Bishan, Toa Payoh, and Queenstown, where BTO supply has been limited — are less exposed to the supply-side pressure and are likely to see more price stability or continued appreciation.
Disclaimer: This article is for general information and editorial analysis only and does not constitute financial, investment, or property advice. HDB market statistics are sourced from HDB’s Public Housing Statistics Q1 2026. Worked examples and projections are illustrative. Actual market conditions, prices, and policy parameters may differ. Consult a licensed property agent (CEA-registered) and a qualified financial adviser for personalised advice before making property decisions. LovelyHomes is not a licensed property agent and does not represent any developer, agency, or financial institution.
Click anywhere or press Esc to close