Singapore Property Sentiment Q1 2026: NUS RESI Holds at 5.1 as Future Outlook Improves
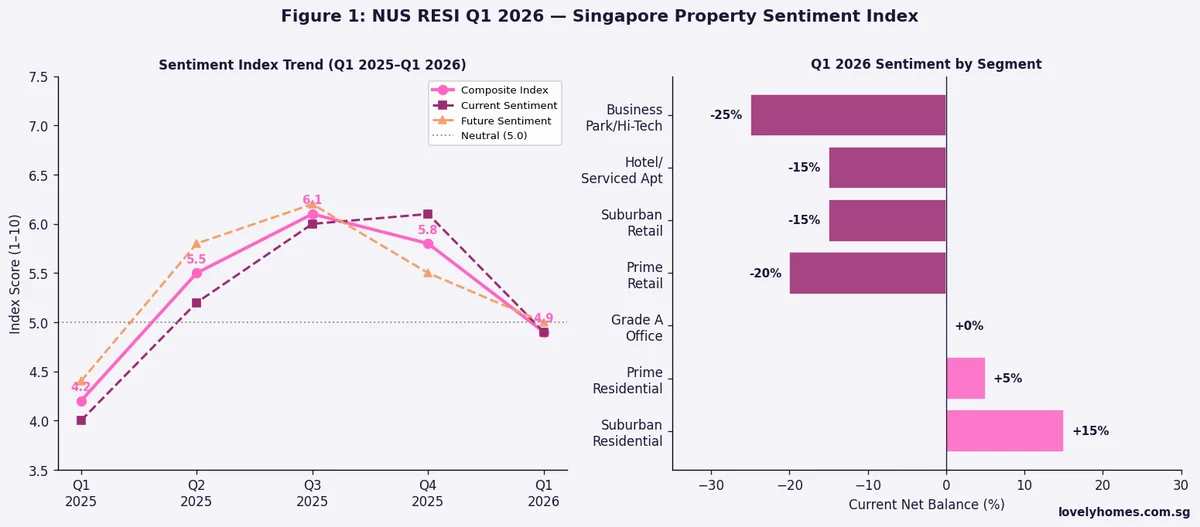
- The NUS Real Estate Sentiment Index (RESI) Composite Score for Q1 2026 came in at 5.1 — above the neutral threshold of 5.0 and marginally above Q4 2025’s reading of 5.0, indicating cautiously positive overall sentiment.
- The Current Sentiment Sub-Index edged down to 4.9 (from 5.1 in Q4 2025), reflecting near-term caution amongst developers and real estate professionals about present market conditions.
- The Future Sentiment Sub-Index rose to 5.3 (from 4.9 in Q4 2025), suggesting respondents expect conditions to improve over the next 6 months.
- Residential sector sentiment was the strongest — net balance of +32%. Office sentiment was positive at +18%. Retail was flat (+2%). Industrial dipped into negative territory at -8%.
- Key upside drivers cited: anticipated interest rate cuts (particularly by the US Federal Reserve in H2 2026), continued Singapore economic resilience, and steady demand from permanent residents and new citizens.
- Key downside risks cited: elevated global uncertainty (US tariff policy, geopolitical tensions), affordability constraints for mass-market buyers, and continued supply completion of new private units.
NUS RESI Q1 2026: Singapore Property Sentiment Holds Cautiously Positive
The National University of Singapore’s Real Estate Sentiment Index (NUS RESI) is published quarterly by the Institute of Real Estate and Urban Studies (IREUS). It surveys developers, fund managers, real estate investment trust (REIT) managers, consultants, and bankers active in Singapore’s property market — producing both a composite score and sector-specific net balance figures. A composite score above 5.0 signals net positive sentiment; below 5.0 signals net negative. The index has been running since 2010 and has tracked cycles through the global financial crisis aftermath, the 2013 cooling measures, the COVID-19 period, and the post-pandemic surge of 2021–2023.
For Q1 2026, published on 23 June 2026, the composite reading of 5.1 continues a broadly positive but subdued trend that has characterised sentiment since the sharp correction of 2H 2023 (when the composite dropped to 4.6 following the April 2023 ABSD hike to 60% for foreigners). The gradual recovery to above 5.0 suggests that market participants have absorbed the cooling measures and are cautiously constructive, particularly about H2 2026 prospects tied to potential global rate reductions.
Current Sentiment Softens; Future Outlook Improves
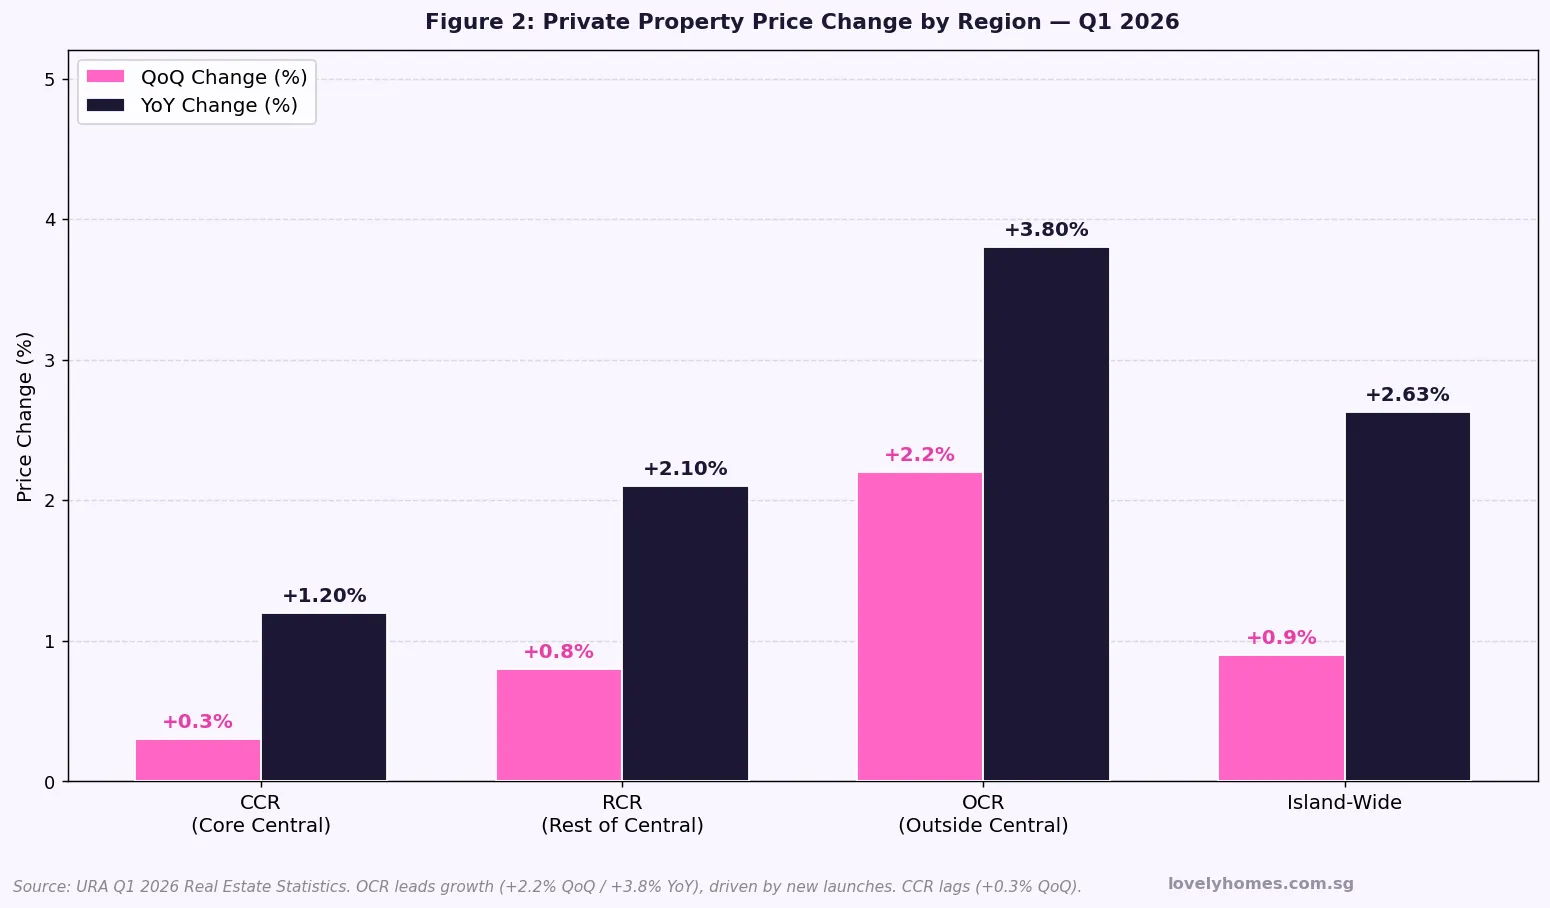
The most notable development in Q1 2026’s RESI is the divergence between the Current and Future sub-indices. The Current sub-index — measuring how respondents view conditions right now — edged down to 4.9, dipping fractionally below the neutral mark. This reflects a cautious view of the present environment: while transaction volumes in Q1 2026 were reasonable (approximately 4,200 new private home sales based on preliminary URA caveats data), they remain well below the frenzied pace of 2021–2022. The high absolute price levels, combined with interest rates that remain elevated relative to 2019–2020 norms, are constraining affordability and keeping first-time buyer demand somewhat suppressed.
The Future sub-index, however, rose to 5.3 — its highest reading since Q1 2024. This forward optimism is driven by two main factors. First, Singapore’s macro environment remains robust: the Ministry of Trade and Industry (MTI) forecast for 2026 GDP growth is 1–3%, employment remains near-full, and wage growth continues. Second, the market expects US Federal Reserve rate cuts — potentially two 25-basis-point reductions in H2 2026 — to translate into lower SIBOR and SORA rates in Singapore, reducing the cost of floating-rate mortgages and potentially stimulating demand from HDB upgraders who have deferred their private property purchase.
Residential Sector: Net Balance +32%, the Strongest Across All Sectors
Among the four property sectors tracked, residential was clearly the standout in Q1 2026 with a net balance of +32% — meaning 32% more respondents viewed residential prospects positively than negatively. This sustained positive reading reflects several structural factors:
Supply pipeline is manageable. Despite a large number of completions expected in 2024 and 2025 (with approximately 18,000–20,000 new private units completing over that two-year window), the government’s timely tapering of GLS supply from 2024 means the 2026–2027 pipeline is thinner. Fewer new launches create less price competition for existing stock.
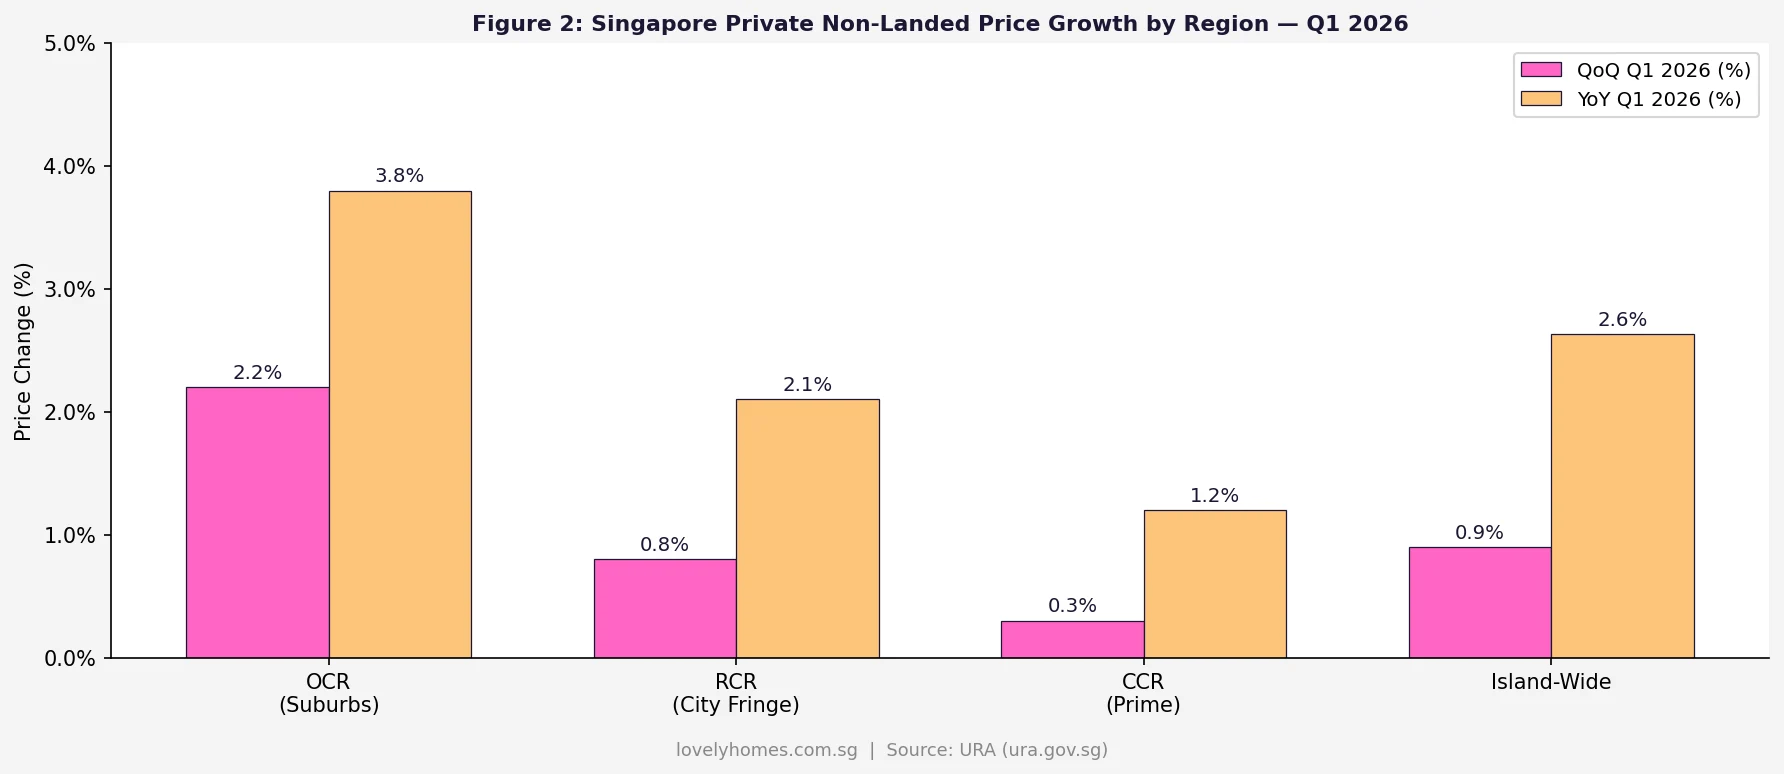
Demand from permanent residents and new citizens. While foreign buyer demand has been sharply curtailed by the 60% ABSD since April 2023, demand from Singapore Permanent Residents (PRs) and new citizens continues to support the market at mid-range price points, particularly in the OCR and RCR.
HDB upgrader cohort remains active. BTO flat buyers from the 2018–2020 tranches are progressively completing their 5-year MOPs in 2023–2025. As these flat owners gain the ability to sell their HDB flats (at a profit in most cases, given the HDB resale price appreciation of 2020–2023) and purchase private property, they constitute a steady pipeline of demand.
Commercial and Industrial Sectors: More Cautious Readings
Office sentiment was positive at +18%, supported by Grade A CBD office take-up from technology, financial services, and private equity firms — though tempered by awareness that flexible working arrangements continue to suppress net absorption relative to pre-COVID peak levels. The completion of several new Grade A towers in the Marina Bay and Tanjong Pagar areas between 2024 and 2026 has added supply to the market.
Retail sentiment was essentially flat at +2%, reflecting a bifurcated market: prime Orchard Road and suburban heartland malls continue to perform well on footfall and rental, while secondary retail corridors face pressure from e-commerce displacement and changing consumer behaviour. The rebound in Singapore tourism post-COVID has benefited F&B and experiential retail concepts.
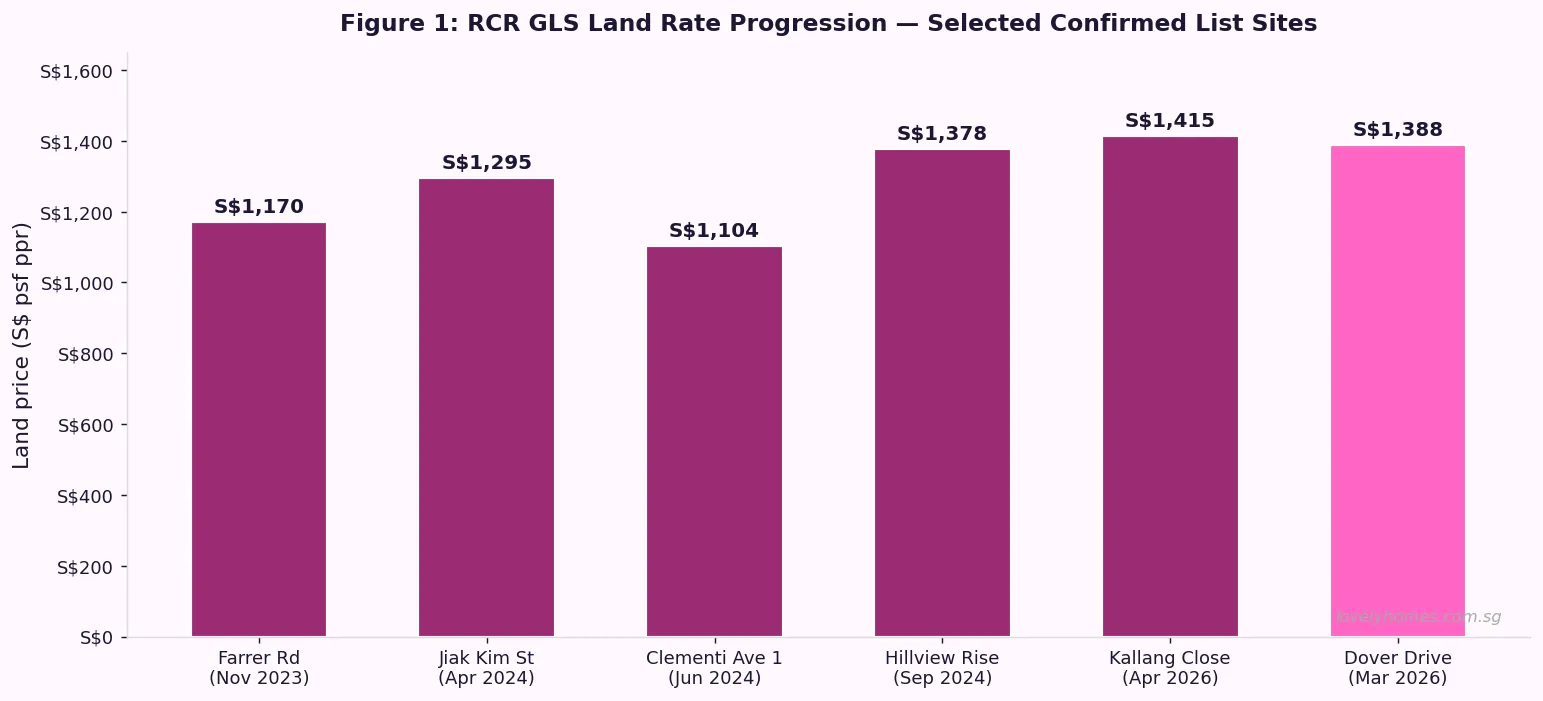
Industrial sector sentiment slipped to -8%, driven primarily by concerns about the global manufacturing outlook (particularly electronics and semiconductor supply chains), rising industrial land prices (following strong JTC tender results in 2024–2025), and a cooling in the data centre development boom as both energy constraints and changing tech sector capital allocation patterns dampen new data centre take-up signals.
NUS RESI Q1 2026: Key Readings
| Metric | Q1 2026 | Q4 2025 | Signal |
|---|---|---|---|
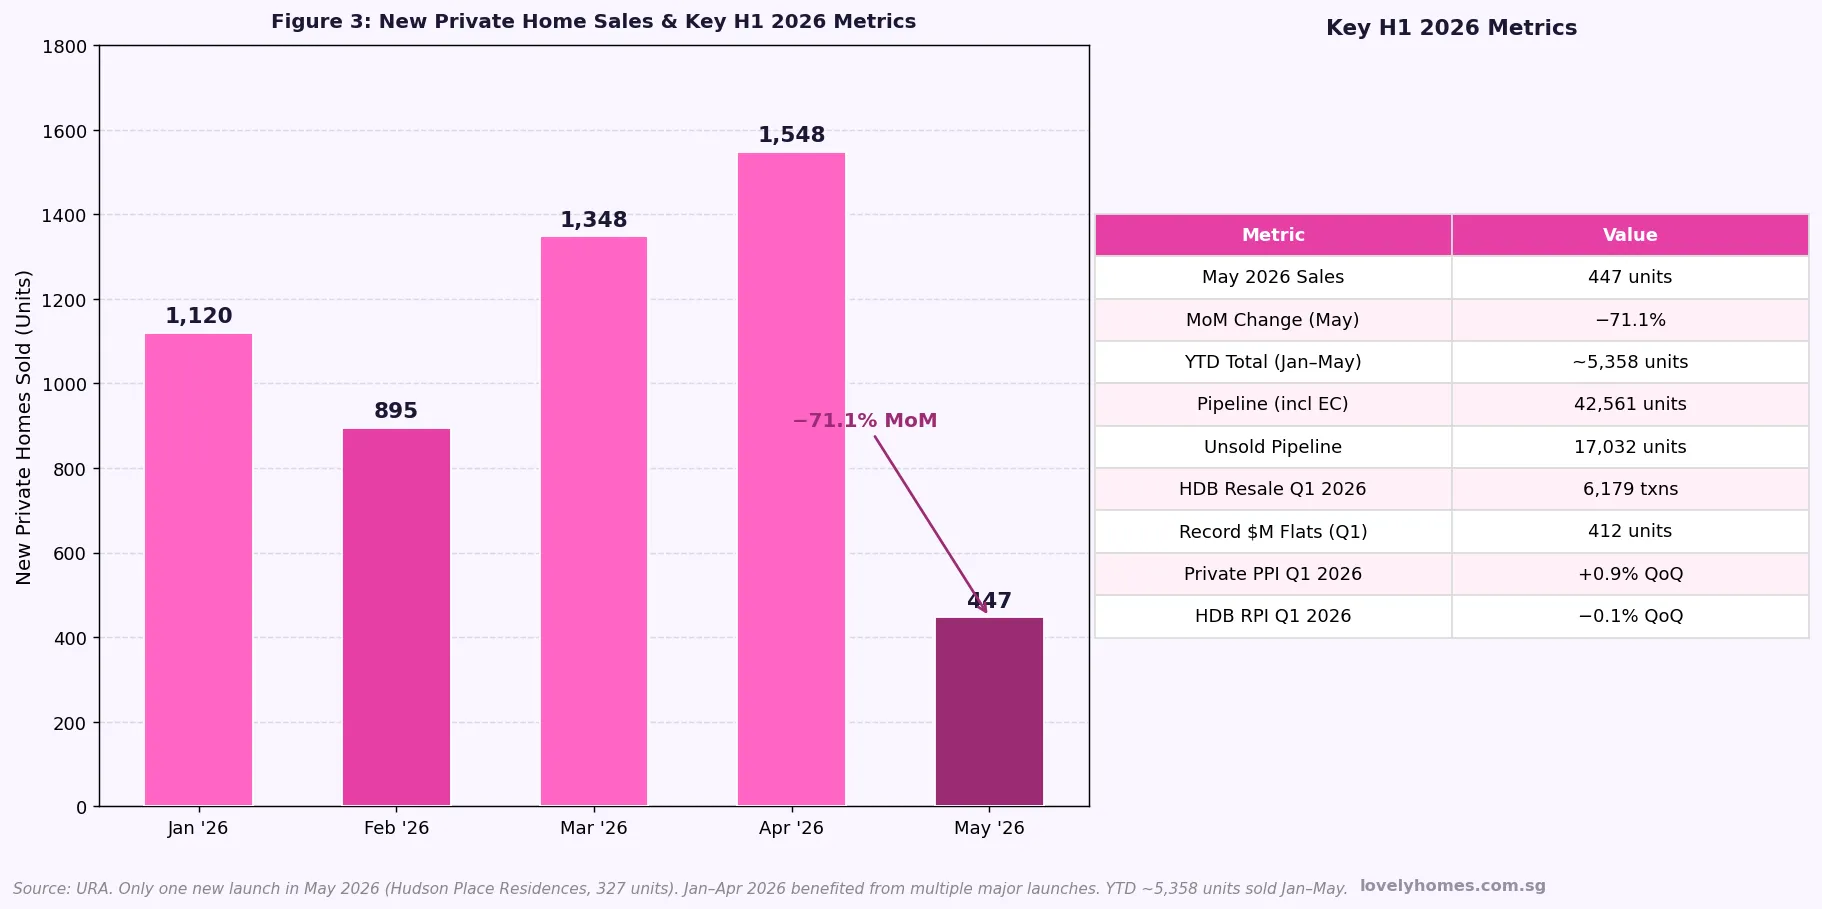
| Composite Score | 5.1 | 5.0 | ▲ Marginally positive |
| Current Sentiment Sub-Index | 4.9 | 5.1 | ▼ Slight softening |
| Future Sentiment Sub-Index | 5.3 | 4.9 | ▲ Improved outlook |
| Residential net balance | +32% | +28% | ▲ Strongest sector |
| Office net balance | +18% | +15% | ▲ Steady positive |
| Retail net balance | +2% | +5% | ▼ Essentially flat |
| Industrial net balance | -8% | -3% | ▼ Turned negative |
What the Q1 2026 RESI Reading Means for Buyers and Sellers
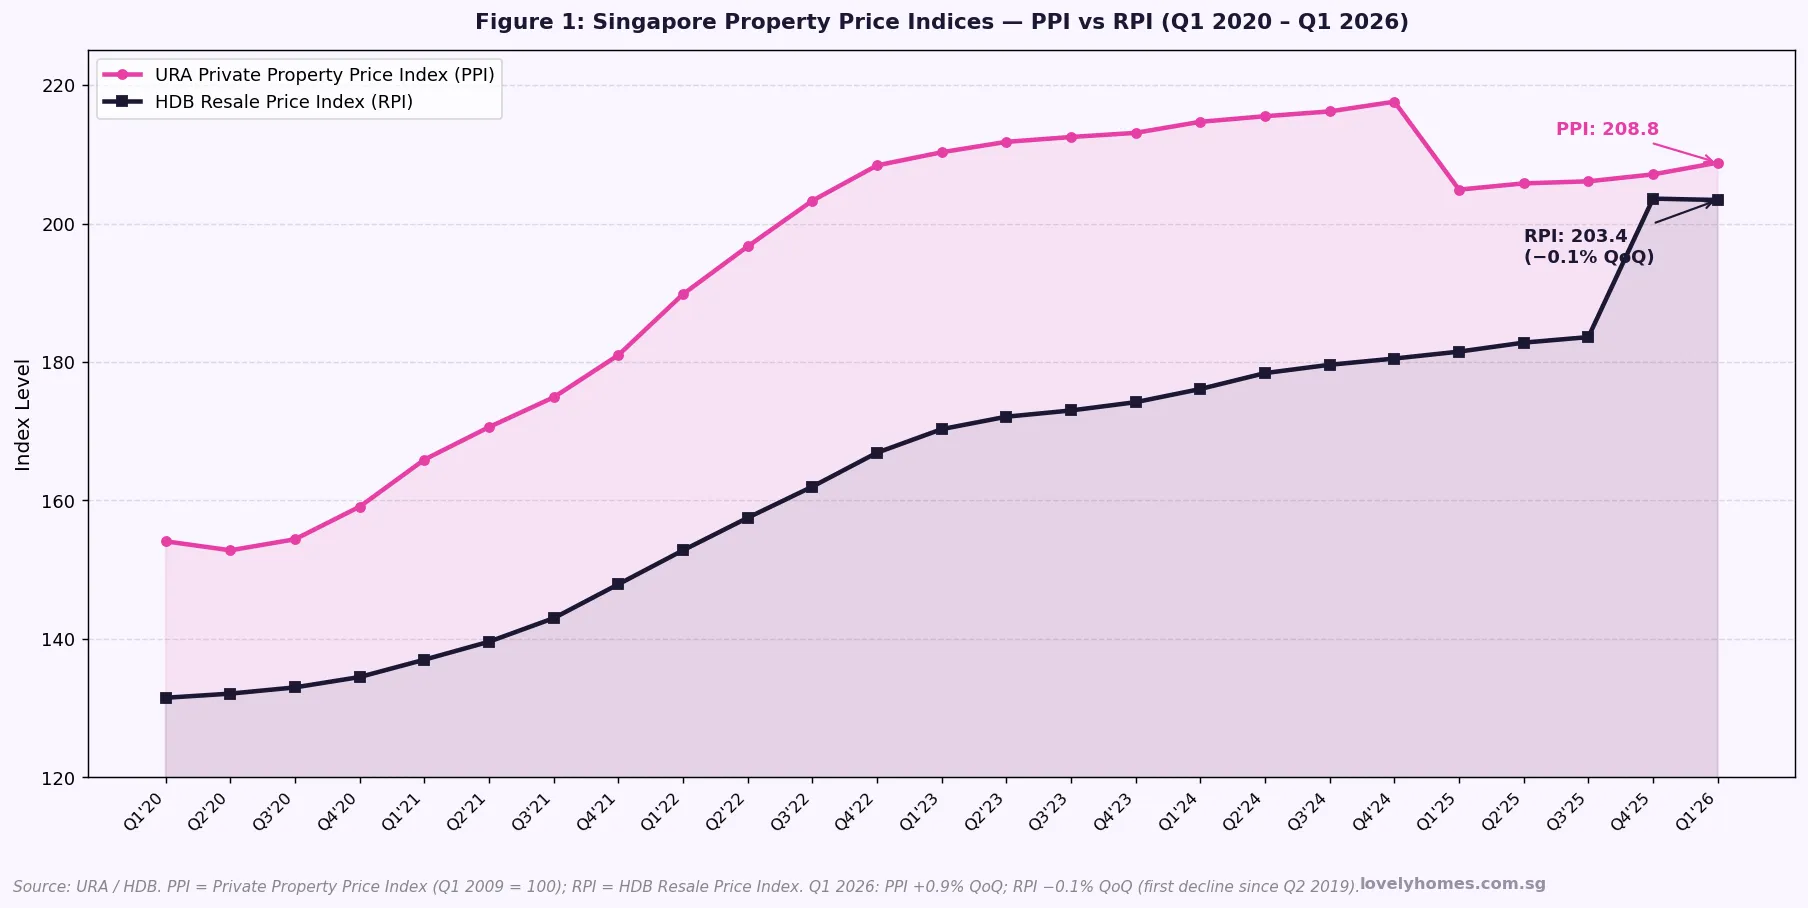
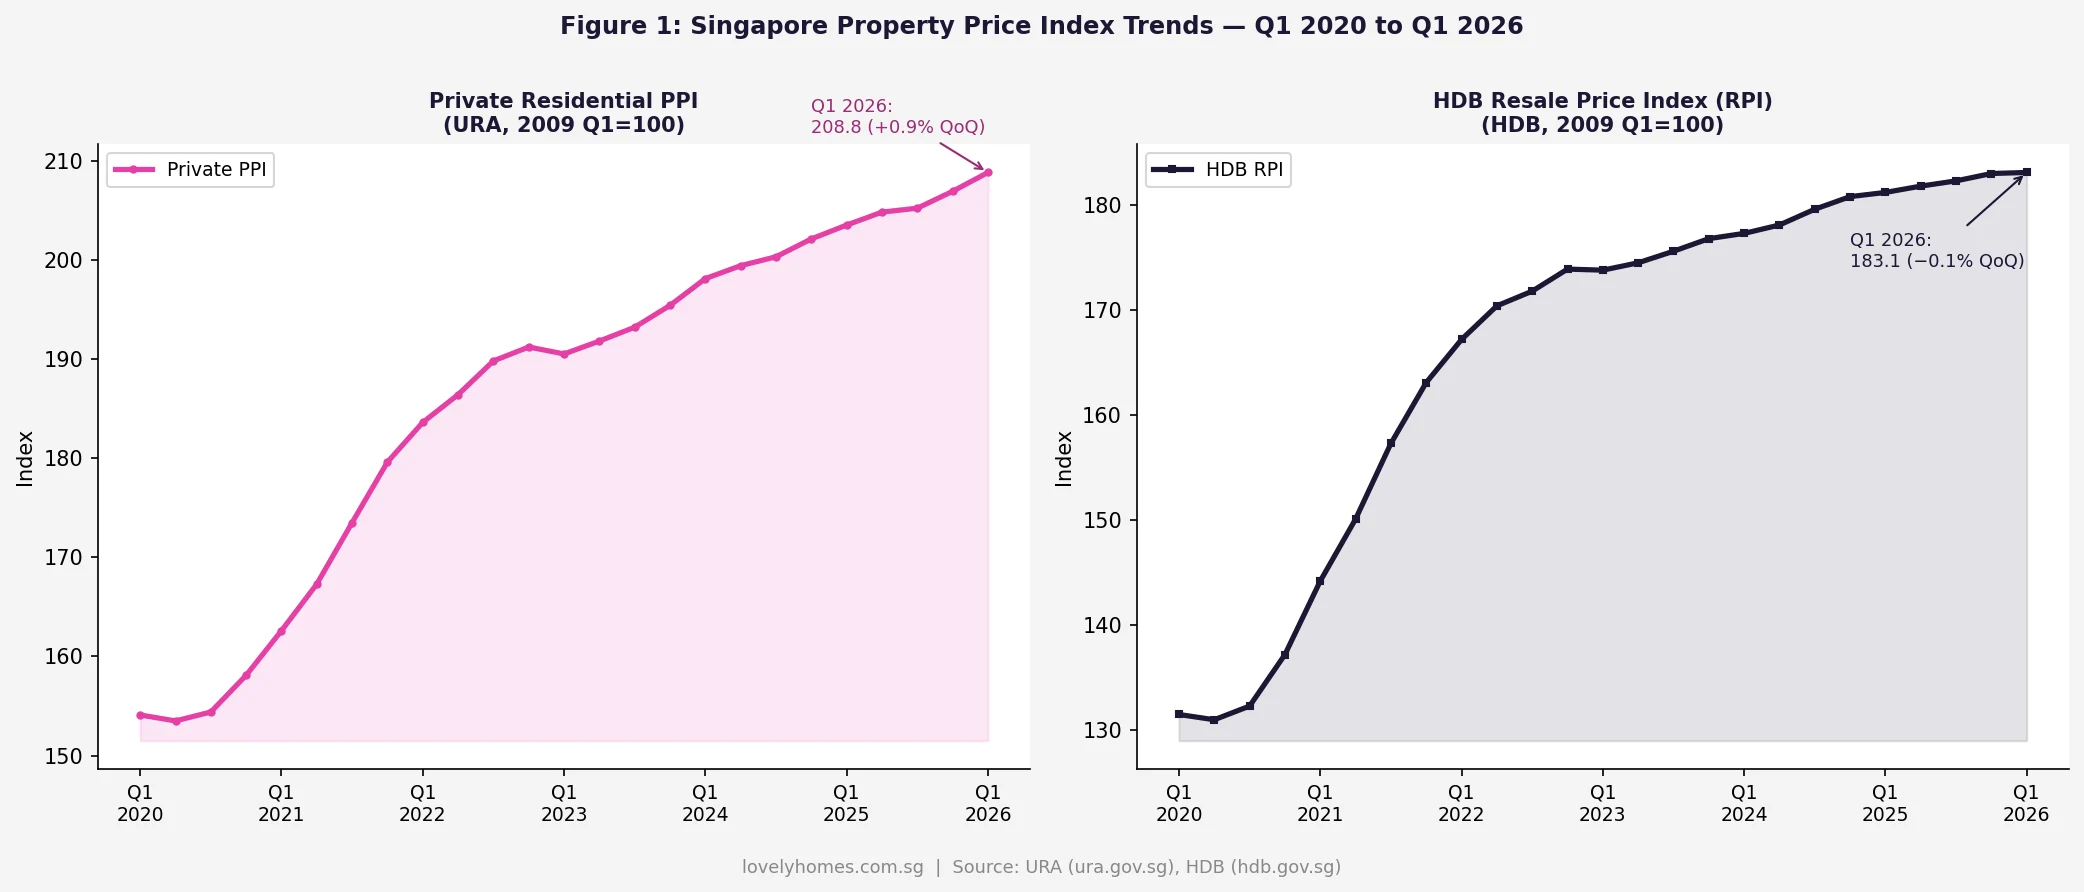
For private property buyers: The positive Future sub-index suggests that property professionals expect price conditions to improve — i.e., values could rise — over the next 6 months. Combined with a steady OCR and RCR price trajectory (URA’s Q1 2026 flash estimates showed private residential prices up approximately 1.1% QoQ overall), buyers who have been waiting on the sidelines should note that the consensus expectation is for a gentle upward drift rather than a correction, particularly if interest rates ease in H2 2026 as anticipated.
For sellers: The broadly positive sentiment is constructive. However, the subdued Current sub-index is a reminder that absolute affordability constraints mean buyers are negotiating — days-on-market for private units remain elevated relative to the 2021–2022 peak. Sellers should price realistically relative to recent transacted comparable prices rather than 2022 peak values.
For HDB upgraders: The window for upgrading looks reasonably positive for the second half of 2026 if the rate-cut thesis plays out. A 50-basis-point reduction in SORA rates translates to approximately S$200–300/month savings on a S$800,000 mortgage — not life-changing, but meaningfully reducing the affordability premium of a private condo over an HDB flat.
Frequently Asked Questions
What is the NUS RESI and how is it calculated?
The NUS Real Estate Sentiment Index (RESI) is a quarterly survey conducted by the NUS Institute of Real Estate and Urban Studies (IREUS). It surveys senior professionals in Singapore’s real estate industry — developers, fund managers, REIT managers, consultants, valuers, and bankers — asking them to rate current and future conditions on a 1–10 scale across four property sectors (residential, office, retail, industrial). The Composite Score is an average of the Current and Future sub-indices. A score above 5.0 indicates net positive sentiment; below 5.0 indicates net negative. The index has been published since 2010.
Why did the residential sector outperform commercial in Q1 2026?
Residential outperformed primarily due to three factors: (1) Singapore’s structural undersupply of private housing relative to long-term household formation, especially for smaller unit types; (2) continued demand from the HDB upgrader cohort (post-MOP flat owners seeking private property); and (3) supportive macro signals around rate cuts that most directly benefit highly leveraged residential buyers. Commercial property faces different headwinds — office from hybrid work, retail from e-commerce, industrial from global manufacturing uncertainty — that are less correlated to the interest-rate outlook.
Should I interpret a RESI score of 5.1 as a strong positive signal?
No. A reading of 5.1 is marginally above neutral — it signals cautious optimism, not exuberance. RESI scores in the 5.0–5.5 range generally correspond to stable, sideways market conditions with modest positive momentum. Strong positive readings (6.0+) have historically coincided with periods like 2021–2022. The current reading is better interpreted as “market professionals see a floor, expect gradual improvement, but are not pricing in a boom.” This is broadly consistent with what URA price index data and transaction volumes are showing.
What are the key risks that could push sentiment negative in H2 2026?
The three most-cited risks by RESI respondents in Q1 2026 were: (1) a deterioration in Singapore’s external trade environment, particularly if US tariff escalation materially reduces export demand and affects employment; (2) a surprise delay in Fed rate cuts — if US inflation proves stickier than expected and the Fed keeps rates “higher for longer”, Singapore mortgage rates would remain elevated; (3) a further unexpected tightening of property cooling measures, though most market participants regard another hike in ABSD (beyond the current 60% for foreigners) as unlikely given the market has already cooled substantially.
How does the NUS RESI relate to actual URA price index movements?
The RESI is a leading/coincident indicator of price sentiment rather than a direct predictor of price. Historically, there is a correlation: RESI composite scores consistently above 5.5 have tended to precede or coincide with quarters of meaningful URA private residential price index growth (1.5%+ QoQ). Conversely, composite scores below 4.5 have typically coincided with flat or negative URA index quarters. At 5.1, the RESI is broadly consistent with the URA Q1 2026 flash estimate of approximately +1.1% QoQ — steady and positive, but measured.
Related Articles
- Singapore Property Market Outlook 2026: What Buyers and Sellers Need to Know
- Singapore CCR RCR OCR Property Guide 2026: Regions, Prices and Buyer Profiles
- ABSD Singapore 2026: Complete Guide to Additional Buyer’s Stamp Duty
- Singapore Private Property Rental Guide 2026
- Singapore Home Loan Refinancing Guide 2026
Disclaimer: This article is based on publicly available NUS RESI Q1 2026 data released by NUS IREUS on 23 June 2026. Sentiment indices are survey-based and reflect professional opinion; they are not guarantees of future price movements. Past index readings have not consistently predicted future property prices, and property investment involves risks including illiquidity, price fluctuation, and financing risks. This article does not constitute investment advice. Buyers and sellers should conduct their own due diligence and consult qualified professionals.