Holland Plain GLS Tender Closes 7 May 2026: ~280 Units in Prime District 10

Holland Plain GLS Tender Closes 7 May 2026: ~280 Units in Prime District 10

The tender for the second Holland Plain Government Land Sales (GLS) parcel closes at noon on 7 May 2026, four days from the time of writing. The 15,716.9 square-metre site, sitting on Parcel A of the Holland Plain area within prime District 10, is expected to yield around 280 private residential units at completion. Industry analysts are pencilling in three to five bidders and a top land bid in the S$1,400 to S$1,500 per square foot per plot ratio band — broadly tracking the precedent set by the adjacent Holland Link parcel awarded in late 2024.

This is the first Confirmed List parcel to be released under the 1H 2026 GLS Programme to actually go to closing in 2026. URA also opened a separate Reserve List application for the Morrison Lane site in the same window, signalling a coordinated push to refresh the central-area land bank ahead of the 2027–2028 launch cycle.

Quick Answer — Holland Plain GLS at a glance

  • Site: Holland Plain (Parcel A), prime District 10.
  • Tender opens: 25 February 2026 · Closes: 7 May 2026 (12:00).
  • Site area: 15,716.9 sqm. Maximum GFA: 28,291 sqm. Plot ratio: 1.8.
  • Estimated unit yield: ~280 private residential units.
  • Tenure: 99-year leasehold from award.
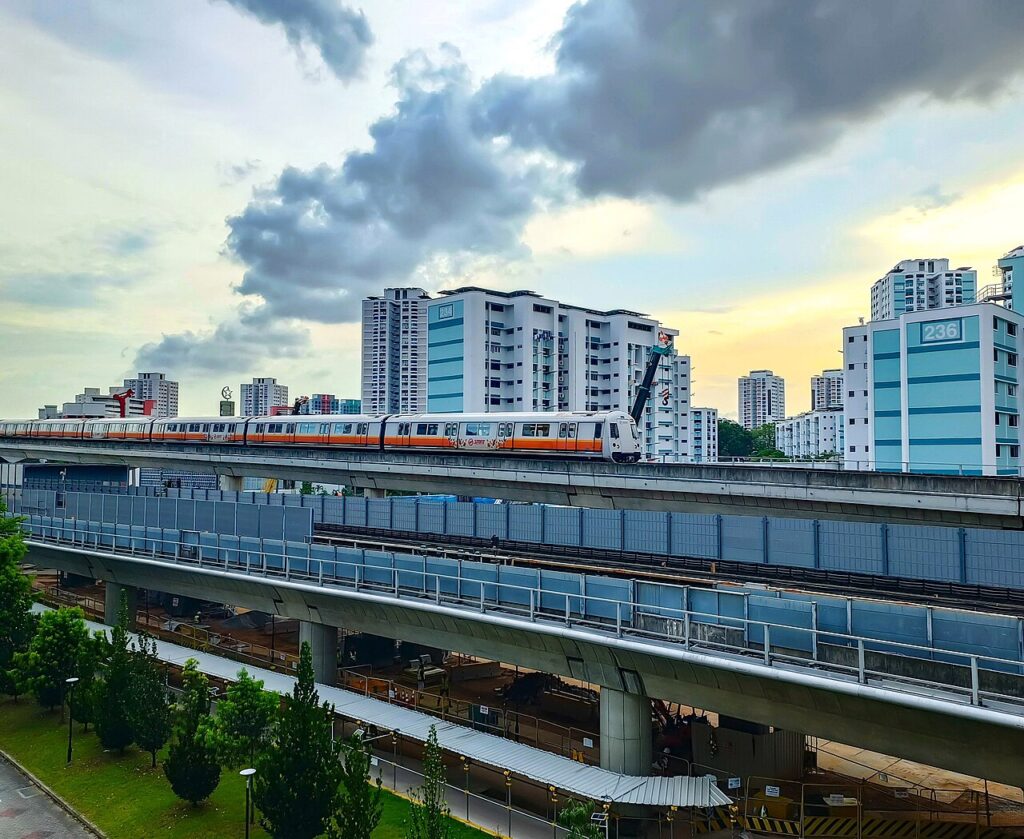
  • Connectivity: King Albert Park MRT (Downtown Line) anchors the area today; future Cross Island Line interchange is the structural upgrade.
  • Analyst land-bid band: S$1,400–1,500 per sq ft per plot ratio (psf ppr).
  • Implied launch range: S$2,800–3,100 psf at sale, depending on bid level and 2027–2028 market conditions.

The Site

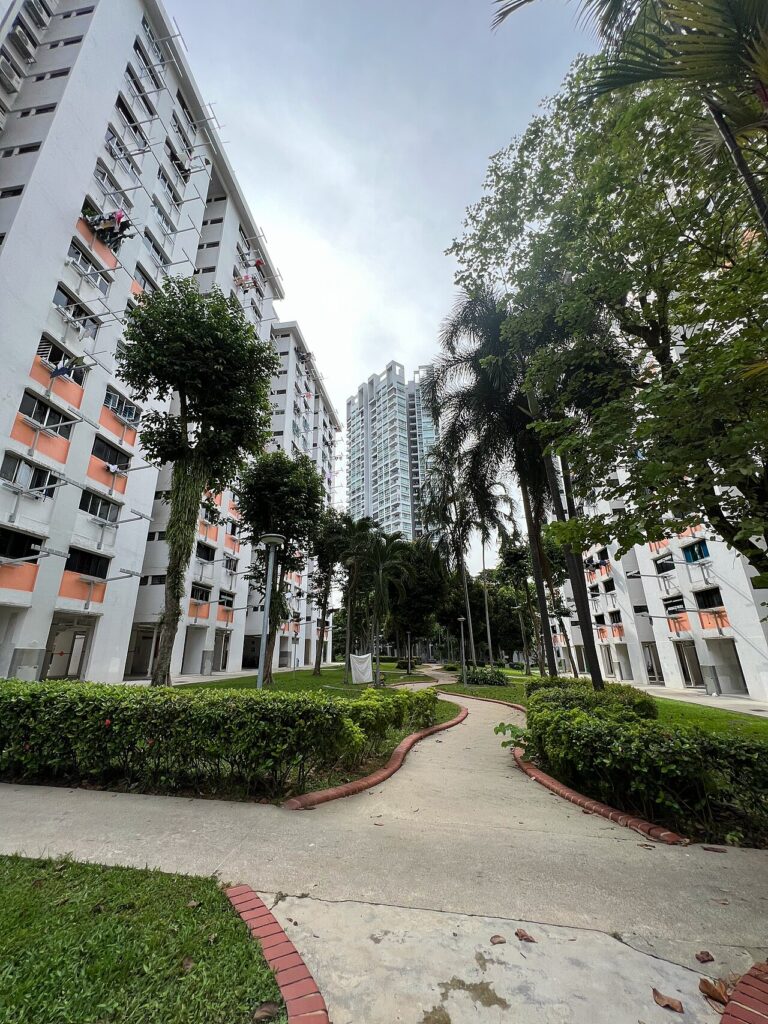
Holland Plain Parcel A occupies a Holland Village-adjacent residential plot in prime District 10. The land is bounded by mature low-rise residential to the south and west, with King Albert Park MRT station on the Downtown Line approximately a 600-metre walk away. The plot ratio of 1.8 yields a maximum gross floor area of 28,291 square metres, supporting around 280 private homes — a relatively modest density for the location, consistent with the area’s low-rise character.

The plot is the second on Holland Plain to be released, following the Holland Link parcel awarded in December 2024 to a developer consortium at S$1,432 per square foot per plot ratio against five competing bids. Holland Link is now under construction; together the two parcels will add roughly 600 new private homes to the Holland Plain micro-precinct over the 2027–2029 horizon.

Timeline and Comparable Bids

Holland Plain GLS Parcel A tender timeline February 2026 to award 2027 with land rate comparables Holland Link Pinetree Hill Lentor Modern
Figure 1 — Holland Plain tender timeline and recent comparable District 10 / city-fringe land bids.

The relevant comparables are limited. Holland Link in late 2024 set the most recent benchmark at S$1,432 psf ppr; it remains the cleanest direct precedent. Pinetree Hill in 2022 cleared at around S$1,318 psf ppr at a comparable city-fringe location, since launched and now selling steadily. Lentor Modern in 2021 closed at S$1,204 psf ppr in a different sub-market and a different rate environment. Allowing for the move in average land rates and the slight upgrade in connectivity story (Cross Island Line confirmed since the Holland Link tender), an analyst band of S$1,400–1,500 psf ppr is internally consistent.

Summary Table — Tender Specifications

Parameter Detail
URA reference 1H 2026 Confirmed List, Holland Plain Parcel A
Tender opens 25 February 2026
Tender closes 7 May 2026, 12:00
Site area 15,716.9 sqm
Maximum GFA 28,291 sqm (plot ratio 1.8)
Estimated unit yield ~280 units
Tenure 99-year leasehold from award
Expected bidders 3–5
Estimated top bid S$1,400–1,500 psf ppr
Anticipated launch 2027–2028 at S$2,800–3,100 psf

Why This Tender Matters

Three reasons. First, it is a temperature read on developer appetite for prime-district land in a market that has just digested two divergent quarterly prints — a +0.9% URA private-property index and a −0.1% HDB index for Q1 2026 (covered in our URA Q1 2026 final analysis). A bid count below three or a top bid notably under S$1,400 psf ppr would suggest developers see the prime-district premium narrowing; a bid count of five or more at the upper end of the analyst range would re-confirm structural demand.

Second, it is a forward signal on launch pricing. With S$1,400 psf ppr land plus typical construction, financing, and developer margin, the implied launch psf on the resulting condominium falls in the S$2,800–3,100 band. That price point would slot Holland Plain alongside other prime-fringe launches and well above OCR averages, but materially below the recent CCR ultra-prime tier. For pricing context across the market, see our Singapore Property Market Outlook 2026.

Third, it speaks to the Cross Island Line investment thesis. The CRL station planned within the Holland Plain estate is the single largest accessibility upgrade for District 10 since the Downtown Line opened. Developers paying up at this tender are betting partly on that connectivity upgrade, and partly on the durability of school-belt and Holland Village amenity demand. If the bid clears in the upper band, it tells you the institutional money is comfortable with both the timing and the magnitude of the CRL effect.

What to Watch on Tender Day

  • Bid count. Five or more = strong; three to four = consensus expectation; one or two = a meaningful negative surprise that would feed into the broader land-bank pricing narrative.
  • Top bid level. Above S$1,500 psf ppr would indicate aggressive Cross Island Line pricing; below S$1,350 psf ppr would suggest developers are pricing in margin compression.
  • Identity of bidders. JV consortia versus standalone bids; the presence (or absence) of large-format developers usually associated with prime District 10 launches.
  • Morrison Lane Reserve List. Whether anyone triggers the application before the Holland Plain award is a separate signal of land-bank tightness.

How Singapore Compares

Singapore’s GLS programme remains an unusually transparent and disciplined supply mechanism. Hong Kong’s land-sale schedule is more opportunistic; Sydney and Melbourne lack a directly comparable systematic release programme; Tokyo’s premium-district plots are typically transacted privately rather than via competitive public tender. The combination of a published Confirmed List 12 months ahead, fixed tender windows, and full disclosure of all bids on closing day means the Holland Plain print on 7 May 2026 will be a clean, comparable data point.

Frequently Asked Questions

What is Holland Plain Parcel A?

Holland Plain Parcel A is a 15,716.9 square-metre 99-year leasehold residential plot on the URA 1H 2026 GLS Confirmed List, located in prime District 10, Holland Village-adjacent, with a plot ratio of 1.8 and an estimated yield of around 280 private residential units. It is the second parcel released under the Holland Plain GLS sub-programme, following Holland Link in 2024.

When does the tender close?

The tender closes at 12:00 on 7 May 2026. URA will announce the bids received and the top bidder on the same day. The actual award (subject to government acceptance) typically follows within four to eight weeks, after which the developer has 24 to 30 months to launch and 60 months from award to issue Temporary Occupation Permit on the resulting development.

What is the expected launch price for the resulting condominium?

If the tender clears at S$1,400–1,500 per square foot per plot ratio, an indicative launch range is S$2,800–3,100 per square foot at sale, depending on the developer’s margin assumptions and 2027–2028 market conditions. The actual launch price will be set by the awarded developer and may differ from any analyst projection.

How does Cross Island Line affect this site?

The future Cross Island Line interchange — with a planned station within the Holland Plain estate — will materially improve connectivity to Jurong Lake District, the western industrial corridor, and the cross-island east-west route. The station is not operational at the time of tender; developers are pricing the future-state benefit. This is one of the largest accessibility upgrades for District 10 in two decades.

How does this tender compare to Holland Link in 2024?

Holland Link was awarded in December 2024 at S$1,432 psf ppr against five bidders. Holland Plain Parcel A is similar in profile (location, tenure, plot ratio band) but benefits from incremental information — CRL planning maturity, more recent market context. Analysts expect the bid range and bidder count to be roughly comparable, with a marginal upward bias on land rate.

What is the Morrison Lane Reserve List parcel?

Morrison Lane is a separate Reserve List residential parcel made available for application during the same tender window. Reserve List sites are released for tender only when a developer triggers the application by lodging a minimum bid acceptable to the Government; it is a developer-initiated release mechanism rather than a scheduled tender.

Where can I track the tender outcome?

URA publishes Government Land Sales tender outcomes on its official site immediately after the tender closes. Industry research desks at the major real estate firms typically publish their analysis within 24 hours; the leading Singapore property news outlets (EdgeProp, The Business Times, Channel News Asia property desk, The Edge Singapore) will carry headline coverage on the day.

Related Articles

Disclaimer

This article is general news and analysis on the Holland Plain GLS tender as at 3 May 2026 and does not constitute investment, financial, or legal advice. Tender details, dates, plot specifications, and analyst bid ranges are drawn from URA announcements and industry research-desk commentary; figures may be revised by URA up to closing. For purchase, financing, or development-side advice, engage a licensed Singapore conveyancing solicitor and (where relevant) a chartered tax practitioner. Prospective home buyers considering the eventual launch should also refer to the IRAS stamp duty pages, the Monetary Authority of Singapore mortgage rules, and the CPF Board for funding mechanics.

Wing Tai-Metro JV Wins Dunearn Road GLS at S$533M — S$1,625 psf ppr Sets New D11 Benchmark

Wing Tai-Metro JV Wins Dunearn Road GLS at S$533M — S$1,625 psf ppr Sets New D11 Benchmark

The Dunearn Road Government Land Sales (GLS) tender closed on 28 April 2026 with the Wing Tai Holdings and Metro Holdings joint venture submitting the top bid of S$533 million — equivalent to S$1,625 per square foot per plot ratio (psf ppr). Six developer bids contested the site, signalling sustained appetite for prime District 11 freehold-equivalent precincts despite the wider market’s cautious tone.

The result extends the steady price discovery in Bukit Timah Turf City — a precinct URA has signalled as a long-term residential growth area, anchored by Sixth Avenue MRT, the Bukit Timah Nature Reserve, and the Bukit Timah Plaza retail district. For buyers tracking the next CCR new launch, this tender frames the indicative pricing band for what is likely to launch in late 2027.

Quick Answer — Dunearn Road GLS at a glance

  • Tender closed: 28 April 2026
  • Top bid: S$533 million by Wing Tai Holdings + Metro Holdings JV
  • Land rate: S$1,625 psf ppr
  • Number of bids: 6 — strongest contest in the precinct so far
  • Site size: 19,042 sqm; ~330 residential units + 1,400 sqm commercial
  • Tenure: 99-year leasehold
  • Implied breakeven: ~S$2,650 psf; indicative launch psf above S$3,000
  • Expected launch: late 2027, subject to URA approval

What Happened — A Six-Bid Contest in District 11

URA released the Dunearn Road site on the 1H 2026 GLS Confirmed List in December 2025, with the tender closing on 28 April 2026. The site sits within the Bukit Timah Turf City precinct — a long-tail residential growth area that the Master Plan rezoned from racing-club use to mixed residential several years ago.

Six developer groups bid for the parcel. The Wing Tai Holdings and Metro Holdings joint venture — bidding through Winrich Investment Pte Ltd and Metrobilt Construction Pte Ltd — clinched the site with a S$533 million top bid, equivalent to S$1,625 psf ppr on the maximum allowable gross floor area. The runner-up bid is understood to have come within roughly 6% of the top, indicating a tightly contested tender rather than a one-developer outlier.

Dunearn Road GLS Singapore 2026 — S$533M top bid Wing Tai Metro JV, 6 bidders, 19042 sqm site, 330 residential units
Figure 1: Dunearn Road GLS — the closing fact panel.

How the Land Rate Compares

The S$1,625 psf ppr land rate sits right at the top of the recent Bukit Timah / D10–D11 GLS comparable set, narrowly above the S$1,610 psf ppr that Dunearn Road Parcel A cleared in March 2025. Both Dunearn Road parcels now anchor the precinct’s pricing.

Bukit Timah D10 D11 GLS tender psf comparison 2024-2026 — Holland Drive S$1218, Pine Grove S$1318, Dunearn Parcel A S$1610, Parcel B S$1625
Figure 2: Recent Bukit Timah / D10–D11 GLS tender outcomes — Dunearn Road Parcel B at the top.
Metric Reading What it means
6 bids on a CCR site Strong contest Refutes the “CCR is dead” narrative; ABSD-resilient buyer pool still exists for prime D11
S$1,625 psf ppr Top of band Sets the new floor for D11 precinct land rates; future tenders likely to anchor here
~330 units Mid-sized Manageable absorption profile; not a 1,000-unit mega-launch
Implied breakeven ~S$2,650 psf Premium pricing Launch psf above S$3,000 likely needed for healthy developer margins
99-year tenure Standard No freehold premium baked in — Bala’s Curve applies in the long run

Why District 11 Is Pulling Bids

The Dunearn Road tender outcome cuts against the broader CCR softness narrative in three ways:

  1. Bukit Timah Turf City master plan upside. URA has flagged the precinct as a major long-term residential growth area, with planned road and MRT enhancements funnelling traffic away from the existing Bukit Timah Road bottleneck. Future-precinct optionality — in particular the eventual mixed-use redevelopment of the surrounding Bukit Timah Plaza area — gives the Dunearn Road parcels a longer-tail upside than a typical CCR infill site.
  2. Sixth Avenue MRT proximity. The site sits within walking distance of Sixth Avenue MRT (Downtown Line). The recent re-rating of MRT-adjacent properties post-Cross Island Line announcement has lifted the implicit transit premium for sites in the Bukit Timah corridor.
  3. School catchment. The site falls within the catchment of several top primary schools — the perennial demand engine for District 11 family buyers, where ABSD is largely an irrelevance because the buyers are SC families on first-home purchases.

Indicative Launch Pricing — A Worked Example

Working backwards from the S$1,625 psf ppr land rate, industry figures typically estimate breakeven and indicative launch psf as follows. Worked Example: a developer paying S$1,625 psf for the land typically adds construction (~S$520–600 psf), professional fees and finance costs (~S$120–160 psf), and a margin and contingency layer (~S$280–320 psf), bringing all-in breakeven to roughly S$2,545–2,705 psf. Adding a healthy launch margin pushes indicative launch psf into the S$3,000–3,300 band. That places the new launch in the same general band as recent CCR new launches like 19 Nassim and the upper end of Watten Estate redevelopments.

Cost Component Indicative psf (S$)
Land cost 1,625
Construction 560
Professional fees + finance 140
Margin + contingency 300
Indicative breakeven ~2,625
Launch margin ~400
Indicative launch psf ~3,025

Per-unit prices for typical 3-bedroom (~1,000 sqft) units would therefore range S$3.0–3.3 million at launch. For 2-bedroom units (~700 sqft) a launch range of S$2.1–2.3 million is plausible. The actual pricing will depend on launch-window comparables, prevailing financing rates, and any cooling-measures recalibration in the meantime.

What It Means for Buyers and Investors

For owner-occupiers in the District 11 catchment:

  • Existing comparable resale stock in Bukit Timah Estate (e.g. Trevista, Cluny Park, Eng Neo Avenue) becomes a reference for upgrader value. Resale at S$2,400–2,600 psf for relatively new freehold stock starts looking competitive against an S$3,000+ psf new-launch.
  • The 99-year tenure is a structural disadvantage relative to the freehold stock surrounding it. See our Freehold vs 99-Year Leasehold guide for the holding-period maths.

For investors:

  • The implied breakeven sits well above the rental-yield supportable level. Net yields at S$3,000+ psf launch in District 11 typically come in at 2.0–2.5% — a yield-vs-capital-appreciation trade-off the buyer must accept upfront.
  • For ABSD-resilient buyers (SCs on first home, FTA-exempted nationals), the entry calculus is dominated by capital appreciation expectations. For ABSD-paying buyers (foreigners at 60%, entities at 65%), the entry math is far harder.

What Comes Next

The 1H 2026 GLS programme has several more tenders ahead. The Holland Plain site closes on 7 May 2026 — another D10 / Bukit Timah-adjacent parcel that will set the next price benchmark. Beyond that, the remaining 1H 2026 sites include Bayshore Drive (a major mixed-use parcel closing 15 July 2026) and EC sites at Sembawang Drive and Canberra Drive that will affect the EC pipeline rather than the prime CCR narrative.

For Dunearn Road Parcel B specifically, the next milestones are the developer’s formal site mobilisation, the URA development application, and the pre-launch marketing window — all typically running 12–18 months from tender award. A late-2027 launch window is the practical expectation.

Frequently Asked Questions

When will the Dunearn Road condo launch?

Likely late 2027. Tender awards typically take 12–18 months to translate into a formal launch, depending on URA development-application turnaround, design finalisation, and pre-launch marketing setup. Earlier launches are possible if the developer fast-tracks the design, but the late-2027 to early-2028 window is the realistic baseline.

What is the expected launch psf for Dunearn Road?

Working from the S$1,625 psf ppr land rate, indicative breakeven is S$2,500–2,700 psf and an indicative launch range of S$3,000–3,300 psf is plausible. Final pricing will reflect launch-window comparables, financing rates, and any future cooling-measure recalibration.

Is the Dunearn Road site freehold or leasehold?

99-year leasehold — the standard tenure for Singapore GLS sites. The 99-year clock starts from issuance, typically 1–2 years before TOP. By the time buyers move in around 2030, the remaining lease will likely be 96–97 years.

How does this tender compare with the Tanjong Rhu GLS?

The Tanjong Rhu (River Modern) GLS site cleared at S$709 million in March 2025 — a larger project on a Riverfront RCR site. Dunearn Road Parcel B at S$533 million is a different scale and a different micro-market. Both are signals of sustained developer appetite for well-located GLS sites despite cooling-measure pressure.

What other 1H 2026 GLS tenders should I track?

Holland Plain (closing 7 May 2026) is the next D10-adjacent site. Bayshore Drive (closing 15 July 2026) is the major mixed-use parcel for the new Bayshore precinct. Sembawang Drive and Canberra Drive are EC sites that will affect the 2027–2028 EC pipeline. Each tender result becomes a fresh data point for pricing the surrounding resale and new-launch markets.

Are there alternatives in the same area for buyers who do not want to wait?

Existing freehold or 999-year leasehold stock in Bukit Timah Estate is the immediate resale alternative. Newer 99-year leasehold stock at Watten Estate, Sixth Avenue, and Coronation Road can be compared on a like-for-like psf basis. Pinetree Hill in the Pine Grove precinct remains the recent benchmark for Dunearn-adjacent leasehold new launches.

Related Articles

Disclaimer: This article is for general information only and does not constitute legal, tax, or financial advice. Tender outcomes, launch pricing and indicative breakeven figures are based on publicly disclosed URA tender data and industry-standard estimation conventions. Always verify current GLS data with the URA Land Sales page and consult a licensed property professional or financial adviser before acting on any property purchase.

URA Q1 2026 Private Home Prices Rise 0.9% — Revised Up from +0.3% Flash, OCR Leads at +2.2%

URA Q1 2026 Private Home Prices Rise 0.9% — Revised Up from +0.3% Flash, OCR Leads at +2.2%

Singapore private home prices rose 0.9% in the first quarter of 2026 — almost three times the pace flagged in the URA flash estimate three weeks earlier. The final reading, published by the Urban Redevelopment Authority on 24 April 2026, marks the sixth consecutive quarter of growth in the private residential price index, and it tells a story that diverges sharply from the volume picture: prices firmed, but transactions slumped almost 40% quarter-on-quarter.

Quick Answer — what the URA Q1 2026 release shows

  • Overall private residential PPI: +0.9% q-o-q, sixth consecutive quarter of growth.
  • Sharp upward revision from the +0.3% flash estimate on 1 April.
  • Non-landed properties: +1.3%; landed: -1.8%, reversing the +3.4% prior quarter.
  • OCR led non-landed with +2.2%; RCR +0.8%; CCR +0.6%.
  • Transaction volume crashed: only 4,041 deals recorded by mid-March, -39.7% versus 4Q 2025.
  • Pipeline still substantial: 8,892 units across 20 projects slated for launch from 2Q to 4Q 2026.
URA Q1 2026 private home prices +0.9% — guide cover
URA Q1 2026 final release — private home prices revised up to +0.9%.

Flash to Final — A Substantial Upward Revision

URA flash estimates are released on the first business day of every quarter, before the full transaction sample is in. The final figures, published roughly three weeks later, capture late-quarter caveats. In most quarters the gap between flash and final is small — perhaps 0.1 to 0.3 percentage points. In Q1 2026 the gap was larger than usual: from +0.3% to +0.9%.

URA Q1 2026 flash vs final by region — overall +0.3% revised to +0.9%, OCR +2.2%
Figure 1: Flash vs final — URA Q1 2026 PPI revisions by region.

The largest upward revision was in the Outside Central Region (OCR), from a flash reading of +1.3% to a final +2.2%. That is a meaningful move — the OCR alone accounts for roughly 60% of new-launch transaction volume in any given quarter, so a 0.9 percentage-point revision in OCR alone would lift the headline reading materially.

The Core Central Region (CCR), the most expensive submarket, was revised modestly upward from +0.4% to +0.6%, after a punishing -3.5% in 4Q 2025. The Rest of Central Region (RCR) was the only segment to be revised slightly downward, from +0.9% to +0.8%.

Why Were OCR Numbers Revised So Sharply?

Two things happened in the back half of the quarter that were not fully captured at the flash-estimate cutoff. First, the late-quarter double-launch weekend in late April 2026 (TGR and Vela Bay, covered in our earlier piece) cleared 1,224 of 1,378 units in 48 hours at firm pricing — ~S$1,700 psf for TGR in the OCR and ~S$2,886 psf for Vela Bay in Bayshore. Both sets of transactions dragged up the OCR PPI when finally captured.

Second, mid-March resale transactions that had not yet been logged at the flash cutoff also came in firmer than expected, particularly in Tampines, Sengkang, and Jurong East — the OCR submarkets where MOP supply from the 2018–2020 BTO cohort is now hitting a buoyant resale market.

The Volume Story — A 39.7% Crash

The price firming has to be read against a steep drop in activity. Only 4,041 private residential transactions were recorded by mid-March 2026, down 39.7% versus the 6,699 transactions in 4Q 2025. That is the lowest quarterly transaction count in nearly two years.

URA Q1 2026 prices +0.9% but transactions -39.7% — divergence chart
Figure 2: The defining tension of Q1 2026 — firmer prices on much thinner volume.

The volume drop has two readable causes. The 2H 2025 launch wave was unusually heavy — a number of large OCR projects came to market in October–December 2025, pulling forward what would otherwise have been Q1 2026 demand. Q1 2026 was always going to look soft on volume by comparison.

The second cause is sentiment. Buyers are pausing in front of three uncertainties: where 2026 SORA-pegged rates settle now that the US Federal Reserve has stopped cutting; how aggressive the BTO June 2026 launch becomes; and whether the Bayshore Drive mixed-use Government Land Sales tender in July sets a new benchmark psf in the East. Volume usually returns once these three questions get answered.

Landed -1.8% — Mean-Reverting After a Hot 4Q

The landed segment swung from +3.4% in 4Q 2025 to -1.8% in Q1 2026, a 5.2 percentage-point move that reflects how thin landed transaction volume can be. Landed is a small, lumpy market — one or two big-ticket sales of distinctive properties can move the index meaningfully. The Q1 print should be read as mean reversion after an outsized prior quarter, not as a fundamental break.

Rental Index +0.3% — Stabilising After 2024 Cool-Off

The private residential rental index ticked up 0.3% in Q1 2026 after the multi-quarter cool-off through 2024 and early 2025. Yields on private condos remain in the 3.0–3.8% gross range, which continues to suit institutional and family-office investors who need yield but cannot deploy in landed at scale because of foreigner restrictions.

What Comes Next — The Q2 to Q4 Pipeline

Indicator Q1 2026 reading What it implies for the rest of 2026
Overall PPI +0.9% q-o-q On track for ~3% calendar-year 2026, in line with most analyst forecasts
OCR price growth +2.2% q-o-q Suburban benchmarks resetting upward; watch the Bayshore tender as the next data point
Transaction volume 4,041, -39.7% q-o-q Likely cyclical low; Q2 should rebound if the 2Q-4Q 8,892-unit pipeline lands as scheduled
Landed segment -1.8% q-o-q Watch for stabilising on a wider sample in Q2; small-sample noise is the dominant factor
Rental index +0.3% q-o-q Yields steady; institutional appetite for buy-to-let condos persists

What This Means for Buyers — The Counter-Cyclical Window

For end-user buyers who have been waiting on the sidelines, Q1 2026 is the kind of moment that historically gets revisited as a buying window. Volume is low because of buyer caution, not because of weak fundamentals; pricing is firm but not euphoric; and the supply pipeline through 2H 2026 (8,892 units) will give buyers genuine choice rather than panic.

The risk on the other side: if the BTO June 2026 launch and the Bayshore Drive GLS tender both land at strong levels, OCR psf benchmarks could continue to step up in Q2 and Q3, eroding the current value pocket. Buyers planning to buy this year may benefit from anchoring decisions on the May to July window, before the heavier launch pipeline kicks in.

Frequently Asked Questions

Why was the upward revision from flash to final so large this quarter?

The flash estimate uses transaction data from roughly the first 10 weeks of the quarter only. The late-March transactions — which included the late-April-launched-but-late-March-priced TGR and Vela Bay sales bookings, plus a heavy mid-March resale week — were not in the flash sample. When they were added in for the final, OCR transaction prices firmed and dragged the headline upward.

Does this change the 2026 full-year forecast?

Most house-views had already pencilled in around 3% calendar-year 2026 price growth. Q1 at +0.9% is broadly consistent with that pace — not a beat, not a miss. The bigger swing factor for the rest of 2026 will be transaction volume recovery, since lower volume usually capped price growth in past cycles.

If volume is so weak, why are prices going up at all?

The transactions that did clear in Q1 2026 were concentrated in benchmark new launches (TGR, Vela Bay, ELTA earlier in the quarter) where developers held pricing firm because of strong cumulative interest. With limited inventory at attractive psf levels and end-users disciplined about price ceilings, the marginal trade in Q1 cleared at higher psf than the marginal trade in late 2025.

What does this mean for HDB upgraders?

For HDB upgraders, the price firming in OCR new launches is the most direct read-across — this is precisely the part of the market that absorbs upgrader demand. The flip side, however, is that HDB resale prices dipped 0.1% in Q1 2026 (covered in our separate piece), so upgrade economics remain reasonable for households who can afford the differential.

Does the URA Q1 2026 release affect cooling-measure expectations?

Almost certainly not. +0.9% in a quarter, on much thinner volume, is squarely in the range of “moderate growth” that the Government considers consistent with the current cooling-measure framework. Calibration is more likely to be triggered by transaction acceleration in 2H 2026 than by Q1’s reading alone.

How much new supply is coming?

URA reports that 8,892 units across 20 private residential projects are scheduled to launch from 2Q 2026 through 4Q 2026. That is a substantial pipeline, weighted to the OCR. Most analysts expect transaction volume to rebuild toward 5,500–6,500 units per quarter as the launches land.

Related Articles

Disclaimer

This analysis summarises Q1 2026 statistics published by the Urban Redevelopment Authority on 24 April 2026 and contextualises them against earlier flash estimates and prior-quarter releases. Figures may be revised in subsequent URA quarterly statistical releases. The piece does not constitute investment, tax, or legal advice. For authoritative figures consult URA, HDB, the Monetary Authority of Singapore, the Inland Revenue Authority of Singapore, CPF Board, and SingStat. Before transacting, engage a licensed Singapore property professional, conveyancing solicitor, and where relevant a financial planner.

Bedok 4-Room HDB Resale Hits S$1.17M — Bedok South Horizon Sets Record at MOP

Bedok 4-Room HDB Resale Hits S$1.17M — Bedok South Horizon Sets Record at MOP

Bedok South Horizon 4-room resale S$1.17 million record April 2026 hero
Bedok South Horizon — the November 2016 BTO project that just reset the OCR resale ceiling.

Quick Answer

  • A 4-room flat at Block 154B Bedok South Road (Bedok South Horizon) sold for S$1.17 million in April 2026 — a new resale record for any 4-room HDB flat in Bedok.
  • The unit measures 1,001 sqft, translating to S$1,168 psf, with around 94 years of lease left.
  • It was the second record-breaker in the same block within a few weeks: an earlier transaction at S$1.12 million had already taken the previous best, S$995,000 at 430A Bedok North Road, off the top.
  • Bedok South Horizon was launched in the November 2016 BTO exercise and only reached its 5-year Minimum Occupation Period in early 2026, so this is the first wave of post-MOP supply hitting the market.
  • The transaction comes despite the Q1 2026 HDB Resale Price Index falling 0.1% — the first quarterly decline in almost seven years — confirming that top-quartile flats in OCR estates can still set records even in a softening index.
  • Several other November 2016 BTO estates are due to MOP across 2026 (Punggol Northshore, Tampines GreenGem, Senja Heights, Bidadari Alkaff Vista). Their first sales will be the comparables to watch.

What Happened

Bedok South Horizon, a 5-room and 4-room BTO project located along Bedok South Road, has just produced two record-setting resale transactions within the space of a month. The first, at S$1.12 million, was reported earlier in April 2026 and was already the highest 4-room price ever paid in Bedok. A second flat in the same block, Block 154B, then sold for S$1.17 million — beating the first record by S$50,000 within weeks and setting a new ceiling at S$1,168 per square foot.

The flat in question is a standard 1,001 sqft 4-room layout. With its November 2016 launch date, the Minimum Occupation Period only lifted in early 2026, which means this is among the very first batches of resale supply emerging from this BTO cohort. Bedok South Horizon flats still carry roughly 94 years of lease, which is structurally important for buyer financing — both bank loans and HDB Concessionary Loans get the cleanest treatment when the lease can comfortably cover the youngest occupier’s age plus 95.

Bedok South Horizon resale record progression
Figure 1: Two record sales in one month — Bedok South Horizon resets the 4-room benchmark.

Why the Record Matters

The headline number is dramatic, but the context matters more than the price. Three things make this transaction noteworthy.

It happened against a falling index. The official HDB Resale Price Index slipped 0.1% in Q1 2026, the first quarterly decline since Q2 2019. That index is a town-and-flat-type-mix-adjusted average. A single record-setting unit does not move it. But the gap between the index and individual standout transactions has widened in 2026 — a pattern that often surfaces during a market plateau, when buyers concentrate on the very best stock.

The neighbourhood is non-mature OCR. Bedok is mature in colloquial terms but classified as part of the East Region in HDB’s official segmentation. The estate has a long-established food culture, multiple Circle Line and East-West Line stations, and direct expressway access. Bedok South Horizon’s specific cluster also benefits from being a short walk from Tanah Merah MRT and the East Coast Park linear route — amenities that lift price more than psf-level supply curves predict.

The MOP wave is just beginning. The November 2016 BTO exercise was substantial. Bedok South Horizon’s MOP in early 2026 is the first significant supply event from that cohort. Senja Heights (Bukit Panjang), Bidadari Alkaff Vista (Toa Payoh), Punggol Northshore and Tampines GreenGem are scheduled to MOP across the rest of 2026. Each of those will produce its own first-MOP comparables, and brokers will be benchmarking back to Bedok South Horizon for the rest of the year.

The Numbers in Context

Metric Value Context
Sale price S$1,170,000 New 4-room Bedok record
Floor area 1,001 sqft Standard 4-room BTO layout
Effective psf S$1,168 Sets a new OCR 4-room MOP-fresh psf benchmark
Lease remaining ~94 years Comfortable for any buyer profile
Original BTO launch November 2016 5-year MOP lifted early 2026
Block 154B Bedok South Road Same block produced two consecutive records in April 2026
Q1 2026 HDB Resale Index -0.1% QoQ First quarterly decline in nearly 7 years (URA + HDB)

What This Tells Us About the OCR HDB Market

The signal here is not that the market is broadly heating up. The Q1 2026 RPI says the opposite — town-mix-adjusted prices have just turned negative for the first time in seven years. The signal is that quality differentiation is widening. In a softening index, the top-quartile of flats — fresh-MOP, low-lease-decay, near MRT, in established food and retail catchments — keep getting bid. The bottom quartile is where the index decline is being felt: older flats, longer-distance MRT walks, smaller resale liquidity.

For buyers, this means the headline decline in the RPI will not be felt evenly. A first-time upgrader looking at a fresh MOP unit in Bedok, Tampines or Punggol should not expect to negotiate down on the assumption that “the market is falling”. A buyer hunting in older non-mature pockets with longer commutes may have more leverage than they did in 2024.

For sellers in the November 2016 BTO cohort, the timing of MOP versus first listing is a real lever. Pricing the unit at “first-mover premium” in the first three months after MOP — when there are very few comparables — has produced strong outcomes on the OCR fringe in 2024 and 2025. Bedok South Horizon’s two records reinforce that pattern.

Comparable November 2016 BTO projects reaching MOP 2026
Figure 2: Other November 2016 BTO estates due to MOP across the rest of 2026.

What’s Next on the MOP Calendar

Several projects from the same November 2016 BTO cohort are scheduled to MOP across 2026, and brokers will be using Bedok South Horizon as the comparable. Senja Heights in Bukit Panjang is the next in line. Bidadari Alkaff Vista in Toa Payoh, on the much-watched Bidadari estate, is a more direct urban comparison and likely to clear higher psf because of mature-estate proximity. Punggol Northshore waterfront flats and Tampines GreenGem are the next two that will benchmark against the OCR fringe.

Watch for two leading indicators: (a) the first listing prices on PropertyGuru and 99.co immediately after each project’s MOP date, and (b) the first three completed sales filed on the HDB Resale Portal. Together those are the cleanest first read on whether the Bedok South Horizon record is a one-off or a template for the cohort.

Frequently Asked Questions

How much income do you need to buy a S$1.17 million HDB flat?

Under MAS rules, a Mortgage Servicing Ratio (MSR) cap of 30% applies to HDB flats financed by a bank loan, and a Total Debt Servicing Ratio (TDSR) cap of 55% applies on top. At an indicative bank fixed rate of 2.85% and a 30-year tenure, the maximum loan on a S$1.17 million flat (after 25% downpayment) is roughly S$877,500. Stress-tested at 4.0%, that loan requires monthly household income of approximately S$13,950 to fit MSR. Cash and CPF down payment plus stamp duties take the entry-cost figure to roughly S$310,000.

Why is Bedok considered non-mature when it feels mature?

HDB classifies estates as “mature” or “non-mature” based on the age of the township, the size of the dwelling stock and the level of amenity development. Bedok feels mature culturally — Bedok 85 hawker centre, Bedok Reservoir, multiple shopping malls — but in HDB’s official BTO segmentation it is part of the broader East Region grouping where some pockets are still classified as non-mature for sales-launch eligibility purposes. The classification matters mainly for BTO pricing tiers and grant eligibility, not for resale.

Does CPF Accrued Interest reduce the seller’s net proceeds significantly?

Bedok South Horizon flats were bought as BTO at much lower prices in 2017-2018 (typical 4-room BTO price in that period was S$430k-S$500k). The CPF used for downpayment and instalments has compounded at the OA rate of 2.5% for around 8-9 years. On a typical buyer profile, CPF Accrued Interest at this stage is roughly S$70k-S$110k. Sellers receiving the S$1.17m gross will see roughly S$950k-S$1.05m net of mortgage redemption and CPF refund — still a healthy capital gain.

Are Bedok South Horizon prices reflective of the wider Bedok 4-room market?

Not directly. These are MOP-fresh flats with 94 years of lease, in a relatively new BTO project. The wider Bedok 4-room market includes flats with 60-70 years of lease in older blocks closer to Bedok Reservoir, which transact at very different price points. Bedok South Horizon sets a ceiling for what fresh-MOP top-quartile stock can achieve in the area, not the median.

Will the next MOP cohort match Bedok South Horizon’s pricing?

Mature-estate projects (Bidadari, Toa Payoh) typically clear higher psf than non-mature OCR fringe. Punggol waterfront flats in Northshore should clear comparable psf because of the lifestyle premium. Tampines GreenGem will be a closer Bedok analogue. Whether all of them break the S$1.17m mark depends on unit size and floor — Bedok South Horizon’s record was set on a high floor, which is a meaningful price-lift factor.

What does this mean for buyers in HDB BTO June 2026 ballot?

The June 2026 BTO exercise covers Ang Mo Kio, Bishan, Bukit Merah, Sembawang and Woodlands — all at BTO pricing tiers, well below resale levels. Bedok South Horizon’s record is not directly relevant. What is relevant is the implicit signal: prime-location MOP-fresh 4-room flats can clear above S$1m even in a softening index, which is a useful data point for first-time buyers weighing BTO ballot vs resale entry.

Disclaimer. This article reports a Singapore HDB resale transaction filed in April 2026, drawn from publicly disclosed HDB Resale Portal data and reporting by EdgeProp, Stacked Homes, and Yahoo Singapore. Specific lot, price, and lease numbers should be verified directly via the HDB Resale Flat Prices portal. Nothing here is financial advice. Verify all financing assumptions with the MAS TDSR/MSR rules and a licensed mortgage adviser before acting.

Singapore Double-Launch Weekend April 2026: TGR + Vela Bay Move 1,224 Homes in 48 Hours

Singapore Double-Launch Weekend April 2026: TGR + Vela Bay Move 1,224 Homes in 48 Hours

Published 28 April 2026. Reflects developer launch-weekend announcements and Singapore property press coverage of 25–26 April 2026.

Quick Answer — what happened

  • Two major Singapore new condo launches went live on the weekend of 25–26 April 2026: Tengah Garden Residences (863 units, 99-yr leasehold, GuocoLand × CSC Land) and Vela Bay (515 units, 99-yr leasehold, SingHaiyi × Haiyi Holdings).
  • Combined, the two projects sold 1,224 of 1,378 units (89%) over the launch weekend.
  • Tengah Garden Residences cleared 853 of 863 units (~99%) by Saturday afternoon, the strongest launch-day take-up since ParkTown Residences in February 2025.
  • Vela Bay sold 371 of 515 units (~72%), becoming the first private launch in the 60-hectare Bayshore waterfront precinct.
  • Average prices: Tengah Garden Residences ≈ S$1,700 psf, with units from S$980,000. Vela Bay ≈ S$2,886 psf, with units from S$1.27 million.
  • The weekend’s combined gross sales value is approximately S$2.4 billion, the largest dual-launch weekend on record for Singapore residential property.

The headline numbers

Singapore’s primary condo market has been described as “thin but priced firm” through Q1 2026. The weekend of 25–26 April 2026 ended that narrative with a single set of launch figures. By close of business Sunday, two new projects in different parts of the island had between them moved more units than the entire month of February 2026.

Tengah Garden Residences, the first private condominium launched inside the Tengah HDB-led new town, registered 853 sales out of 863 units — a 99% sell-through rate. Vela Bay, the first private residential launch in the Bayshore precinct in the East, sold 371 of 515 units. The two projects together absorbed buyer demand worth roughly S$2.4 billion in 48 hours.

Tengah Garden Residences and Vela Bay launch weekend results 25–26 April 2026 — combined 1,224 of 1,378 units sold
Figure 1: 1,224 of 1,378 units sold across the two projects — roughly 89% of available stock cleared in two days.

Tengah Garden Residences — the suburb story

Developed jointly by GuocoLand and CSC Land Group on a 99-year leasehold parcel along Tengah Garden Avenue (District 24), Tengah Garden Residences was launched at indicative prices from S$980,000 for one-bedroom units. Average pricing landed at roughly S$1,700 per square foot, slotting in between recent Outside-Central-Region (OCR) launches and the older Bukit Batok mass-market resale stack.

Key drivers of the near-sellout:

  • Pent-up Tengah demand. Tengah’s residential identity has been HDB-led since 2018, with no private launches inside the estate. The opening of the first private project tested an aspirational segment that had been waiting four years.
  • Pricing that read as “below ParkTown”. ParkTown Residences in Tampines launched at a higher OCR psf in February 2025; the Tengah price point felt restrained by comparison.
  • Singapore-Citizen-heavy buyer mix. Over 90% of buyers are reported to be Singapore Citizens, consistent with the post-2023 ABSD regime where foreign demand at OCR price points has thinned.
  • Connectivity story. Future Tengah MRT (Jurong Region Line, opening 2027–2028) and the proximity of the new Tengah town centre supported the long-hold buyer thesis.

Vela Bay — the Bayshore opener

Vela Bay, by SingHaiyi Group and Haiyi Holdings, launched at average prices of around S$2,886 psf, with one-bedroom units from S$1.27 million. The 515-unit project sits inside the Bayshore precinct, an emerging 60-hectare master-planned waterfront on the East Coast.

The Vela Bay take-up of 72% is more modest than Tengah Garden Residences’ 99%, but no less interesting:

  • Higher absolute price point. A typical 2-bedroom Vela Bay unit lands above S$2 million; that is a different buyer profile from Tengah.
  • First-mover premium. As the only private launch in a precinct still under construction, Vela Bay’s price had to absorb the discount buyers usually demand for “go-first” risk on infrastructure delivery.
  • Nine new sites in 1H 2026 GLS. URA’s 1H 2026 Government Land Sales programme released nine confirmed-list sites with capacity for ~9,185 units. The sequencing of those sites — including the Bayshore Drive mixed-use plot whose tender closes 15 July 2026 — is shaping how buyers price first-mover Bayshore stock.
  • SingHaiyi balance-sheet narrative. SingHaiyi has been a heavy participant in en-bloc and GLS bids in 2026 (it was also part of the consortium that won Loyang Valley en-bloc at S$880 million); its Bayshore launch is a clear conviction trade by the developer.
2026 Singapore condo launch sell-through rate comparison across major launches
Figure 2: Tengah Garden Residences sits at the top of the 2026 launch sell-through table. Vela Bay’s 72% is also above the 2026 OCR/RCR average.

What the weekend tells us about 2026 demand

Metric Reading Implication
Combined launch-weekend take-up 1,224 / 1,378 units (89%) Latent demand absorbing strongly when supply opens at the right price
OCR launch psf — Tengah ~S$1,700 Below recent comparable OCR launches; a “value” anchor for 2026 OCR pricing
RCR/East launch psf — Vela Bay ~S$2,886 Setting the benchmark for the Bayshore precinct ahead of the Bayshore Drive GLS tender
Buyer mix Predominantly Singapore Citizen Foreign demand still suppressed by the 60% ABSD; the market is local-driven
2026 launch pipeline ~17 projects, ~8,100 units 30% lower than 2025 — supply scarcity supports launch-day pricing power

What this means for buyers

For prospective Tengah buyers who missed the launch ballot, the resale option will likely sit at a 3–7% premium once units start changing hands — typical for a near-sellout launch. Tengah Garden Residences will not have additional release tranches for some months given the sell-through.

For Vela Bay, with 144 units (28%) still available, the post-launch phase remains accessible at launch pricing. Buyers should monitor whether units in Towers 1 and 2 are released before infrastructure milestones in the Bayshore precinct — first-mover units historically appreciate as the precinct fills out, but only if pricing on later launches doesn’t undercut them.

For the broader market, the weekend confirms that well-priced, well-located new launches in Singapore can still clear at speed in 2026, against the narrative of cooling-measure overhang. The discipline is on launch-day pricing: Tengah’s near-sellout came at a psf below what some industry watchers had projected for an OCR launch this cycle. Vela Bay’s slower (but still strong) take-up suggests that buyers in the higher-price RCR segment remain willing to pay up only for clearly differentiated locations.

What might come next

Two near-term watchpoints:

  • Bayshore Drive mixed-use GLS tender (closes 15 July 2026). The land bid will be read against Vela Bay’s launch psf as a price discovery point for the precinct.
  • BTO June 2026 ballot (~6,900 flats). If HDB pricing continues to compress against private OCR pricing, the substitution effect supports a second wave of OCR private demand later in 2026.

The next major private launches in the calendar — Bayshore Drive (if the tender awards in 1H 2026), Sembawang Drive EC, and a likely 2H 2026 District 5 OCR launch — will tell us whether the 25–26 April weekend was a one-off catch-up after a thin Q1, or the start of a measurably stronger primary market.

Frequently asked questions

Why did Tengah Garden Residences sell so much faster than Vela Bay?

Three reasons. First, price: at ~S$1,700 psf, Tengah’s entry price of S$980,000 sits below the typical OCR launch and is reachable for HDB upgrader couples. Vela Bay at ~S$2,886 psf and S$1.27 million entry sits in a different affordability cohort. Second, Tengah is a four-year-old new town with a built-out HDB community already in occupation; Vela Bay is the first launch in a precinct still under construction. Third, Tengah was the first private launch in the new town — a one-off scarcity premium that Vela Bay does not enjoy because more Bayshore launches will follow.

Is this evidence that cooling measures aren’t working?

Not necessarily. Cooling measures (the April 2023 ABSD hike, the September 2022 LTV / TDSR tightening) have visibly suppressed foreign demand and kept investor flows thin. The April 2026 launches were powered overwhelmingly by Singapore Citizen owner-occupier and upgrader demand, which is exactly the segment policy-makers wanted to remain active. The strong take-up reflects pent-up local demand meeting limited new supply, not a re-acceleration of speculative buying.

Should buyers chase a near-sellout launch like Tengah?

Generally no. Once a launch clears 90%+, the remaining stock is typically the less attractive layouts or units, and the resale market opens at a premium. The discipline for buyers is to be at the front of the queue at launch — or wait for the resale market to settle 6–9 months later when the urgency premium has softened.

What does this mean for the Bayshore Drive GLS tender?

Vela Bay’s 72% sell-through at ~S$2,886 psf gives bidders a reference point for what a Bayshore launch can absorb at price. If the Bayshore Drive GLS tender bids land at above S$1,400 psf ppr, the implied launch psf for the next Bayshore project would be approximately S$3,000+, which is testable against Vela Bay’s revealed demand curve.

How does this compare to historical strong launches?

The 99% Tengah figure is the highest launch-weekend take-up since ParkTown Residences in February 2025, which moved 87% on launch day. Going further back, Lentor Mansion (2024), Amo Residence (2022), and Treasure at Tampines (2019) all booked similar 90%+ launch-day percentages. Each of those projects shared the same ingredients as Tengah: a clear price-point anchor, an underserved sub-market, and a strong upgrader cohort.

Will more units be released?

For Tengah Garden Residences, the developer has not announced a second tranche; with only 10 units unsold, there is little to release. For Vela Bay, the remaining 144 units (28%) will be released in batches over the coming weeks at the same indicative price band; movements above launch pricing typically follow demonstrated take-up of 80%+.

Disclaimer. All sales figures, prices and dates are based on developer launch-day announcements and public reporting in the Singapore property press. Final transaction figures will be reflected in URA Realis caveats over the coming weeks. This article is general market commentary and does not constitute investment, legal or financial advice. Buyers should always verify current pricing and availability with the developer’s appointed sales gallery and consult a licensed Singapore conveyancing lawyer before exercising any Option to Purchase. Cooling-measure thresholds and ABSD rates are administered by the Inland Revenue Authority of Singapore and the Monetary Authority of Singapore.
New Launch
Tengah Garden Residences
Vela Bay
Singapore Property Market
Property News
OCR
Bayshore
Tengah
SingHaiyi
GuocoLand

HDB Resale Prices Slip 0.1% in Q1 2026 — First Quarterly Decline in Almost Seven Years

HDB Resale Prices Slip 0.1% in Q1 2026 — First Quarterly Decline in Almost Seven Years

The Housing & Development Board released its full Q1 2026 statistics on 24 April 2026, confirming what the flash estimate had hinted at three weeks earlier: the HDB Resale Price Index slipped 0.1% quarter-on-quarter, the first quarterly contraction in almost seven years. The last time HDB resale prices fell on a QoQ basis was Q2 2019, before the post-COVID supply squeeze and the surge in million-dollar transactions reset the public-housing market.

The headline is small in absolute terms — one-tenth of one percent — but it lands as the inflection most market participants have been waiting for since price growth stalled in mid-2024. Coupled with a private residential market that rose 0.9% in the same quarter, Q1 2026 is the rarest of episodes: a clean break in the public-vs-private price trajectory.

Quick Answer — what changed in Q1 2026

  • HDB Resale Price Index: −0.1% QoQ — first quarterly fall since Q2 2019 (27 quarters ago).
  • Private Property Price Index: +0.9% QoQ — led by non-landed at +1.3%.
  • Million-dollar HDB resale share moderated after a record-setting 2025.
  • HDB pipeline: 6,900 BTO flats coming in June 2026 across Ang Mo Kio, Bishan, Bukit Merah, Sembawang, Woodlands.
  • Developer sales for private new launches: ~3,375 units, −32% QoQ after a heavy 4Q 2025 launch slate.
  • The HDB-vs-private QoQ gap (~1.0 ppt) is the widest in HDB’s-down direction since 2009.

The Number in Context

HDB Resale Price Index history makes the Q1 print feel less like a sudden drop and more like the natural end of a deceleration. Growth was 2.5% in Q3 2024 at its peak, slowed to 0.5% in Q3 2025, and ticked up modestly to 0.7% in Q4 2025 before turning negative in Q1 2026. The chart below sets the trajectory out cleanly.

HDB Resale Price Index quarter on quarter percentage change Q2 2023 to Q1 2026 first decline since Q2 2019
Figure 1. HDB Resale Price Index, quarter-on-quarter percentage change from Q2 2023 to Q1 2026. Q1 2026 is the first negative print in 27 quarters; the previous decline was Q2 2019. Growth had been decelerating for five consecutive quarters before turning negative.

Reading the bars carefully, the deceleration has been visible since Q2 2025 (+0.9%) and has been a steady step-down rather than a spike-then-fall. That tells us the Q1 2026 fall is most likely the cumulative effect of supply-side and demand-side easing rather than a single-quarter shock.

The Divergence: HDB Down, Private Up

The single most striking feature of Q1 2026 is not the HDB number on its own — it is how it sits next to the private market.

HDB resale negative 0.1 percent versus private residential positive 0.9 percent Q1 2026 Singapore housing divergence
Figure 2. HDB resale fell 0.1% QoQ while private residential rose 0.9% in Q1 2026, with non-landed private property up 1.3%. The 1.0 ppt gap in HDB’s down-direction has not been seen since 2009.

The mass-market substitution effect — private buyers priced out of the bottom end downgrading to HDB resale, supporting prices — has weakened compared with 2024-2025. Two reasons appear to be at play. First, OCR new launch projects launched in Q1 2026 priced higher than the comparable launches a year ago, which discouraged the marginal HDB-to-private trade-up buyer and, by feedback, reduced cash-over-valuation pressure on resale. Second, the private market’s gain is narrowly concentrated at the top end (188 transactions of S$5M+, the highest in two years), which does not transmit downward into mass-market public housing.

What Drove the HDB Softness

Three structural drivers, all working in the same direction:

  1. BTO supply is back. HDB has put roughly 19,600 BTO flats to ballot across the three exercises in 2025 and the May 2026 launch. The pipeline announcement of another 6,900 flats in June 2026 reinforces the message: first-time buyers can wait, and many are. Substitution from resale to BTO is now structurally easier than at any point since 2019.
  2. Post-MOP supply is approaching a 5-year peak. Flats from the 2018-2020 BTO bumper slate are clearing their five-year Minimum Occupation Period, putting more resale stock on the market exactly as demand cools. EdgeProp has tracked roughly 25,000-26,000 MOP-eligible units coming online in 2026 alone, a higher number than the 2024 cohort.
  3. Million-dollar mania has cooled. The volume of S$1m+ HDB resale transactions stabilised in late 2025 and shows the first signs of moderation in Q1 2026. This does not pull the index meaningfully on its own, but it removes one of the louder narrative supports of the previous two-year run.

Summary Statistics — Q1 2026 Market Scoreboard

Metric Q4 2025 Q1 2026 QoQ change
HDB Resale Price Index +0.7% −0.1% −0.8 ppt
URA Private Residential PPI +0.6% +0.9% +0.3 ppt
URA Non-Landed Sub-Index −0.2% +1.3% +1.5 ppt
Developer launches (uncompleted units) 2,632 1,844 −30%
Unsold pipeline (incl. ECs) ~16,800 17,032 +1.4%

What This Means for Buyers and Sellers

HDB buyers — particularly first-timers — have a cleaner case to be patient. With BTO supply rising, post-MOP resale supply rising, and price momentum reversing, the cost of waiting six to twelve months is lower than at any point in the last three years. Buyers who must transact in 2026 should benchmark against fewer comparable sales rather than panic-bid; offers at the lower end of the previous month’s transaction band are realistic.

HDB sellers need to recalibrate. Pricing aspirations anchored on Q3 2024-style runaway million-dollar headlines are now visibly out of line with the market. Buyers’ agents are reporting the first widespread instances of price reductions on listings sitting more than 30 days, which had been almost unheard of since 2020. The right pricing strategy is: list at the median of the most recent six transactions in your block-and-flat-type bracket, not the high.

Private-market buyers face the opposite signal. Top-end CCR continued to absorb in volume, mid-tier RCR new launches priced well, and the unsold pipeline has begun to rise for the first time in five quarters — a sign that absorption is lagging supply. Mass-market OCR resale comparables are softening (helped by the HDB knock-on); buyers in this segment have negotiating leverage they did not have in 2024.

What Might Come Next

The Q2 2026 numbers, to be released in late July, will tell us whether Q1 was a one-quarter wobble or the start of a flatlining/down trend. Watch:

  • The BTO June 2026 ballot uptake — if first-timer demand for the Bishan and Ang Mo Kio sites is heavily oversubscribed, that confirms the substitution-from-resale-to-BTO story.
  • Median CoV (cash-over-valuation) — if median CoV continues to drift toward zero across mature estates, sellers will follow.
  • 5-year-MOP-onset volume in 2H 2026 — we expect another 12,000-13,000 units to hit MOP in the second half, doubling the resale supply boost relative to 1H.
  • Cooling-measure response — with the public side cooling on its own, MOF/MND have one less reason to introduce new public-housing-targeted measures. ABSD-side calibration is more likely if private prices keep accelerating.

Frequently Asked Questions

Is HDB resale officially in a “downturn” now?

One quarter of −0.1% does not constitute a downturn by any conventional definition — analysts typically wait for two consecutive quarters of contraction or a cumulative drop of ≥ 1% before using that label. What Q1 2026 is, is the first credible inflection in the multi-year uptrend. The market is now in a state where flat-to-mildly-negative is the most likely path through 2026, with renewed growth contingent on demand-side surprise (faster job growth, immigration tailwinds) or supply-side disappointment (BTO delays, slower MOP releases).

How does the −0.1% break down by flat type?

HDB does not publish flat-type sub-indices in the headline release, but transaction-level analysis from third-party platforms suggests softness was concentrated in 4-room and 5-room mature-estate units — the segments that drove the 2024-25 million-dollar run-up. 3-room and Executive Apartments held up better. Non-mature-estate prices were close to flat. We expect HDB’s breakdown press release later in May to confirm this pattern.

Does this affect HDB BTO ballot demand?

Indirectly, yes — in two opposing directions. A softer resale market makes resale a more accessible alternative to BTO (lower headline asking prices, less million-dollar drama), which could reduce BTO oversubscription. But uncertainty about future resale prices also pushes risk-averse first-timers toward BTO’s known-cost path, which could increase ballot demand. The June 2026 ballot will be the cleanest read on which effect dominates.

Are the cooling measures from December 2024 finally working?

The August 2024 HDB-loan tightening (LTV cut from 80% to 75% for HDB loans) and the December 2024 cooling measures certainly removed marginal demand at the top of the price band. But the resale slowdown is at least as much a supply story (BTO ramp + MOP wave) as a demand story (cooling measures + interest rates). Officials will be cautious about declaring victory; the gap to private prices will be the metric they watch closest.

Should I delay my HDB resale purchase?

If you have a flexible 12-month buying window, the case for patience has strengthened. If you need to transact in the next 90 days (e.g. for relocation, family reasons, or a coordinated upgrade), the headline change is small enough that timing arguments are second-order — price the unit you want and negotiate hard against current comparables. The bigger risk for buyers right now is overpaying the late-cycle list price, not underpaying ahead of a rebound.

How does this compare to the 2009 episode?

2009 was the global-financial-crisis quarter when HDB resale fell 0.8% as Singapore entered a technical recession. The current episode is much smaller in scale (−0.1%) and the macro backdrop is different — no recession, employment is solid, and interest rates are easing rather than spiking. So 2009 is a useful reference for “first decline after years of growth”, but not for the magnitude or duration of what may follow.

Related Articles

Disclaimer

This piece is for general information only and does not constitute investment, financial, or property advice. Statistics are drawn from the Housing & Development Board Q1 2026 release of 24 April 2026 and the Urban Redevelopment Authority Q1 2026 release of the same date. Always verify current figures with the primary sources, and consult a licensed property professional before transacting.

Translate »