URA 1H 2026 GLS Programme: All 9 Confirmed List Sites Analysed — Supply, Locations and Price Outlook

URA 1H 2026 GLS Programme: All 9 Confirmed List Sites Analysed — Supply, Locations and Price Outlook

URA 1H 2026 GLS Programme: All 9 Confirmed List Sites Analysed — Supply, Locations and Price Outlook

Quick Answer — 1H 2026 GLS Confirmed List at a Glance

  • 9 sites on the 1H 2026 Confirmed List: 6 private residential, 1 mixed-use, 2 EC plots
  • Total supply: 3,940 private residential units + 635 EC units = 4,575 units via confirmed list
  • Bayshore Drive mixed-use site is the headline parcel — 1,280 residential units + 22,500 sqm commercial
  • Holland Plain (2nd site) sole bid received: Sim Lian at S$1,491 psf ppr (tender closed 7 May 2026)
  • Peck Hay Road (Newton CCR) tender closes 11 June 2026; River Valley Green Parcel C closes 18 June 2026
  • 1H 2026 confirmed list private supply is ~50% above the 10-year average — Government signalling adequate pipeline
  • Two EC sites at Canberra Drive (185 units) and Sembawang Drive (450 units) — now subject to 10-year MOP post-8 May reforms

The Urban Redevelopment Authority’s Government Land Sales (GLS) programme is the primary tool through which Singapore manages its private residential and executive condominium housing pipeline. Every new launch condo you see advertised — from Vela Bay to Tengah Garden Residences — originates with a developer winning a GLS tender years earlier. Understanding what is on the 1H 2026 confirmed list, where those sites sit, and what developers are likely to pay for them tells you a great deal about where new private supply will come from in 2028 and beyond.

This analysis covers all nine confirmed list sites from the 1H 2026 GLS programme, tracking tender timelines, indicative psf ppr ranges, expected launch pricing implications, and the macro supply picture. We cross-reference each site’s outcome against the most recent tender awards to give the clearest picture available as at 17 May 2026.

The 9 Confirmed List Sites — Overview and Unit Yield

URA 1H 2026 GLS confirmed list 9 sites by unit yield Singapore
Figure 1: URA 1H 2026 GLS Confirmed List — all 9 sites by estimated unit yield, colour-coded by market segment (CCR, RCR, Mixed-Use, EC). Sources: URA, MND, December 2025.
Site Location / Region Units Tender Status (May 2026) Indicative Launch PSF
Holland Plain (2nd site) D10 / CCR, Bukit Timah ~280 Closed 7 May; Sim Lian sole bid S$1,491 psf ppr S$2,800–S$3,200+
Peck Hay Road Newton / CCR ~315 Tender closes 11 June 2026 S$3,200–S$3,800+
Berlayar Drive Gr Southern Waterfront / RCR ~415 Tender open / result pending S$2,400–S$2,900
New Upper Changi Road Bedok / RCR-adjacent OCR ~385 Tender open / result pending S$2,100–S$2,500
River Valley Green Parcel C River Valley / CCR ~245 Tender closes 18 June 2026 S$3,500–S$4,000+
Lorong Puntong (Sin Ming) Bishan–AMK / RCR ~310 Tender open / result pending S$2,400–S$2,800
Bayshore Drive (Mixed-Use) Bayshore / RCR-adjacent ~1,280 Tender just opened; est. closes Jul 2026 S$2,750–S$3,100
Canberra Drive EC Sembawang / North ~185 Tender result pending S$1,400–S$1,600 (EC)
Sembawang Drive EC Sembawang / North-East ~450 Tender result pending S$1,350–S$1,550 (EC)

The Supply Context — Is 1H 2026 GLS Generous or Restrained?

Singapore GLS confirmed list supply trend private residential and EC 2023 to 2026
Figure 2: Singapore GLS Confirmed List supply, 2H2023–1H2026 — private residential and EC units. Sources: URA GLS Programme announcements.

The 1H 2026 confirmed list private residential supply of 3,940 units is approximately 50% above the 10-year average for a half-year GLS confirmed list, according to URA’s own commentary on the programme at announcement in December 2025. The Government has explicitly stated that this elevated supply is intended to “provide adequate housing options to cater to housing demand” and to moderate price growth — particularly after private residential prices rose 0.9% in Q1 2026 (following 0.6% in Q4 2025), driven by outside central region (OCR) outperformance.

However, the 3,940 private units across six sites is still meaningfully below the 5,450 units offered in 1H 2024 (the cyclical peak). The pattern reflects the Government’s calibrated approach: high enough to signal commitment to supply, but not so aggressive as to flood the pipeline and depress developer sentiment. The Reserve List (which requires developer applications to activate) provides an additional buffer of approximately 5,200 private units that can be unlocked if demand signals warrant it.

Site-by-Site Analysis

Holland Plain (2nd Site) — A Sole Bid That Surprised Analysts

The second Holland Plain site drew a single bid from Sim Lian Group at S$1,491 psf ppr (S$454 million) when the tender closed on 7 May 2026. Analysts had expected three to five bidders; the sole bid reflects elevated construction cost pressure, the lingering premium already embedded in District 10 pricing, and the fact that Sim Lian already holds the adjacent first Holland Plain site. A sole bid does not automatically mean the site will be awarded — URA typically evaluates whether the bid meets the reserve price — but Sim Lian’s continued strategic interest in Holland Plain is clear.

If awarded at S$1,491 psf ppr, market observers indicate a launch PSF of approximately S$2,800–S$3,200 would be needed for the developer to achieve a reasonable margin. This would mark a modest premium to recent CCR resale comparables in the D10 corridor, but is not out of step with the broader trajectory of central region new launches.

Peck Hay Road — Newton’s Newest CCR Site (Closes 11 June 2026)

The Peck Hay Road site is arguably the most competitively positioned residential plot in the 1H 2026 programme. Located in the Newton MRT interchange area (North South and Downtown Lines), the 0.55-hectare former transitional office site is expected to yield approximately 315 units. Newton is one of Singapore’s most liquid and sought-after CCR sub-markets; recent comparable projects in the vicinity have transacted at S$3,000–S$3,800 psf for new launches.

The tender closes 11 June 2026. Given Newton’s track record with competing bids — the area consistently attracts four to six developers per tender — this is likely to be one of the more competitive tenders of the half. A top bid in the S$1,600–S$1,900 psf ppr range is plausible.

River Valley Green Parcel C — CCR Premium Pricing (Closes 18 June 2026)

River Valley Green Parcel C is the third plot in the River Valley Green precinct and sits within Singapore’s prime residential core. The previous two parcels in this precinct were awarded at S$1,246 psf ppr (Parcel A, 2023) and S$1,402 psf ppr (Parcel B, 2024). Parcel C is expected to follow this upward trajectory, with a likely bid range of S$1,450–S$1,700 psf ppr. At those land costs, launch pricing of S$3,500–S$4,000+ psf is feasible. The tender closes 18 June 2026.

Bayshore Drive Mixed-Use — The Billion-Dollar Site

Bayshore Drive is the marquee site of the 1H 2026 programme. As a mixed-use parcel combining 1,280 residential units with 22,500 sqm of commercial space and a direct underground link to Bayshore MRT station (Thomson-East Coast Line), it is the largest and most complex tender in the current cycle. URA and EdgeProp analysis suggests bids of S$1.2–S$2 billion are plausible — making it one of the largest single GLS transactions in Singapore’s history if realised at the upper end. The tender was recently opened and is expected to close around July 2026. We will report on the results as they emerge. See our full Bayshore Drive analysis published 17 May 2026 for detailed site-level commentary.

The Two EC Sites — First Launches Under the New Rules

Canberra Drive (185 units, Sembawang) and Sembawang Drive (450 units) are the first EC tender sites to be marketed entirely under the 8 May 2026 rule changes — specifically the 10-year MOP, 90% first-timer quota, Normal Payment Scheme only, and 15-year privatisation. Developers bidding for these sites must now price in a longer hold requirement and potentially reduced secondary-market liquidity for buyers, which may moderate land bids slightly relative to pre-May 2026 EC tenders. That said, the 90% first-timer quota actually increases base demand, partially offsetting the downward pricing pressure from the MOP extension.

Worked Example — How GLS Land Cost Translates to Launch Price

To understand why these GLS tender outcomes matter for buyers, consider a simple breakeven analysis. If Peck Hay Road is awarded at S$1,750 psf ppr (the psf per plot ratio applied to the maximum permissible gross floor area), a developer builds 315 units on a 0.55 ha site with a plot ratio of approximately 3.5 (hypothetical). Total land cost per unit: approximately S$960,000–S$1,100,000 per unit across a mix of 1-bedroom to 3-bedroom formats.

Adding construction costs (approximately S$450–S$550 psf of GFA in 2026), financing costs (~5–7% of total development cost over 4–5 years), professional fees, and developer margin (~15–18% on cost), the resulting launch price to achieve commercial viability is approximately S$3,200–S$3,600 psf for a typical Newton CCR new launch. This is the arithmetic that underpins the price forecasts in our summary table above.

For buyers, the practical implication is straightforward: land acquired in 1H 2026 tenders will yield projects launching in approximately 2028–2029. The prices you see in those launch brochures will reflect today’s land cost, construction cost inflation over the next two years, and developer expectations for market conditions at launch.

What to Watch in 2H 2026

The three immediate milestones for the GLS programme are: the Peck Hay Road tender result (11 June), River Valley Green Parcel C result (18 June), and the Bayshore Drive tender outcome (expected ~July 2026). Each will provide a live read on developer appetite, construction cost pressures, and land pricing at different market segments.

The 2H 2026 GLS programme (expected to be announced in June 2026) will also be watched closely for whether the Government adjusts the confirmed list size up or down — a signal of its read on both housing demand and developer capacity. Given Q1 2026’s 0.9% private price rise, any material reduction in the 2H confirmed list would likely be read as a market-positive signal by developers and investors alike.

Frequently Asked Questions

What is the GLS programme and how does it affect property prices?

The Government Land Sales (GLS) programme is the mechanism through which URA and HDB release state land for private and public housing development. Developers bid competitively for confirmed list sites, and the winning bid establishes the land cost that feeds through into eventual new-launch pricing approximately 3–5 years after the tender award. A higher volume of GLS sites — and more competitive bidding — generally anchors the supply pipeline and moderates price growth. Conversely, a lean GLS programme or weak bidding signals supply tightening and can anticipate future price pressure. For buyers of new launch condominiums, understanding the GLS pipeline helps set realistic expectations for the prices and supply timing of projects coming to market in 2027–2029.

Why did Holland Plain attract only one bid?

The sole bid for the Holland Plain second site reflects a combination of factors: (1) construction costs remain elevated in Singapore, squeezing developer margins on premium CCR land; (2) Sim Lian already holds the adjacent first Holland Plain site, giving them a strategic advantage that reduces other developers’ relative competitiveness; (3) rising interest rates globally (despite Singapore’s SORA decline) have increased the cost of development financing; and (4) the site’s expected launch PSF of S$2,800–S$3,200 sits in a segment where buyer depth (given ABSD and TDSR constraints) is more limited than in the OCR. A sole bid is unusual but not unprecedented in CCR tenders.

What is the Bayshore Drive mixed-use site and why is it significant?

The Bayshore Drive site is a 3.4-hectare mixed-use parcel that combines 1,280 residential units with 22,500 sqm of commercial gross floor area and a direct underground pedestrian connection to Bayshore MRT (Thomson-East Coast Line). Its significance lies in scale (it is among the largest single GLS parcels offered in several years), location (the emerging Bayshore precinct next to East Coast Park), and mixed-use zoning (which adds commercial value alongside residential). If awarded at estimated values of S$1.2–S$2 billion, it will be one of the highest-value individual land sales in Singapore’s GLS history. See our Bayshore Drive GLS Tender 2026 piece for full site analysis.

How does the 1H 2026 GLS supply compare to previous years?

The 3,940 private residential units on the 1H 2026 confirmed list is approximately 50% above the 10-year average for a half-year confirmed list, but below the 5,450-unit peak seen in 1H 2024. URA has explicitly framed the elevated supply as a measure to ensure adequate pipeline and moderate price growth. Combined with the 12-site reserve list providing a further ~5,200 private units that can be activated on demand, total potential supply from the 1H 2026 GLS programme is approximately 9,185 units — a robust buffer against near-term supply shortfalls.

Should I wait for GLS results before buying a new launch?

GLS results affect new launches that will be built and sold approximately 3–5 years from now — they do not directly affect the pricing of projects already in the market today (such as Bayshore Parcel A, Tengah Garden Residences, or projects under construction). If you are considering a new launch purchase in 2026, the relevant supply is what is already available and selling, not what developers will bid for land this year. That said, monitoring GLS demand (bid volumes, psf ppr paid) gives a useful forward signal: when developers bid aggressively, they believe in future demand and pricing — which is supportive for current buyers. When they bid conservatively or not at all (as with Holland Plain’s sole bid), it may suggest more caution about the premium segment’s near-term outlook.

Related Articles

Disclaimer: This analysis is for general informational and commentary purposes only and does not constitute financial, investment, or property advice. GLS tender outcomes, indicative unit yields, and launch price projections are estimates based on publicly available data from URA, MND, and industry commentary as at 17 May 2026, and are subject to change. Actual tender results, awarded prices, and developer launch strategies may differ materially from projections. Always conduct independent research and consult a licensed conveyancing lawyer, financial adviser, or property consultant before making any investment decision. For official data, refer to URA.gov.sg, MND.gov.sg, and HDB.gov.sg.

Bayshore Drive GLS Tender 2026: Singapore’s Largest Integrated Site Could Draw a S$2 Billion Bid

Bayshore Drive GLS Tender 2026: Singapore’s Largest Integrated Site Could Draw a S$2 Billion Bid

Published: 17 May 2026  |  Sources: URA, EdgeProp, The Edge Singapore, Stacked Homes

Quick Answer: What Is the Bayshore Drive GLS and Why Does It Matter?

  • The Bayshore Drive mixed-use GLS site is the second government land sale in the Bayshore precinct and the sole mixed-use plot in the URA’s 1H 2026 GLS Programme.
  • At 5.74 hectares (616,506 sq ft) with a maximum GFA of over 1.6 million sq ft, it is one of Singapore’s largest single GLS sites in years.
  • The site can yield approximately 1,280 residential units plus around 22,500 sqm of commercial space, integrated with Bedok South MRT (TE30) and a new bus interchange.
  • Tender closes 15 July 2026 at noon. Industry analysts forecast 2–6 bids with the top bid reaching S$1.15–S$1.25 billion (S$1,150–S$1,250 psf ppr).
  • The first Bayshore GLS site (Bayshore Road, private residential, 515 units) was awarded to SingHaiyi-Garnet at S$1,388 psf ppr in March 2026 — a land rate record for the eastern precinct.
  • When completed (estimated late 2030s), the development will anchor Singapore’s newest 60-hectare waterfront residential estate on the Eastern tip of the island.

Singapore’s Next Landmark: The Bayshore Precinct Takes Shape

The Urban Redevelopment Authority (URA) launched the tender for the Bayshore Drive mixed-use Government Land Sale (GLS) site on 30 March 2026, marking a significant milestone for Singapore’s eastern waterfront development agenda. The tender — which closes on 15 July 2026 at noon — is for a 99-year leasehold plot that will become the centrepiece of the Bayshore precinct, a new 60-hectare estate that URA has been planning since its 2019 Master Plan.

The Bayshore precinct is positioned between East Coast Park and the upcoming Thomson-East Coast Line (TEL) corridor, flanking the Bedok South (TE30) and Bayshore (TE29) MRT stations. It is envisioned as a car-lite, green-intensive residential and commercial node — and with two major GLS tenders now in play, the precinct is transitioning from long-term planning aspiration to concrete development reality.

Bayshore GLS site comparison 2026 — two sites in the eastern precinct
Figure 1: Two Bayshore GLS sites in 2026 — Site A (Bayshore Road, awarded March 2026) vs Site B (Bayshore Drive, tender closes July 2026). Sources: URA, EdgeProp.

Site B: The Bayshore Drive Mixed-Use Plot in Detail

The Bayshore Drive site (referred to as “Site B” in this analysis) is materially larger and more complex than the Bayshore Road residential plot (Site A). Key specifications:

Parameter Details
Site area 616,506 sq ft (5.74 hectares)
Tenure 99-year leasehold
Maximum GFA >1.6 million sq ft
Residential yield ~1,280 units
Commercial component ~22,500 sqm (minimum requirement)
Infrastructure integration Bedok South MRT (TE30), new bus interchange, pedestrian/cycling paths
Tender launched 30 March 2026
Tender closes 15 July 2026, 12:00 noon
Expected bids 2–6 developer consortiums
Indicative top bid S$1.15B–S$1.25B (S$1,150–S$1,250 psf ppr)

The commercial requirement of 22,500 sqm is significant — it ensures that the successful developer cannot treat the site as a purely residential play, but must deliver a meaningful retail, food and beverage, and services podium that will serve the wider Bayshore community. This mirrors the model used at major integrated developments such as Tampines Mall/Century Square (integrated with Tampines MRT) and Bedok Residences (integrated with Bedok MRT). At 1,280 residential units above a commercial podium and an MRT station, the Bayshore Drive development is likely to be branded and marketed as one of Singapore’s most ambitious integrated residential projects since One-North Eden or Tengah Town.

Eastern Singapore GLS land rate progression 2022 to 2026
Figure 2: Eastern Singapore GLS land rate progression 2022–2026 in S$ psf ppr. Bayshore Drive (July 2026) is analysts’ indicative range; not yet awarded. Sources: URA, EdgeProp, The Edge Singapore.

Site A: What the Bayshore Road Award Tells Us About Site B Pricing

The Bayshore Road residential GLS site (Site A) provides the clearest pricing anchor for analysing Site B. That tender closed on 18 March 2026 with eight bids — the highest number of bids for a private residential GLS site since January 2022 — with SingHaiyi-Garnet submitting the top bid of S$658.89M, or S$1,388 psf per plot ratio (ppr). The second-highest bid came within 2% of the winner’s, indicating strong developer conviction about the precinct’s value proposition.

For Site B, the calculus is different. The mixed-use mandate (22,500 sqm of commercial space) adds operational complexity and carries some development risk relative to a pure residential site. However, the MRT and bus interchange integration provides substantial anchor value — both through the captive retail audience and through the premium pricing that integrated developments command versus stand-alone condominiums. Industry analysts suggest the mixed-use overlay could support a somewhat lower land rate (S$1,150–S$1,250 psf ppr) than the residential-only Site A (S$1,388 psf ppr), but the sheer scale of the site means total bid values could still reach S$1.84B–S$2B.

Worked Example: What the Bayshore Drive Development Might Cost Buyers

Indicative Breakeven and Launch Pricing
Assuming the winning bid lands at S$1,200 psf ppr (within the forecast range):
Land cost: S$1,200 × estimated GFA ~1.6M sq ft = ~S$1.92B.
Adding construction (~S$500–S$600 psf of GFA), professional fees, finance, and developer margin (~15%), the all-in development cost suggests a breakeven of approximately S$2,400–S$2,600 psf on the residential component.

Indicative launch price (typically 15%–20% margin above breakeven): S$2,750–S$3,100 psf.
Typical 2-bedroom unit (700–800 sqft): approximately S$1.93M–S$2.48M.
Typical 3-bedroom unit (1,000–1,100 sqft): approximately S$2.75M–S$3.41M.

For a SC buyer purchasing a 2-bedroom unit at S$2.2M as a first private property:
BSD = S$3,600 + S$3,600 + S$19,200 + S$26,000 + (S$200,000 × 5%) = ~S$62,400. ABSD: 0% (first property).
Down payment (25%): S$550,000. Bank loan (75% LTV, S$1,650,000 @ 1.80% fixed): ~S$5,838/month. TDSR requires minimum gross household income of ~S$10,600/month to qualify.

What the Bayshore Development Means for Surrounding Property

The progressive build-out of Bayshore precinct is exerting an upward force on property values across the southern Bedok estate, particularly for units along or near the TEL corridor. The Bedok South Horizon HDB cluster’s record-breaking S$1.17M 4-room transaction in April 2026 — at S$1,168 psf, within spitting distance of nearby condominium prices — is a direct manifestation of this precinct-lift effect. As the Bayshore Drive development progresses from tender to construction to completion (likely 2031–2033), each milestone is expected to ratchet up capital values for both existing resale condominiums (Bayshore Park, Savannah CondoPark, Costa del Sol) and newly MOP-ed HDB flats in the Bedok South area.

For investors, the key question is whether the current resale condominiums in the Bayshore belt — trading at S$1,200–S$1,500 psf for older 99-year leasehold stock — offer sufficient margin of safety relative to new-launch pricing at S$2,750–S$3,100 psf. The wide gap suggests that legacy stock currently looks relatively attractive on a PSF basis, though age and remaining lease tenure must be factored into any long-term return analysis.

FAQ: Bayshore Drive GLS Tender 2026

When does the Bayshore Drive GLS tender close?
The tender closes on 15 July 2026 at 12:00 noon. URA typically takes 2–4 weeks to evaluate bids and announce the winning developer, so the result is expected around August 2026. Once awarded, the developer has a set construction commencement period (typically 12–24 months) and a completion deadline specified in the GLS conditions.
Can members of the public bid on a GLS site?
No. GLS tender submissions are open to licensed housing developers only, not individual buyers. Individual buyers will have the opportunity to purchase units from the developer once the project is launched for sale — typically 2–3 years after the GLS award, following design approval, building plan submission, and construction commencement. Buyers interested in the Bayshore Drive development should track URA’s project approval notices and register their interest with the eventual developer once pre-sales commence.
Why is the Bayshore precinct significant for Singapore’s property market?
Bayshore is one of the last large-scale undeveloped coastal precincts in Singapore, sitting between the established Bedok estate and the East Coast Park waterfront. Its 60-hectare footprint, combined with the TEL’s Bedok South and Bayshore stations, positions it as a greenfield opportunity comparable in scope to the earlier development of Tampines, Punggol, and — more recently — Tengah. The two 2026 GLS sites have confirmed developer confidence in the precinct and put a market-clearing price on Bayshore land. Once the integrated development is completed, Bayshore will have a fully formed commercial podium, an MRT-integrated community, and direct park-connector access to East Coast Park — a lifestyle combination that currently commands S$3,000+ psf only in CCR districts like Orchard or River Valley.
How does the Bayshore Drive site compare to other mixed-use GLS awards?
The Bayshore Drive site’s 1,280-unit yield and 22,500 sqm commercial mandate place it in the tier of Singapore’s largest mixed-use integrated developments. Comparable precedents include the Canberra MRT integrated development (~700 units + retail), Tampines Ave 11 mixed-use (1,190 units, commercial podium, awarded 2023), and the Holland Village mixed-use extension. At S$1.15–S$1.25B indicative bid, it would represent the largest single land transaction in Singapore’s eastern region, underscoring the government’s confidence that the Bayshore precinct can sustain premium pricing while still delivering meaningful supply to the market.
Should I buy near Bayshore now before the GLS development is completed?
This is an investment decision that depends on your holding period, risk tolerance, and financial profile — and LovelyHomes does not provide personalised investment advice. The general market view is that legacy resale condominiums in the Bayshore/Bedok South belt (Bayshore Park, Savannah CondoPark, etc.) offer a significant PSF discount relative to what new Bayshore launches are expected to cost. However, these older projects carry shorter remaining leasehold tenures (typically 40–55 years remaining as of 2026), which affects financing options (CPF withdrawal restrictions apply), refinancing, and eventual resale value. Always verify remaining lease tenure via URA’s REALIS before purchasing. Consult a licensed valuerer and financial adviser before committing.

Related Articles

Disclaimer: All pricing forecasts, land rate estimates, and development projections are indicative only and sourced from published analyst commentary and industry research desks as at May 2026. Actual GLS bid results, development timelines, and new-launch pricing may differ materially. This article does not constitute investment advice. Verify all information directly with URA at ura.gov.sg before making any decisions.

Singapore New Home Sales April 2026: URA Data Released as Q2 Rebound Gets Under Way

Singapore New Home Sales April 2026: URA Data Released as Q2 Rebound Gets Under Way

Quick Answer — Singapore Developer Sales April 2026

  • URA released April 2026 monthly developer sales data on 15 May 2026.
  • April was driven by two blockbuster late-month launches: Tengah Garden Residences (~863 units, OCR, ~S$1,700 psf) and Vela Bay (515 units, CCR, ~S$2,886 psf), which together cleared approximately 1,224 units in a single 48-hour launch weekend.
  • Rivelle Tampines EC (572 units) was fully sold out in April — the last EC project in 2026 where buyers could use the Deferred Payment Scheme (DPS) before it was removed on 8 May 2026.
  • Q2 2026 has begun with stronger momentum than Q1 2026’s 1,294-unit total (which was weaker due to a light launch calendar).
  • The declining SORA rate (now ~1.20%, down from peak 3.68%) is improving affordability for new home buyers on floating-rate loans.
  • Key Q2 pipeline still to launch: Lentor Gardens Residences (499 units), and further OCR projects as GLS sites progress.

Singapore’s Urban Redevelopment Authority (URA) released its monthly developer sales statistics for April 2026 on 15 May 2026, and the headline picture is a significant rebound from Q1 2026’s subdued volumes. After a first quarter that recorded just 1,294 new private homes sold excluding executive condominiums — a figure depressed by a deliberately thin launch calendar — April’s late-month double launch of Tengah Garden Residences and Vela Bay changed the narrative.

For buyers, developers, and investors watching Singapore’s new launch market, April 2026 provides several important data points. This article breaks down what the monthly figures show, which projects drove the numbers, what the fully-sold Rivelle Tampines EC tells us about post-cooling-measures demand, and what to expect through the rest of Q2 2026.

1. Q1 2026 in Context: A Quiet Quarter by Design

Before analysing April, it is important to understand why Q1 2026 was so subdued. The 1,294 new private homes sold (excluding ECs) across January to March represented a 60% quarter-on-quarter fall from Q4 2025’s elevated volumes. This was not demand weakness — it reflected a deliberately compressed launch pipeline.

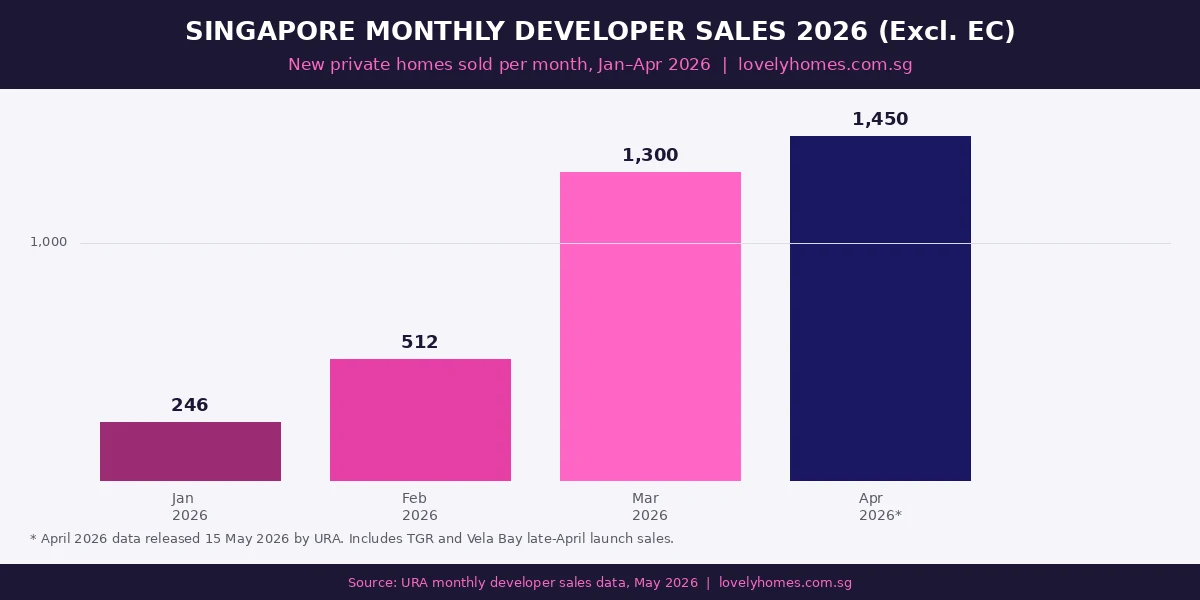
Developers held back launches in early 2026 after the strong 2H 2025 absorption. January saw just 246 units transacted and February approximately 512, both reflecting Lunar New Year seasonality and minimal new launches. March rebounded sharply when Pinery Residences (588 units, 92.3% sold) launched, driving March’s total to approximately 1,300 units — the busiest month of the quarter.
Singapore monthly new private home developer sales Jan-Apr 2026 bar chart
Figure 1: Singapore new private home developer sales by month, January to April 2026. April’s jump reflects the late-month TGR and Vela Bay launches.

2. April’s Headline: The Double Launch Weekend

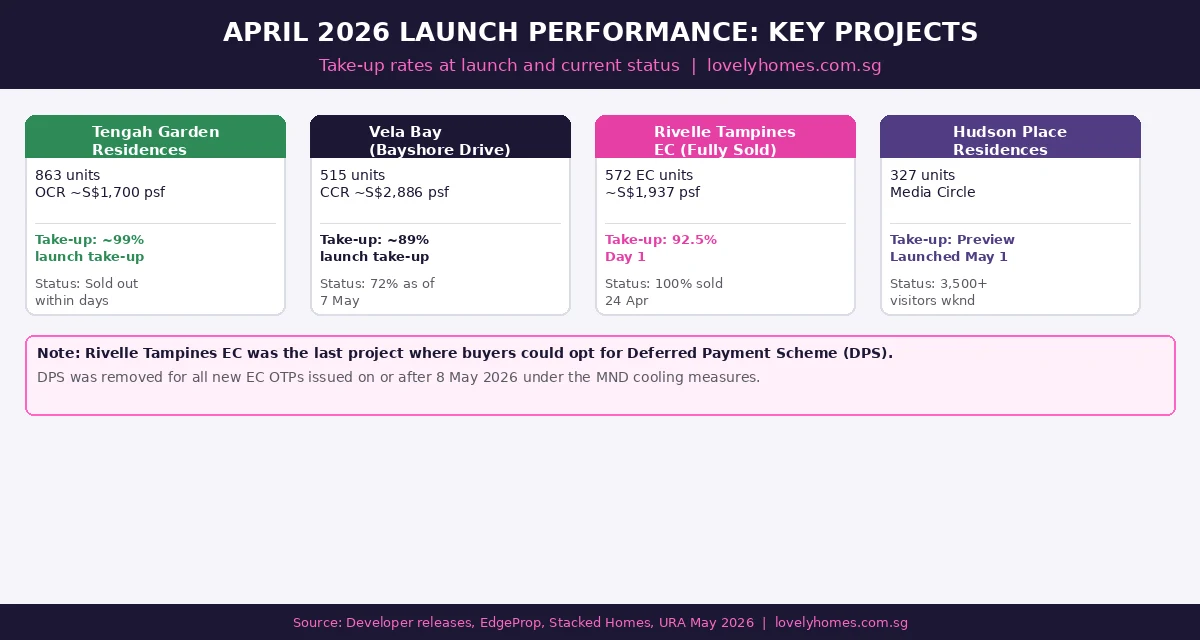
The defining event of April 2026 was a single late-month launch weekend where two major projects went on sale simultaneously — Tengah Garden Residences (TGR) in the Outside Central Region (OCR) and Vela Bay in Bayshore, Core Central Region (CCR). Together, these two projects accounted for approximately 1,378 units and achieved combined take-up of around 89% in 48 hours, representing roughly 1,224 units sold over one weekend.

The performance of these two launches illustrates a key dynamic in Singapore’s 2026 market: quality supply at the right pricing attracts immediate buyer conviction, even at very different price points. TGR’s OCR pricing (~S$1,700 psf) targets HDB upgraders and first-time private buyers; Vela Bay’s CCR pricing (~S$2,886 psf) targets investment-grade buyers, permanent residents, and high-net-worth individuals comfortable with Singapore’s ABSD framework.
Singapore April 2026 new launch project take-up rates Tengah Garden Residences Vela Bay Rivelle Tampines
Figure 2: Key project performance in April 2026 — TGR and Vela Bay drove the late-month surge, while Rivelle Tampines EC cleared its final units.

3. Rivelle Tampines EC: The Last DPS Sale of 2026

Rivelle Tampines, the 572-unit executive condominium at Tampines Street 95 developed by Sim Lian Group, completed its sell-out in April 2026. The project had launched on 21 March 2026 with a spectacular 92.5% Day 1 take-up at a median price of S$1,937 psf — the best EC launch since Hundred Palms Residences in 2017. The remaining units were fully taken up during the second ballot on 24 April 2026.

What makes Rivelle Tampines historically significant is that 87.9% of its buyers opted for the Deferred Payment Scheme (DPS) — and all of those OTPs were issued before 8 May 2026, the date on which the Ministry of National Development announced the removal of DPS for new ECs as part of the EC cooling package.

Under DPS, EC buyers need only pay the down payment and service the loan when they collect their keys (typically 3–4 years later), rather than making progressive payments during construction. The scheme was popular among buyers with existing home loans who did not want to service two mortgages simultaneously. With DPS now gone for all new EC OTPs from 8 May 2026 onwards, Rivelle Tampines buyers were effectively the last cohort to benefit.

For more on the broader EC rule changes that took effect in May 2026, including the doubled Minimum Occupation Period (10 years) and the 90% first-timer allocation, see our Singapore EC Cooling Measures May 2026 guide.

4. What This Means for Q2 2026

April’s data, when viewed alongside March’s strength and the EC sell-out, points to an active Q2 2026 for Singapore’s new launch market. Several observations:

Pricing resilience: The fact that both a S$1,700 psf OCR project and a S$2,886 psf CCR project achieved near-90% launch take-up confirms that buyers across different budgets remain engaged when product quality is there. Singapore’s private home price index rose 0.9% in Q1 2026 (revised up from the initial flash estimate of 0.3%) and the pipeline suggests continued modest appreciation.

EC supply adjustment: With DPS removed and MOP doubled to 10 years, the EC buyer calculus has changed. First-timers still benefit from income-ceiling eligibility and lower entry prices than private condos, but the investment horizon is longer and the payment obligation is heavier without DPS. Near-term EC launches (watch for Canberra Drive and Senja Close tenders when awarded) will test this new demand profile.

SORA tailwind: The 1-month SORA rate’s continued decline to approximately 1.20% (from its 3.68% peak in 2023) means floating-rate home loan payments have fallen meaningfully. A buyer with a S$900,000 floating-rate loan at SORA + 0.80% now pays approximately S$3,960/month versus approximately S$5,300/month at peak SORA — a difference of over S$1,300/month. This affordability improvement is supporting buyer confidence across the market. See our home loan comparison guide for the full 2026 rate picture.

Q2 launch pipeline: Several significant projects remain to launch through June 2026. Lentor Gardens Residences (499 units, RCR) is expected to test OCR/RCR crossover pricing. For a broader view of what is coming in 2026’s new launch pipeline, see our New Launch Condo Pipeline article.

Summary Table: Q1–Q2 2026 Developer Sales at a Glance

Period New Private Homes Sold (excl. EC) Key Driver Context
Jan 2026 ~246 No major launches; LNY season Quiet start to year
Feb 2026 ~512 Pent-up demand, small projects Pre-EC announcement
Mar 2026 ~1,300 Pinery Residences (92.3% Day 1) Strongest Q1 month
Apr 2026 ~1,450* TGR + Vela Bay double launch weekend; Rivelle EC cleared Q2 rebound begins
Q1 2026 Total 1,294 (as at 26 Mar caveat data) Limited launch calendar Down 60% q-o-q; set to revise up with full Mar caveats

* April 2026 figure estimated. Official URA data released 15 May 2026; includes late-April TGR and Vela Bay launch sales.

FAQ: Singapore April 2026 Developer Sales

When does URA release monthly developer sales data?

URA releases monthly developer sales statistics on the 15th of the following month. April 2026 data was therefore published on 15 May 2026. The data includes the number of units launched, sold, and unsold for each development, with prices and units based on Options to Purchase (OTPs) issued by developers. The URA e-Service portal (eservice.ura.gov.sg) provides the full data table.

Why was Q1 2026 new home sales so low?

Q1 2026’s 1,294 new private homes sold (excluding ECs) represented a 60% fall from Q4 2025’s elevated levels, but this primarily reflected a thin launch calendar rather than a demand collapse. Developers launched fewer developments in Q1 2026, with only six projects (including two ECs) coming to market. When projects did launch — particularly Pinery Residences in March — they achieved very high take-up rates (92.3% for Pinery), confirming strong underlying buyer demand.

What is Tengah Garden Residences and who is it for?

Tengah Garden Residences (TGR) is an OCR condominium in Tengah, Singapore’s newest housing district in the western region. The project offers approximately 863 units at an indicative price of around S$1,700 psf — competitive for a new OCR launch with direct access to the Tengah Town Centre MRT (Jurong Regional Line) when completed. TGR targets HDB upgraders, first-time private property buyers, and investors seeking yield at OCR price points. It is NOT an EC, so Singapore PRs and foreigners are also eligible to purchase (subject to ABSD).

Can Rivelle Tampines EC buyers still use DPS?

Yes — buyers who received their OTP from Rivelle Tampines before 8 May 2026 are entitled to retain the Deferred Payment Scheme (DPS) arrangements they agreed to. The MND’s announcement removing DPS for ECs applies only to OTPs issued on or after 8 May 2026. Since all Rivelle Tampines units had OTPs issued before that date (the last units were sold on 24 April), those buyers are grandfathered under the old rules.

What EC projects are coming next after Rivelle Tampines?

Singapore’s EC pipeline for the remainder of 2026 and into 2027 includes sites that have been tendered or are awaiting tender under the 1H 2026 GLS programme. Key upcoming EC sites include Canberra Drive and Senja Close. These projects will launch under the new EC framework (10-year MOP, 90% first-timer allocation, no DPS), so their sales performance will be the first real-world test of buyer appetite for the revised rules.

Related Articles

Disclaimer

This article is based on URA monthly developer sales data released on 15 May 2026, supplementary reporting from industry sources, and developer announcements. Sales figures for April 2026 include estimates and approximations where official caveat data may not yet be fully lodged. Always verify the most current figures at the URA Property Market Information portal. This is not investment advice. Consult a licensed financial adviser or property consultant before making any property purchase decision.
HDB Resale Market Q1 2026: Prices Fall 0.6% in First Decline Since 2019

HDB Resale Market Q1 2026: Prices Fall 0.6% in First Decline Since 2019

HDB Resale Market Q1 2026: Prices Fall 0.6% in First Decline Since 2019

Quick Answer

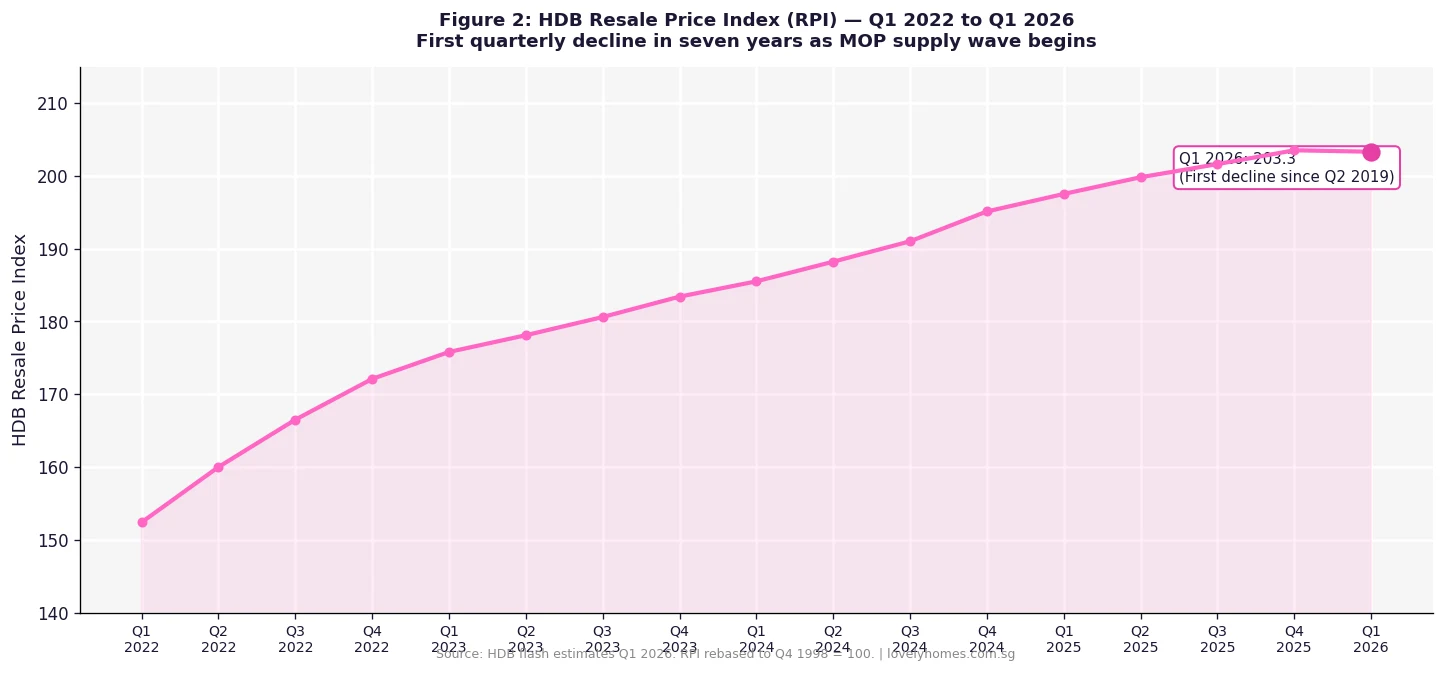
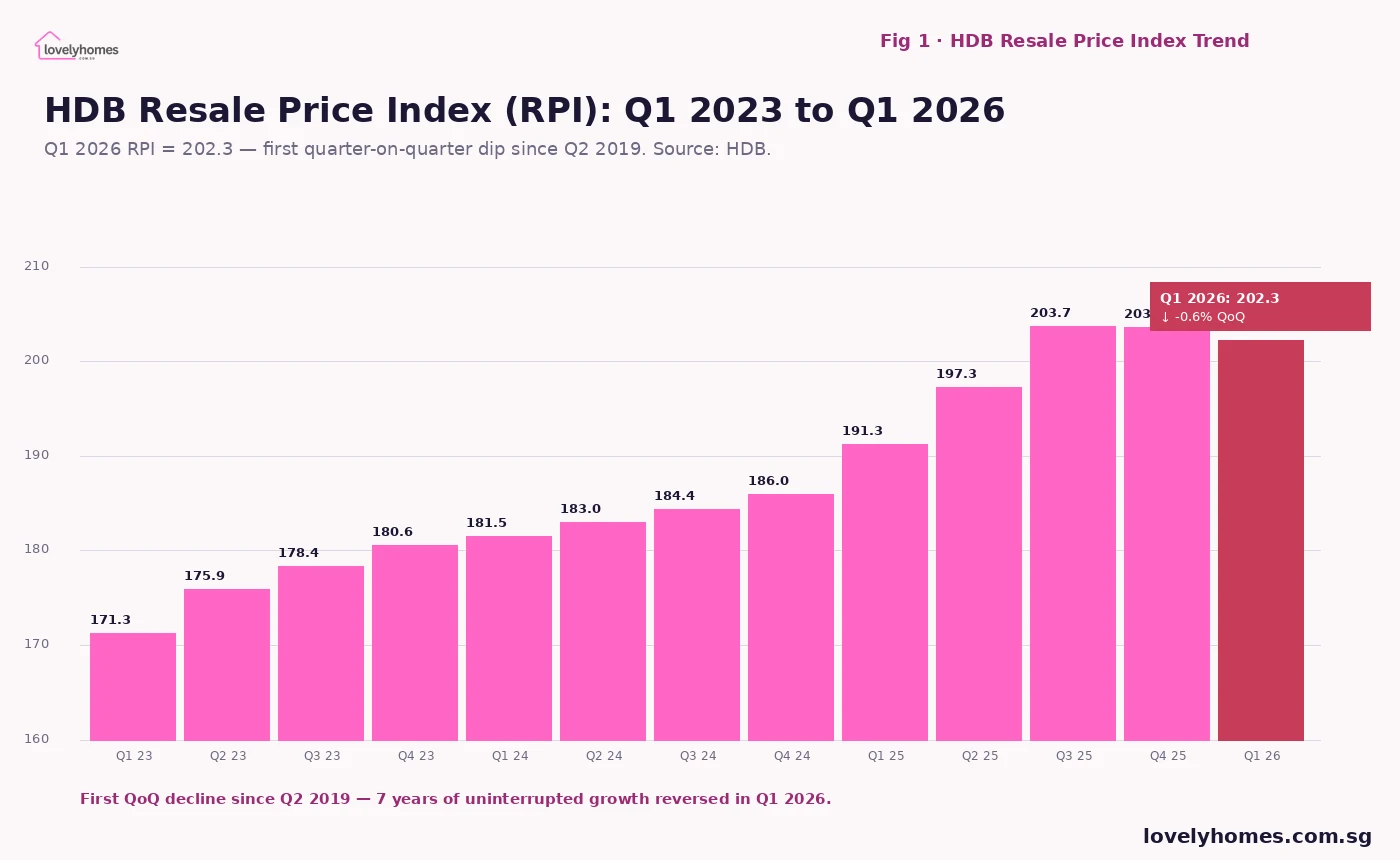
  • The HDB Resale Price Index (RPI) fell 0.6% quarter-on-quarter in Q1 2026, from 203.6 in Q4 2025 to 202.3 — the first decline since Q2 2019.
  • The dip breaks a 27-quarter streak of flat or rising resale prices, signalling early-stage market cooling after years of post-pandemic appreciation.
  • Transaction volumes were 6,107 resale flats in Q1 2026, broadly in line with Q4 2025 levels — the price softening is driven by supply rather than a demand collapse.
  • The MOP supply wave — 13,480 HDB flats reaching their 5-year Minimum Occupation Period in 2026 — is the structural factor adding resale supply.
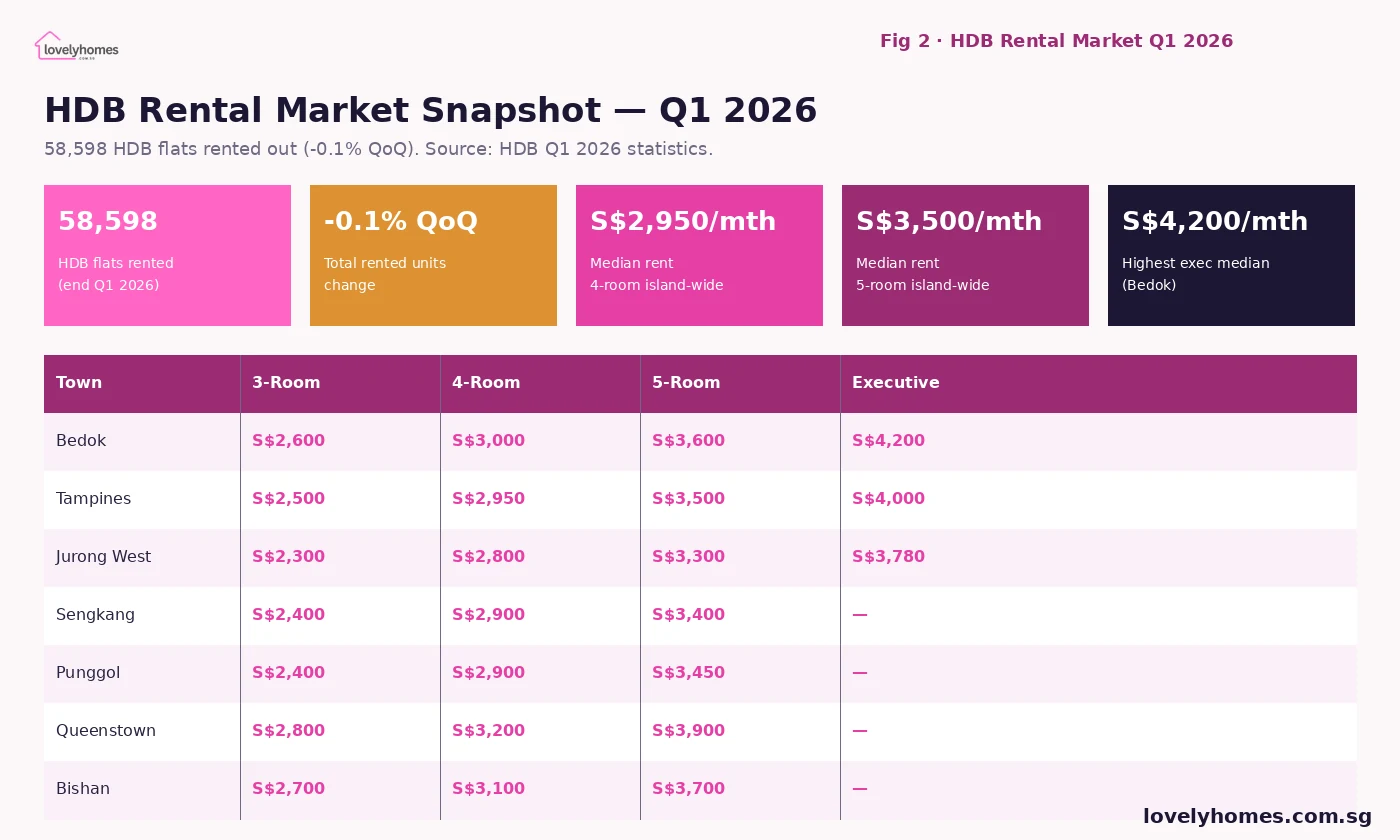
  • HDB rents held relatively steady: 58,598 flats rented at end-Q1, with median rents ranging from S$2,300 (3-room Jurong West) to S$4,200/mth (executive Bedok).
  • Million-dollar resale transactions continued to feature, with a new record of S$1.728M at City Vue @ Henderson (Henderson Road, April 2026).
  • Analysts describe the trajectory as a “soft landing” — the price dip is small and unlikely to accelerate sharply unless interest rates rise again or unemployment climbs.

What the Q1 2026 HDB Resale Data Shows

HDB released its 1st Quarter 2026 Public Housing Statistics on 25 April 2026, revealing that the Resale Price Index — the primary measure of HDB resale flat price movements — dipped 0.6% quarter-on-quarter to 202.3. This ends a remarkable run: from Q3 2019 through Q4 2025, the RPI rose or held flat in every single quarter, a 27-quarter streak fuelled first by the pandemic-era demand surge (2020–2022), then by the post-pandemic upgrader wave and tight resale supply (2023–2024), then by continued above-median-income household demand (2025).

The 0.6% dip is modest in absolute terms — the RPI remains 18% above its Q1 2023 level — but its direction is significant. It confirms what market practitioners have been observing since late 2025: sellers are taking longer to find buyers, price gaps between asking and transacted prices have widened, and the buyer pool is showing greater selectivity.

HDB Resale Price Index quarterly trend Q1 2023 to Q1 2026 bar chart
Figure 1: HDB Resale Price Index (RPI) from Q1 2023 to Q1 2026. Q1 2026 marks the first quarter-on-quarter decline since 2019. Source: HDB.

Why Prices Dipped: The MOP Supply Effect

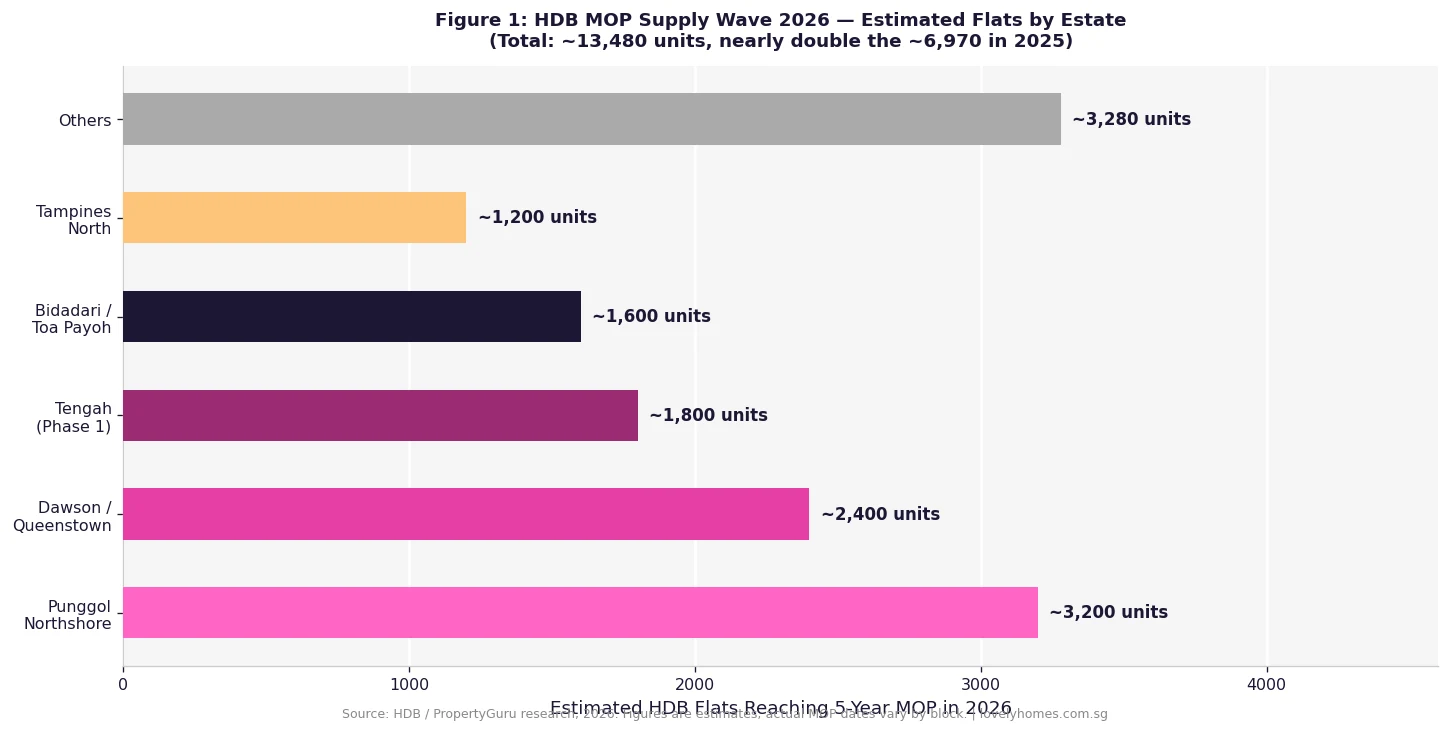
The primary explanation for the price softening is straightforward: supply. As LovelyHomes reported in May 2026, approximately 13,480 HDB flats are reaching their 5-year Minimum Occupation Period (MOP) in 2026, up 93% year-on-year from the approximately 6,980 that crossed MOP in 2025. This is partly a consequence of the BTO surge years of 2016–2018, when HDB completed large volumes of units in towns including Punggol (est. 3,200 MOP units), Sengkang (est. 2,400), Tengah (est. 1,900), and Bidadari (est. 1,800).

As these flat owners become eligible to sell on the open market, many are choosing to do so — either to capture appreciation gains, to upgrade to private property, or to rightsize. The resulting increase in resale listings gives buyers more choice and more negotiating room, which compresses prices at the margin.

A structural supply increase of this magnitude does not typically reverse quickly. The MOP pipeline into 2027 remains elevated, meaning the resale supply overhang is likely to persist through much of 2026 and into 2027. This is not a liquidity crisis or a demand collapse — transaction volumes remain healthy — but it is a period where sellers who need to move quickly will likely accept modest discounts to achieve a timely sale.

Transaction Volume: Stable, Not Falling

Notably, the price dip in Q1 2026 was not accompanied by a volume collapse. HDB reported approximately 6,107 resale transactions in Q1 2026, broadly in line with the approximately 6,200 recorded in Q4 2025. This is an important distinction: a falling price index alongside stable volume suggests a price-discovery adjustment driven by supply rather than a demand retreat. When markets fall on low volume, it often signals more serious stress; when they adjust modestly on normal volume, it is more consistent with a soft landing.

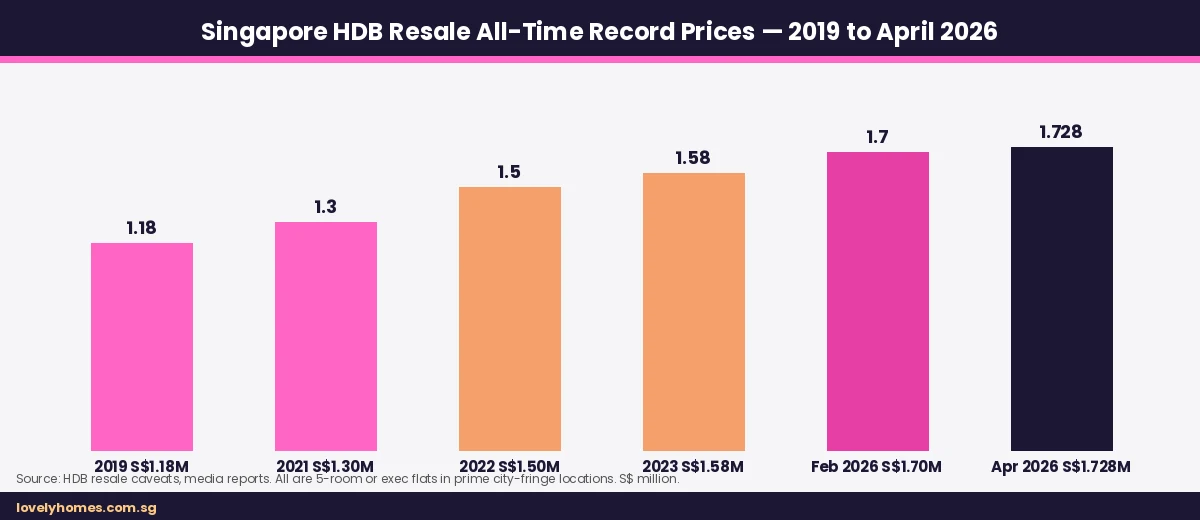
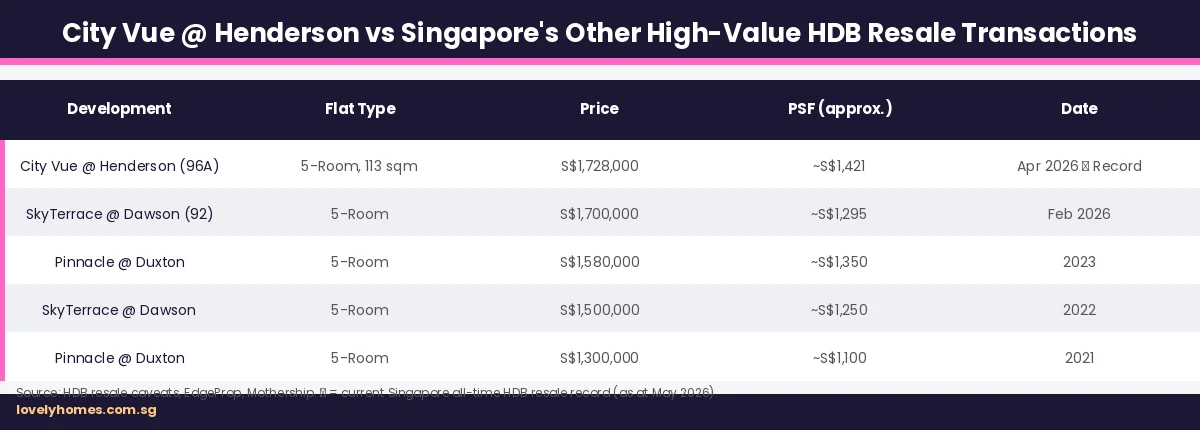
Million-dollar resale flats continued to transact. There were 165 million-dollar HDB transactions in Q1 2026, slightly below the 188 recorded in Q4 2025 but still historically elevated. The most expensive transaction in recent months was a 5-room flat at City Vue @ Henderson (Henderson Road) that transacted at S$1,728,000 in April 2026 — a new island-wide record, surpassing the previous S$1.7M record at SkyTerrace @ Dawson (February 2026).

The Rental Market: Holding Steady

HDB’s Q1 2026 data also covered the rental sub-market. As at end of March 2026, there were 58,598 HDB flats rented out on the open market — down marginally (-0.1%) from the 58,775 rented at end of Q4 2025. The occupancy rental market has broadly plateaued after the 2022–2023 surge, reflecting a more balanced supply-demand dynamic at current rent levels.

HDB rental market Q1 2026 median rent by town flat type Singapore
Figure 2: HDB rental market snapshot Q1 2026 — total units rented, and median monthly rent by town and flat type. Source: HDB.

Median monthly rents by flat type as at Q1 2026:

Flat Type Median Rent (Island-wide) Highest Town (Est.) Lowest Town (Est.)
3-Room S$2,450/mth Queenstown ~S$2,800 Jurong West ~S$2,300
4-Room S$2,950/mth Queenstown ~S$3,200 Jurong West ~S$2,800
5-Room S$3,500/mth Bishan ~S$3,700 Jurong West ~S$3,300
Executive S$3,900/mth Bedok ~S$4,200 Jurong West ~S$3,780

Worked Example: Seller Navigating the Q1 2026 Market

Consider Ms Chen, a 48-year-old SC who bought a 5-room flat in Punggol in 2021 at S$640,000. Her flat crossed MOP in March 2026. She lists it at S$820,000 based on comparable transaction data from late 2025. By April 2026, the market has softened: similar units in her block are closing at S$795,000–S$805,000. After 6 weeks on market, she accepts S$800,000 — S$20,000 below her initial ask.

At S$800,000, her net proceeds (after clearing the HDB loan balance of S$180,000, CPF refund of S$195,000 including accrued interest, agent commission of S$16,000 at 2%, and legal fees of S$2,500) amount to approximately S$406,500 in cash. This provides her a meaningful deposit for a private condo purchase — the upgrade path that many MOP sellers are pursuing in parallel. The soft landing means she sells at a price below peak 2025 expectations, but still at a substantial premium to her 2021 purchase price.

What Analysts Expect Next

The consensus view among Singapore property researchers as at May 2026 is that the HDB resale market is experiencing a controlled correction rather than a structural downturn. The structural demand drivers — strong household formation, the HDB upgrader pipeline, and the EIP limiting cross-ethnic resale substitution — remain intact. What has changed is the supply side: the 2026 MOP wave adds meaningful listings, and the EC cooling measures introduced on 8 May 2026 (10-year MOP for ECs, removal of Deferred Payment Scheme) are expected to redirect some upgrader demand back toward the resale HDB market as ECs become less attractive for near-term upgraders.

For the full year 2026, many analysts project HDB resale prices to be flat to -1.5% year-on-year — a modest correction rather than a collapse. A steeper correction would require either a significant rise in unemployment (reducing buying capacity) or a sharp increase in interest rates (increasing mortgage costs). Neither scenario appears imminent as at May 2026.

Frequently Asked Questions

Does the 0.6% price dip mean it’s a buyer’s market?

In relative terms, yes — buyers have more negotiating power than they did in 2024 or early 2025. Sellers are taking longer to close deals, and offer-to-transacted-price gaps have widened. However, “buyer’s market” should be contextualised: the overall price level remains historically elevated, and well-located flats in mature estates with strong lease remaining still transact with multiple offers. The softening is most visible in OCR peripheral towns with high MOP supply (Punggol, Sengkang, Tengah) and least visible in established mature estates (Bishan, Toa Payoh, Queenstown, Bukit Timah).

Should I sell my MOP flat now or wait?

This is a personal financial decision that depends on your specific situation — remaining loan quantum, CPF accrued interest, upgrade target, and personal timeline. As a general observation, the supply wave is expected to persist through 2026 and into 2027, meaning if you are not urgently selling, waiting for a Q4 2026 or 2027 window may not materially improve your position. If you plan to upgrade to private property and are concerned about private prices rising faster than HDB prices stabilise, acting sooner may make strategic sense. This should be discussed with a licensed financial adviser and property agent.

How does the MOP supply wave affect HDB rental demand?

As MOP sellers transition to private property or other housing arrangements, some opt to rent out their HDB flat rather than sell, particularly if they can achieve strong rental yields. This adds to the HDB rental supply pool. Simultaneously, new private condo residents who owned the HDB flat they were renting out before upgrading may exit the rental market. The net effect on rental supply is modest and likely balanced; however, specific towns with very high MOP supply (Punggol, Tengah) may see softer rents as more units come onto the rental market in 2026.

Are million-dollar HDB flats still transacting?

Yes. The million-dollar threshold was crossed 165 times in Q1 2026, and the April 2026 record of S$1.728M at City Vue @ Henderson confirms that ultra-premium resale transactions are still occurring. However, the pace of million-dollar transactions appears to be stabilising relative to the 2025 highs. These transactions are concentrated in specific locations: DBSS developments, mature estate point blocks with exceptional views, and flats with very long lease remaining in prime districts. They are the exception rather than the norm.

What is the HDB resale market outlook for H2 2026?

The outlook is cautiously stable with a soft-landing bias. The MOP supply wave will continue adding listings through the year. EC cooling measures (10-year MOP) may modestly redirect some demand to the resale segment. Interest rates, while elevated versus pre-2022 levels, have stabilised. Private-to-HDB downgraders remain limited in number. Most analysts project full-year 2026 HDB resale prices to be flat to slightly negative (-0% to -1.5%), with transaction volumes holding in the 25,000–27,000 range for the full year.

Related Articles


Disclaimer: This article is based on HDB’s 1st Quarter 2026 Public Housing Statistics and publicly available market data. All figures are for general informational purposes only. Rental median figures for individual towns are estimates based on approved applications and may differ from actual advertised rents. This is not financial or investment advice. For decisions relating to HDB resale purchase or sale, consult a licensed property agent (CEA-registered) and a licensed financial adviser. Official data is available at hdb.gov.sg and ura.gov.sg.

HDB Ethnic Integration Policy Singapore 2026: Block Quotas, Neighbourhood Limits and SPR Rules Explained

HDB Ethnic Integration Policy Singapore 2026: Block Quotas, Neighbourhood Limits and SPR Rules Explained

HDB Ethnic Integration Policy Singapore 2026: Block Quotas, Neighbourhood Limits and SPR Rules Explained

Quick Answer

  • The HDB Ethnic Integration Policy (EIP) caps the proportion of each ethnic group allowed in an HDB block and neighbourhood to promote racial harmony.
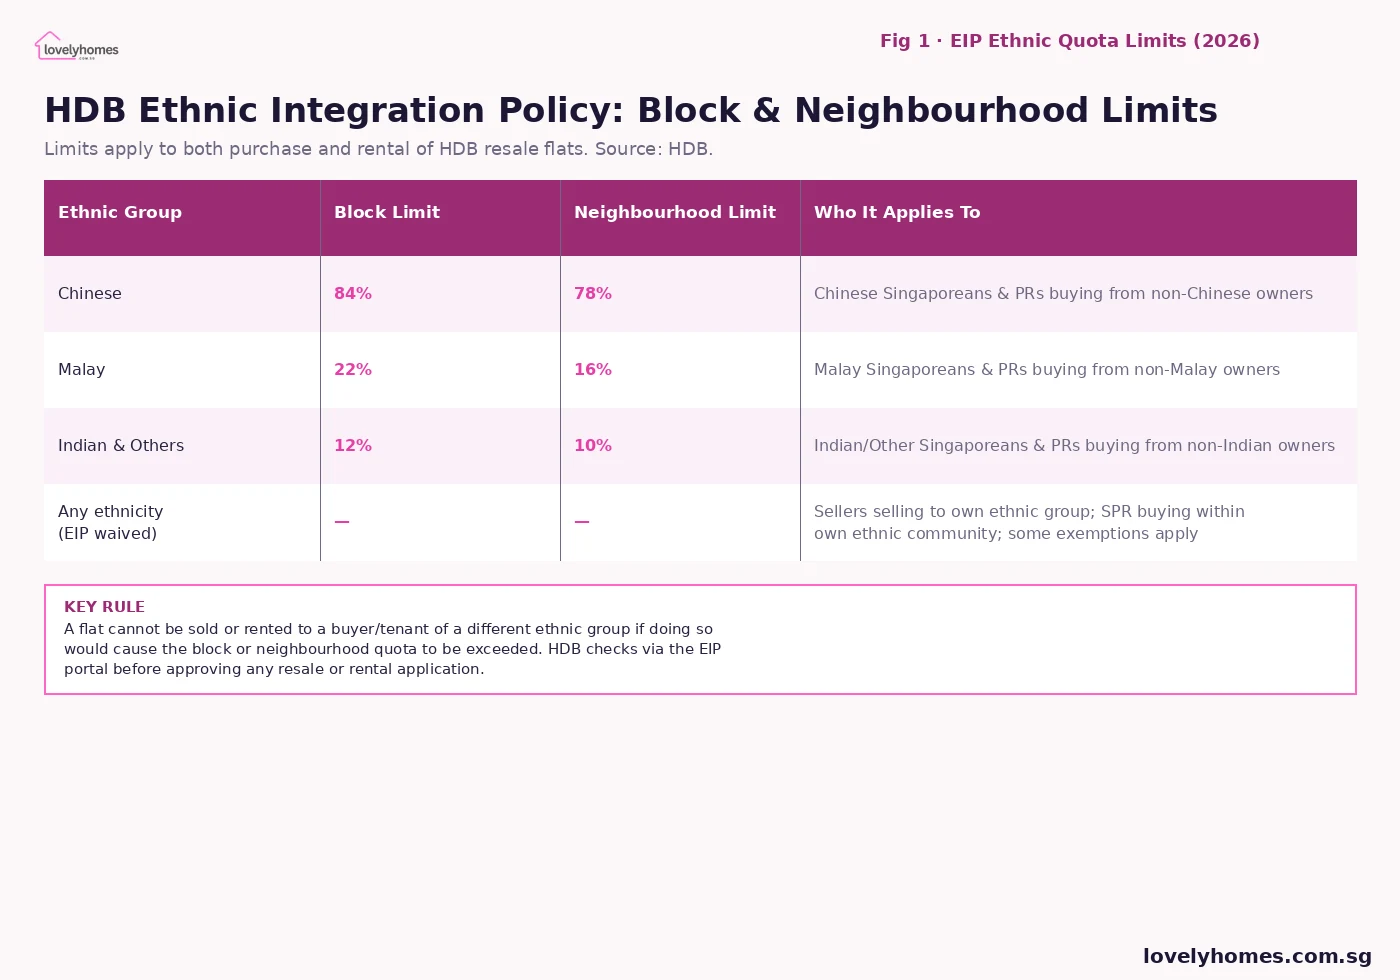
  • Chinese buyers face a 84% block / 78% neighbourhood limit; Malay buyers 22% block / 16% neighbourhood; Indian and Others 12% block / 10% neighbourhood.
  • If a block or neighbourhood has already hit its ethnic quota for your group, you cannot buy that flat — regardless of price or seller agreement.
  • Singapore Permanent Residents (SPRs) count under their registered race and face an additional 8% SPR community cap per block.
  • The EIP applies to HDB resale flat purchases and rentals of whole units; it does not apply to BTO sales or commercial premises.
  • Sellers who sell to a buyer of the same ethnic group are exempt from the quota check.
  • Check any block’s EIP headroom for free at hdb.gov.sg → e-Services → EIP / SPR Enquiry before making an offer.
  • Violations are not fined but rather the HDB application is simply rejected — the buyer must find a different flat.

What Is the Ethnic Integration Policy?

The Ethnic Integration Policy, commonly abbreviated EIP, is a Government-administered quota system that controls the ethnic composition of HDB resale flats at the level of individual blocks and planning neighbourhood areas. It was introduced in 1989 by the Ministry of National Development (MND) and administered by the Housing & Development Board (HDB) with the explicit goal of preventing ethnic enclaves from forming in public housing estates.

Before the EIP existed, certain blocks and estates had become almost entirely monoethnic — a legacy of voluntary clustering and the earlier resettle-and-rehouse programmes of the 1960s–70s. The Government concluded that such enclaves risked weakening the inter-racial bonds that Singapore depends on for social cohesion, and the EIP was the structural remedy: no block or neighbourhood may exceed defined ethnic proportions, measured as a share of total residential units.

The policy is purely demand-side. It does not tell sellers whom they may approach or what price to charge; it simply means that HDB will only approve the resale transaction if the buyer’s ethnic group is still within quota in the block and neighbourhood in question. If the quota is full for that group, the application is declined — and the flat remains on the market until a buyer from an under-quota group steps in, or until the overall block mix shifts as other owners move out.

HDB EIP ethnic quota limits block neighbourhood Singapore 2026 table
Figure 1: HDB Ethnic Integration Policy block and neighbourhood quota limits (2026). Source: HDB.

The Quota Numbers: Block vs Neighbourhood

HDB measures EIP compliance at two geographic levels, and both must be within limit for a transaction to proceed. A buyer’s application will be rejected if either the block quota or the neighbourhood quota is breached — even if only one is at the ceiling.

As at 2026, the limits are:

Ethnic Group Block Limit Neighbourhood Limit Rationale
Chinese 84% 78% Reflects Chinese share of Singapore population (~74% SC + SPR combined)
Malay 22% 16% Malay population ~13%; buffer above national share to allow normal movement
Indian & Others 12% 10% Indian population ~9%; others ~4%; combined buffer limit
Same-group sale Exempt Exempt Selling to own ethnic group does not affect the quota; no check required

Neighbourhoods in HDB terminology typically correspond to HDB town or planning zones within a town — for instance, Tampines as a neighbourhood encompasses multiple blocks. A block hitting 84% Chinese while the neighbourhood sits at 70% is still blocked (the block ceiling is breached). Both must clear simultaneously.

Who the EIP Applies To — and Who It Does Not

The EIP applies to every resale HDB flat transaction where the buyer and seller are of different ethnic groups. This covers the vast majority of open-market resale transactions. The following categories are exempt from the quota check:

  • Sales where the buyer and seller share the same registered ethnic group (the most common exemption).
  • HDB BTO (Build-To-Order) flat sales — the EIP only applies to the resale market, not new flat allocations from HDB.
  • Transfers within immediate family (inheritance, gifts, adding or removing a co-owner on the same flat) — these are not resale transactions.
  • Short-term room rentals (renting out individual bedrooms, not the whole flat) — the EIP does not restrict room rental.

The EIP does apply to the rental of entire flats to tenants of a different ethnic group. A landlord must verify that approving a new tenant would not cause the block or neighbourhood quota to be exceeded before submitting the rental application to HDB.

How SPRs Are Treated Under the EIP

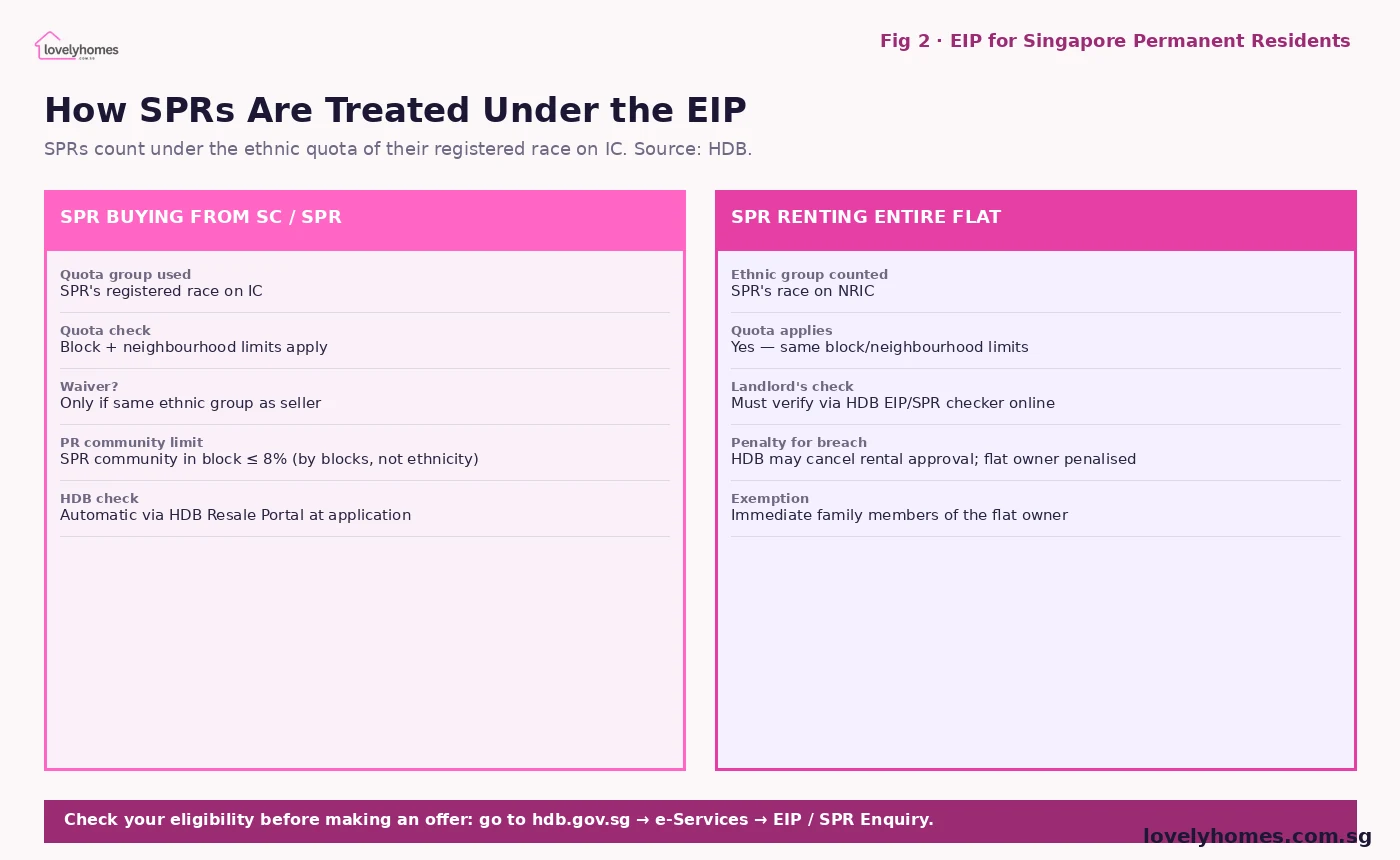
Singapore Permanent Residents are counted under their registered race as it appears on their NRIC or Re-entry Permit. A Malaysian-Chinese SPR counts as Chinese; a Malaysian-Indian SPR counts as Indian. SPRs have no special exemption from the ethnic quota — they are subject to the same block and neighbourhood limits as Singapore Citizens of the same ethnic group.

In addition to the standard ethnic quota, HDB imposes a separate SPR community cap of 8% per block. This means that even if the ethnic quota for a particular group has headroom, the transaction will still be rejected if the proportion of SPR households in the block has already reached 8%. The 8% cap is computed across all ethnicities combined — it is not per-ethnicity.

HDB EIP SPR Singapore permanent resident ethnic integration policy 2026
Figure 2: How SPRs are counted under the EIP — block limits and the 8% SPR community cap. Source: HDB.

How to Check the EIP Before Making an Offer

HDB provides a free online tool — the EIP / SPR Enquiry — accessible via the HDB website’s e-Services portal. Any member of the public can enter a block number and street name to see the current EIP status for all three ethnic groups and the SPR community quota. The tool shows whether the block and neighbourhood are within limit, at limit, or exceeding the limit for each group.

This check is essential for buyers and their property agents to conduct before submitting an Offer to Purchase or Option to Purchase, because:

  • Once an OTP is exercised and the buyer has paid the 1% option fee and 4% exercise consideration (totalling 5% of purchase price), the buyer has contractual obligations to proceed. Discovering an EIP block only after this stage causes financial loss.
  • Real estate agents have a professional obligation under the CEA Code of Ethics to verify EIP status before advising clients to submit an offer on a flat.
  • HDB’s Resale Portal will flag an EIP breach at the point of HDB application, but this is after OTP exercise and typically 2–3 weeks into the process.

As a rule of thumb, run the EIP check as the very first step — before viewing arrangements, before price negotiations, and certainly before signing any document.

What Happens When a Block Is at Quota?

A block “at quota” means the current proportion of flats occupied by that ethnic group has reached or exceeded the ceiling. In practice, blocks rarely sit exactly at 84% or 22% — the numbers shift continuously as owners move out and in. A block that is at quota today may have a vacancy next month when a household of the same ethnic group moves out.

For buyers who find their preferred flat in a quota-full block, the realistic options are:

  • Search for comparable flats in the same estate or town where the block still has headroom for their ethnic group.
  • If the seller is of the same ethnic group as the buyer, the transaction is exempt from the quota check — this is the most direct route if matching-group sellers exist in the block.
  • Wait — quota positions change over time, though this is rarely a practical strategy when the buyer has a fixed moving timeline.

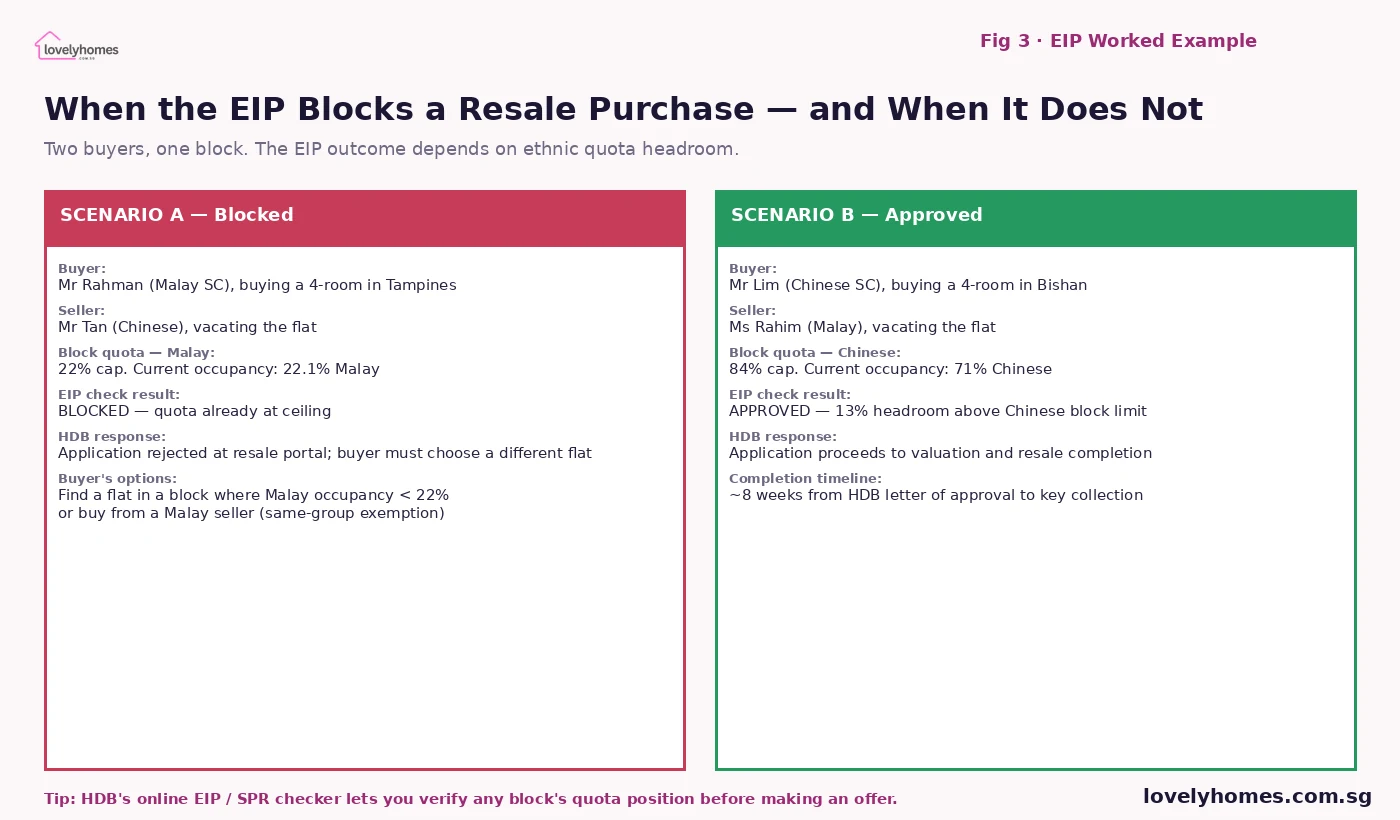
Worked Example: EIP in Action

HDB ethnic integration policy worked example resale purchase blocked approved 2026
Figure 3: Two real-world EIP scenarios — one blocked, one approved — in the HDB resale market.

Scenario A — Blocked Purchase

Mr Rahman is a Malay Singapore Citizen looking to buy a 4-room flat in Tampines from Mr Tan (Chinese). He finds a well-priced unit, negotiates terms, and is about to exercise the OTP when his property agent runs the EIP check. The block has 22.1% Malay occupancy — just above the 22% ceiling. HDB’s system would reject the application. Mr Rahman’s options: find a different flat in a block with Malay headroom, or seek a seller who is Malay (same-group, exempt from quota).

Scenario B — Approved Purchase

Ms Lim is a Chinese SC buying from Ms Rahim (Malay) in Bishan. The block has 71% Chinese occupancy — 13 percentage points below the 84% ceiling. The neighbourhood Chinese occupancy is 65% — 13 points below the 78% ceiling. Both checks pass. HDB approves the application, and the parties proceed to completion, typically 8 weeks from HDB’s letter of approval to key collection.

Historical Context: Why Singapore Chose a Quota System

The EIP has its roots in the 1964 race riots and the post-separation social engineering that characterised Singapore’s early decades. By the late 1980s, data showed that voluntary ethnic clustering in HDB estates had resumed — not at pre-independence levels, but enough to alarm planners concerned about long-term social cohesion. The Government concluded that without a structural mechanism, market forces would gradually re-segregate the housing stock even within the same HDB town.

Critics of the EIP — including some academics and civil society commentators — have argued that it can trap Malay and Indian sellers in blocks that have reached quota, forcing them to sell to buyers of the same ethnicity (often a smaller pool) at potentially lower prices. HDB has acknowledged these concerns in occasional policy reviews but has maintained that the social stability benefits outweigh the market distortions. The quotas have been adjusted several times since 1989; the current figures were last revised in 2010.

What This Means for Buyers and Investors

For buyers, the EIP is a hard constraint that must be baked into property search strategy. It is not a legal technicality to be negotiated around — HDB’s system enforces it automatically at the application stage. Missing this check is one of the most avoidable sources of OTP-related financial loss.

For property investors holding resale HDB flats as rental assets, the EIP also caps the pool of permissible tenants (whole-unit rentals are quota-subject), which can slow leasing in tight-quota blocks. Savvy investors check the EIP status of a block not just when buying but periodically during holding — a block drifting towards quota limits the exit pool too.

What Might Come Next

Periodic academic discussions have raised the question of whether the EIP thresholds should be adjusted to better reflect Singapore’s current demographic composition — the 2020 census showed the Chinese share of the resident population had declined slightly to around 74% while the Malay and Indian shares held broadly steady. The current 84% Chinese block ceiling was last revised in 2010 and arguably has more room than needed for the Chinese community. A recalibration could give Malay and Indian buyers slightly more flexibility at the margin.

There is also ongoing discussion about whether a digital, real-time EIP dashboard — beyond the current per-block lookup tool — could be integrated into property listing platforms to surface quota status directly alongside price and size. This would reduce the risk of buyers only discovering quota blocks during the due diligence phase.

Frequently Asked Questions

Can a seller refuse to sell to a buyer of a different ethnicity to avoid the EIP?

Technically, private negotiations are between buyer and seller and a seller may choose not to accept any offer for any reason. However, in practice, sellers list broadly and are simply informed by their agents that an OTP to a buyer whose ethnic group is at quota in that block will not be approved by HDB — so neither party wastes time pursuing a transaction that will fail at the HDB portal stage. The EIP is not a discrimination right; it is an administrative approval gate.

Does the EIP apply when I buy from my own ethnic group?

No. The quota check is only triggered when the buyer’s ethnic group differs from the seller’s. If a Chinese buyer buys from a Chinese seller, no EIP check applies, and the transaction proceeds as long as all other HDB eligibility criteria are met. Same-group transactions cannot cause the quota to rise because the total count of that ethnic group in the block remains unchanged (one household out, one in).

What is the SPR community cap and how does it interact with the ethnic quota?

The SPR community cap is an 8% limit on the proportion of all SPR households (of any ethnicity combined) in any single HDB block. It operates independently of the ethnic quota. This means a Malay SPR purchasing a flat in a block that is within the Malay ethnic quota could still be rejected if the block’s SPR community proportion is at or above 8%. Both the ethnic quota and the SPR community cap must be within limits for the application to succeed.

Does the EIP affect new BTO flat applications?

No. BTO flats are allocated by HDB via the ballot system, and EIP quotas do not apply to new flat sales. The EIP is solely a resale-market mechanism. When BTO flat owners later wish to sell on the open resale market (typically after the 5-year Minimum Occupation Period), the EIP will apply to the new buyer at that point in time.

What if I am of mixed ethnicity — which quota applies to me?

HDB uses the ethnic group as it appears on your Singapore identity documents (NRIC). For persons of mixed heritage, this is typically the ethnic group that was registered at birth under the Registration of Births and Deaths Act. You cannot choose which quota applies to you based on your heritage alone — the NRIC ethnic group is what counts. If you believe your registered ethnicity is incorrect, you would need to approach ICA (Immigration and Checkpoints Authority) to rectify this separately.

Can a landlord rent to any tenant regardless of EIP?

No. When a landlord rents out a whole HDB flat to tenants of a different ethnic group, HDB checks the EIP and SPR community cap at the time of the rental application. If approving the tenancy would breach the quota, HDB will not approve the rental. Landlords are responsible for checking before entering into a tenancy agreement. Renting out individual rooms (not the entire flat) is not subject to the EIP.

How often do blocks hit their quota ceiling?

There is no published aggregate figure from HDB on how many blocks are at quota at any given time, but industry practitioners report that certain mature estates (Bishan, Toa Payoh, Queenstown) with older Chinese-majority compositions can periodically see Chinese quotas at the ceiling in particular blocks. Malay-majority blocks in towns like Bedok, Tampines, or Geylang may reach the Malay ceiling in some sub-blocks. It varies significantly by block and by time of year. The online EIP checker is the authoritative real-time source.

Related Articles


Disclaimer: This article is for general informational purposes only and does not constitute legal, financial, or property advice. EIP limits are set by HDB and may be revised. Always verify the current quota position using HDB’s official EIP / SPR Enquiry tool at hdb.gov.sg before making any offer on a resale flat. For advice specific to your circumstances, consult a licensed property agent registered with the Council for Estate Agencies (CEA) or a qualified property lawyer.

Singapore Property as a Safe Haven in 2026: What the URA Data Shows Amid Global Uncertainty

Singapore Property as a Safe Haven in 2026: What the URA Data Shows Amid Global Uncertainty

As trade tensions, currency volatility and geopolitical fractures reshape capital allocation globally, Singapore’s residential property market is drawing renewed attention from high-net-worth investors. This analysis examines what the data actually shows — and what it does not.

Quick Answer

  • Singapore’s private residential price index rose 0.3% quarter-on-quarter in Q1 2026, per URA flash estimates, with the OCR leading at +1.3% — a measured performance that belies the “booming market” narrative in some international headlines.
  • The CCR (Core Central Region) — the segment most exposed to foreign UHNW demand — has appreciated modestly but steadily since Q1 2024, driven by wealth-preservation flows from Europe, the Middle East and Southeast Asia.
  • Singapore’s 65% ABSD for foreign buyers, introduced in April 2023, has not reversed this structural demand — it has filtered out speculative short-term buyers while leaving long-horizon wealth-preservation purchasers largely undeterred.
  • The Asia-Pacific UHNW population grew by approximately 24.8% between 2021 and 2026, generating a larger pool of potential buyers even at elevated ABSD rates.
  • Singapore’s macroeconomic fundamentals — GDP growth forecast 2–4% in 2026, inflation ~1–2%, MAS-managed SGD, AAA sovereign credit — underpin the safe-haven thesis more than any single property market metric.
  • Key risks: rising private housing completions in 2026–2027, softening HDB resale prices, and TDSR constraints limiting domestic upgrader demand.

The Global Context: Why Investors Are Looking at Singapore

In the first quarter of 2026, global financial markets contended with renewed trade tensions, a volatile US dollar and a broader reassessment of risk assets in key emerging-market economies. Against this backdrop, Singapore has attracted significant commentary as a potential beneficiary of capital-flight demand.

Singapore offers a stable rule-of-law jurisdiction under the Singapore Land Authority and the Urban Redevelopment Authority; transparent property transaction records through the URA’s caveat system; a currency managed by MAS under a nominal effective exchange rate framework that has historically appreciated against peer currencies during risk-off periods; and a property market with deep liquidity in the resale condominium segment.

What Singapore does not offer — and this is the corrective that international analysis sometimes omits — is a low-friction entry for foreign buyers. The 65% ABSD on any residential property purchased by a non-Singapore national (excluding US/Iceland/Liechtenstein/Norway/Swiss nationals who receive SC-equivalent rates under FTA arrangements) means the effective purchase premium is extraordinary. A S$5M CCR condominium purchased by a foreign buyer carries an ABSD bill of S$3.25M, bringing total acquisition cost to approximately S$8.43M. That is the price of safe-haven status in Singapore.

URA private residential price index CCR RCR OCR Q1 2024 to Q1 2026
Figure 1: URA Private Residential Price Index — CCR, RCR and OCR sub-markets, Q1 2024 to Q1 2026. Source: URA pr26-31.

What the URA Data Actually Shows

URA’s Q1 2026 release (pr26-31, 25 April 2026) reported an overall private residential price increase of 0.3% q-o-q, down from 0.6% in Q4 2025. The sub-regional breakdown: OCR +1.3% (domestic upgrader and new-launch driven); RCR +0.9% (mid-tier, mix of domestic and regional demand); CCR +0.4% (internationally exposed, softest performer). Transaction volume softened to ~4,041 caveats in Q1 2026, 39.7% below Q4 2025’s 6,699 — a seasonal correction amplified by Chinese New Year, not a structural demand collapse.

UHNW Demand: Real But Measured

UHNW foreign buyer ABSD cost share S$5M CCR condo Singapore 2026
Figure 2: For a foreign UHNW buyer, the 65% ABSD represents 38.5% of total acquisition cost on a S$5M CCR condominium. Source: IRAS ABSD schedule 2023–2026.

Asia-Pacific UHNW population growth of ~24.8% between 2021 and 2026 has expanded the pool of potential buyers even at elevated ABSD rates. For buyers at this wealth tier, the 65% ABSD may represent an acceptable price for: no inheritance tax (abolished 2008), no capital gains tax on property, political neutrality in a fractured geopolitical environment, and world-class infrastructure supporting family relocation. The volume of such buyers is small — perhaps 200–400 transactions annually in the CCR above S$3M — but their price-setting impact is disproportionate.

Structural Safeguards: Why Singapore’s Market Is Different

Singapore’s residential market benefits from structural safeguards that collectively reduce speculative volatility: MAS property loan rules (TDSR 55%, LTV 75%/45%, MSR 30%) enforced since 2013; Sellers’ Stamp Duty (12%/8%/4% on years 1–3) that eliminates short-horizon flipping; URA’s calibrated GLS programme managing supply against demand signals; and an approximately 90% homeownership rate among resident households providing a stable owner-occupier base. Taken together, these mechanisms make Singapore’s residential market more resistant to sharp price swings than most international comparators.

Summary: Singapore Property Safe Haven — Key Metrics at a Glance

Indicator Singapore (Q1 2026) Context
Overall private residential price growth (q-o-q) +0.3% Source: URA pr26-31
OCR price growth (q-o-q) +1.3% Strongest sub-market Q1 2026
CCR price growth (q-o-q) +0.4% UHNW-exposed segment — stable
ABSD for foreign buyers 65% Effective since 27 April 2023 (IRAS)
ABSD for FTA nationals (US/CH etc.) SC rates (0–30%) Only 5 nationalities qualify
Capital gains tax on property None Subject to IRAS badge-of-trade test
Sellers’ Stamp Duty (year 1) 12% Eliminates short-term flipping
SG GDP growth forecast 2026 2–4% MAS macroeconomic review
Private residential pipeline (2025–2027) ~40,000 units Key supply-side risk to watch

Worked Example: The UHNW Relocation Decision

A European technology entrepreneur, Ms K, relocating to Singapore on an Entrepreneur Pass targets a S$6M freehold 4BR unit in District 10. As a foreigner: ABSD 65% = S$3.9M. Total acquisition cost ~S$10.23M (plus BSD ~S$329,600 + legal). On a 10–15-year horizon, she foregoes yield (estimated gross yield 2.1%) and treats the property as a wealth-preservation vehicle. At a 3% annual SGD appreciation against EUR, the currency return alone adds S$2.4M over 10 years on a S$8M net asset position. For this buyer profile, the 65% ABSD is the cost of accessing the full Singapore safe-haven package — not a deterrent.

Key Risks to Watch

The safe-haven thesis for Singapore property in 2026 is credible but conditional. A synchronised global recession would pressure Singapore’s open economy (trade-to-GDP ratio above 300%), affecting employment, wages and domestic demand. The ~40,000-unit private residential completion pipeline for 2025–2027 could generate a supply overhang if demand softens concurrently. MAS’s higher-for-longer rate environment (effective mortgage rates 3.5–4.2%) keeps carrying costs elevated for leveraged buyers. And any relaxation of ABSD or TDSR rules — unlikely but not impossible — could paradoxically signal government concern about market weakness, dampening rather than stimulating confidence.

What Might Come Next

The URA April 2026 new home sales data (expected ~15 May 2026) will provide the next empirical test of whether OCR demand has been sustained after the strong Q1 new-launch take-up. If the April figure confirms momentum above 800–900 units sold, the safe-haven/OCR-upgrader thesis for 2026 looks intact. A print below 600 would flag a more cautious consumer posture and would likely see analysts revise full-year private residential price forecasts toward the lower end of the 3–5% annual range.

Frequently Asked Questions

Does the 65% ABSD apply to all foreigners buying Singapore property?

Yes, with one group of exceptions. Nationals of the United States, Iceland, Liechtenstein, Norway and Switzerland pay ABSD at Singapore Citizen rates under respective FTA provisions — 0% for first property, 20% for second, 30% for third and beyond. All other foreign nationals, including those on Employment Passes or Long-Term Visit Passes, pay 65% ABSD on any residential property purchase. The rate was set at this level effective 27 April 2023 by the Ministry of Finance and administered by IRAS.

Is Singapore property really capital gains tax free?

Singapore does not impose a capital gains tax. Gains from the sale of Singapore property are not taxed, provided the transaction is an investment rather than a trading activity. IRAS applies a “badges of trade” test (frequency of transactions, holding period, leverage, stated intent) to determine whether gains are assessable as income. For genuine long-hold investors, capital appreciation on Singapore property is effectively untaxed. This policy could change in future — investors should model scenarios that include a potential capital gains tax, which several peer jurisdictions have introduced in recent years.

How does Singapore compare to Hong Kong as a safe-haven property market?

Hong Kong reduced its Buyer’s Stamp Duty for non-permanent residents from 30% to 7.5% in February 2024 to revive its property market. Despite this, transaction volumes and prices in Hong Kong’s residential market have remained subdued, weighed by political uncertainty, reduced expatriate headcount and weak domestic economic confidence. Singapore, by contrast, has maintained its cooling measures and seen stable, positive price growth. Many international investors currently rate Singapore above Hong Kong for residential real estate, given rule-of-law certainty, financial-sector depth and the SGD’s track record of appreciation.

Can a Singapore PR benefit from safe-haven demand dynamics?

Yes, indirectly. PRs purchasing their first residential property in Singapore pay 5% ABSD — a fraction of the foreigner rate. If global uncertainty continues to drive wealth flows into Singapore, demand-support effects on CCR and RCR prices benefit all existing property owners, including PRs. PRs also benefit from the SGD’s safe-haven appreciation effect in their overall balance sheet if they hold Singapore-denominated assets. A PR who became a Singapore Citizen before purchasing a second property saves 25 percentage points in ABSD (0% SC first property vs 5% PR + 25% differential on second).

What are the most sought-after districts for UHNW foreign buyers in 2026?

Districts 9 (Orchard, River Valley), 10 (Tanglin, Bukit Timah, Holland) and 11 (Novena, Thomson) remain the primary targets for UHNW foreign buyers in Singapore’s CCR. Sentosa Cove (District 4) is the only area where foreigners may purchase landed property without separate government approval — though its pricing and yield dynamics are highly specific. D9 and D10 freehold condominiums with full-facility buildings in the S$5M–S$15M range have seen the most sustained foreign interest in 2025–2026 per URA caveat data.

Related Articles


Disclaimer: This article is a news analysis and commentary piece, not financial or investment advice. Data cited from URA, HDB, MAS and IRAS as at Q1–Q2 2026. ABSD rates, tax policies and MAS regulations are subject to change. Readers should consult a MAS-regulated financial adviser, a licensed property agent and qualified legal counsel before making any property investment decision. Foreign nationals should also obtain independent legal advice on residency, visa and tax implications in their home jurisdiction before purchasing Singapore property.

Translate »