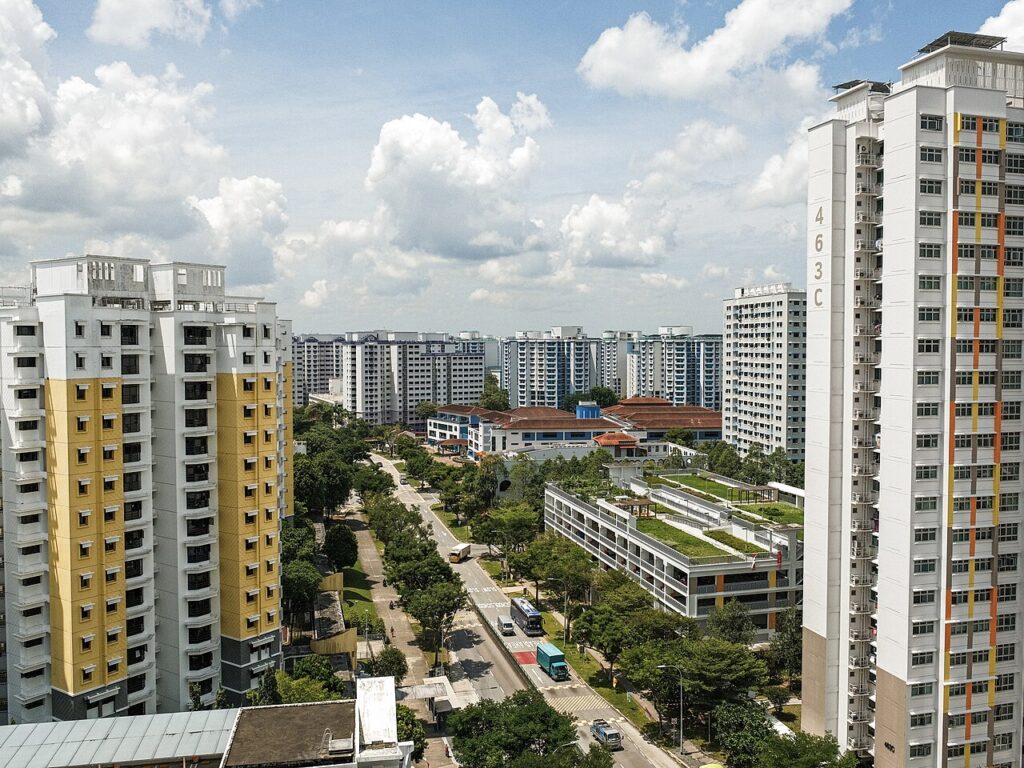
Singapore HDB Resale Price Index Guide 2026: What the RPI Measures, How to Read It and Q1 2026 Data
Quick Answer: HDB Resale Price Index (RPI) Guide 2026
- The RPI measures price movement, not price levels — it shows whether HDB resale flats are getting more or less expensive on a like-for-like basis, quarter by quarter.
- Current base: Q1 2012 = 100 — an RPI of 203.4 in Q1 2026 means prices have doubled (+103.4%) since the 2012 base year on a quality-adjusted basis.
- Q1 2026 RPI: 203.4 (−0.1% QoQ) — the first quarterly dip since Q2 2019; still +1.2% year-on-year.
- The index is published by HDB quarterly, approximately 4 weeks after each quarter end, alongside full transaction data at hdb.gov.sg.
- 6,179 HDB resale transactions in Q1 2026 — a 17.6% QoQ increase in volume, confirming active demand even as prices edged down.
- 412 million-dollar HDB flats in Q1 2026 — a record quarterly high, concentrated in mature estates and larger flat types.
- The RPI controls for composition — if more cheaper flats transact in one quarter, the index removes that mix effect so you see pure price movement.
- Best used alongside median prices and psf data — the RPI tells you trend direction; median prices and psf data tell you absolute costs for the specific flat type and town you are targeting.
What Is the HDB Resale Price Index?
The HDB Resale Price Index, commonly abbreviated to RPI, is Singapore’s official measure of price movement in the public housing resale market. Published by the Housing & Development Board (HDB) on a quarterly basis, it tracks how much the price of a typical HDB resale flat has changed relative to a defined base period — currently Q1 2012, which is set at a value of 100.
Crucially, the RPI is an index of price change, not an index of absolute price levels. An RPI of 203.4 in Q1 2026 does not mean that the average HDB flat costs S$203,400. It means that, on a quality-adjusted basis, HDB resale prices have more than doubled (+103.4%) since Q1 2012. To understand what a specific flat type costs in your target town today, you need to look at HDB’s median transaction data or check resale listings — but to understand whether the overall market is rising, falling, or holding steady, the RPI is the definitive source.
The RPI is administered by HDB under the Housing and Development Act and forms part of the quarterly real estate statistics package released jointly with the Urban Redevelopment Authority (URA). Unlike anecdotal price reports or listing-based averages, it is grounded in actual completed transactions registered through HDB’s resale portal, making it the most authoritative measure of HDB market conditions available to buyers, sellers, researchers, and policymakers.
How the HDB Resale Price Index Is Computed
The RPI is constructed using a hedonic regression model — a statistical technique that isolates the effect of price changes from changes in the mix of properties transacted. In practice, this means that if a given quarter sees relatively more transactions of smaller, cheaper flats in non-mature estates (compared to the previous quarter), the index adjusts for this compositional shift so that the resulting index movement reflects genuine price change rather than a change in what was being sold.
The regression model controls for multiple property characteristics simultaneously:
- Flat type: 2-room Flexi, 3-room, 4-room, 5-room, executive / multi-generation
- Town: each of Singapore’s 26 HDB towns is represented separately
- Floor area: larger flats typically command higher prices, controlling for size isolates per-square-metre movements
- Remaining lease: flats with shorter remaining leases trade at discounts; the model controls for the CPF and HDB loan accessibility cliff at 60 years remaining lease
- Storey range: higher floors command premiums, particularly in mature estates
The resulting index is chain-linked quarterly — meaning each period’s change is calculated relative to the immediately preceding period, and the cumulative chain is then rescaled to Q1 2012 = 100. This approach allows the model to be updated with new transaction data each quarter without retroactively revising earlier index values materially.
HDB publishes the RPI alongside full transaction data, including the number of registered resale applications, median transaction prices by flat type and town, and the number of million-dollar transactions. All data is freely available at hdb.gov.sg under “Resale Statistics.”

Historical Trend: Three Distinct Phases
The RPI’s history from its inception is best understood as three distinct phases, each shaped by different policy and macroeconomic forces administered by HDB and the Ministry of National Development (MND).
Phase 1 — The Boom (2009–2013): Following the Global Financial Crisis, Singapore’s HDB resale market surged as demand for public housing far outpaced the supply of new BTO flats. Buyers — including permanent residents who were then eligible to purchase resale flats from the open market — competed aggressively, pushing the RPI from approximately 73 (2009) to a peak of 108 in 2013. Cash Over Valuation (COV) payments — cash premiums paid above HDB’s official valuation — became endemic, sometimes reaching S$30,000 to S$50,000 on popular blocks.
Phase 2 — The Correction (2013–2019): The government responded to the HDB boom with a combination of cooling measures: tighter ABSD rates, loan-to-value (LTV) restrictions, the Total Debt Servicing Ratio (TDSR) framework (introduced June 2013), and a significant expansion of BTO supply. The abolition of the cash-over-valuation mechanism in March 2014 was particularly impactful, removing the ability of sellers to demand cash premiums above the official HDB valuation. The RPI fell from its 2013 peak of 108 to a trough of approximately 98.8 in 2019 — a 8.5% correction over six years.
Phase 3 — The Recovery and Surge (2019–2026): A combination of pandemic-driven demand (more time at home, family formation decisions, desire for larger spaces), supply disruptions to the BTO pipeline from COVID-19 construction delays, and low interest rates drove an extraordinary resale price surge from 2020 onwards. The RPI climbed from approximately 98.8 (2019) to 203.6 (Q4 2025) — a doubling over six years. In Q1 2026, the index recorded its first quarterly dip (−0.1%) in nearly seven years, closing at 203.4 and signalling a possible inflection point.
Q1 2026: The Data in Detail
The Q1 2026 HDB resale market delivered a nuanced picture. The headline RPI fell 0.1% to 203.4 — the first quarterly decline since Q2 2019. Yet transaction volumes surged 17.6% QoQ to 6,179 registered applications. These two data points are not contradictory: rising volume alongside a modestly lower index indicates that demand remains healthy but that buyers are exercising greater price discipline, with fewer sellers able to command the premium pricing that characterised 2022 to 2024.
Year-on-year, the RPI remains 1.2% higher than Q1 2025, confirming that the long-term trajectory is still upward — the Q1 2026 dip is most accurately described as a pause rather than a reversal. Regionally, mature estates (Queenstown, Toa Payoh, Bishan, Clementi) continued to command premiums of 20% to 40% above HDB’s median valuation for comparable flat types, driven by proximity to MRT stations, reputable schools, and established amenities.

Million-Dollar HDB Flats: A Market Within a Market
One of the most discussed HDB market phenomena of the 2020s is the emergence of million-dollar resale flats. In Q1 2026, a record 412 HDB resale flats transacted at S$1 million or above — surpassing the previous quarterly record and representing approximately 6.7% of all Q1 2026 resale transactions.
These transactions are concentrated in a specific subset of the HDB stock: 5-room flats and executive flats with large floor areas (typically above 120 square metres), located in mature estates with long remaining leases (above 80 years), on high floors with favourable orientations, and near MRT interchanges or in prime postal districts (D10, D11, D20). Bishan, Queenstown, Toa Payoh, and Ang Mo Kio feature prominently in million-dollar transaction data; newer towns such as Punggol, Sengkang, and Sembawang feature far less frequently.
Importantly, million-dollar HDB transactions are not captured differently in the RPI computation — the regression model treats them as part of the overall market. However, they have an outsized influence on public perception of the HDB resale market’s valuation and can distort discussions of “average” or “median” prices if the underlying flat-type mix is not considered. A buyer targeting a 3-room flat in Sengkang should not benchmark their purchase against a 5-room executive unit in Queenstown that transacted at S$1.1 million.

How to Read and Use the RPI
The RPI is most useful as a directional indicator of market momentum rather than a precise predictor of any specific flat’s price. When the index rises consecutively for several quarters, it signals broad-based market strength — a time when buyers may need to act decisively and sellers can price assertively. When the index is flat or declining, as in Q1 2026, it signals that the balance of power is shifting toward buyers, who have more negotiating leverage and face less competition from other purchasers.
For buyers, the RPI should be read alongside HDB’s median resale price data by town and flat type, which provides the absolute dollar benchmarks needed to assess whether a specific listed price is fair. For example, if the median 4-room resale price in Tampines is S$575,000 and a seller is asking S$630,000, you know you are being asked to pay a 9.6% premium — which may or may not be justified by the specific unit’s attributes (level, renovation, facing, proximity to MRT). The RPI tells you nothing about that specific 9.6% premium; it only tells you whether the overall market is trending up or down.
For sellers, the RPI provides market context for pricing decisions. A flat priced well above the market trend during a period of RPI softening (as in Q1 2026) is likely to sit unsold for longer, accumulating mortgage costs and opportunity cost. Pricing within 5% of recent comparable transactions (using HDB’s open data on recent resale transactions, updated weekly) optimises both speed of sale and realised price.
RPI vs Median Prices: Understanding the Difference
| Measure | What It Shows | Best Used For | Limitation |
|---|---|---|---|
| HDB Resale Price Index (RPI) | Quality-adjusted price movement QoQ and YoY | Trend direction, timing decisions | Does not give absolute price levels |
| Median Resale Price (by town/type) | Mid-point of all transacted prices for a flat type in a town | Benchmarking a specific purchase or sale | Sensitive to composition; large-flat bias if few 3-rooms transact |
| Median PSF (S$/sqft) | Price normalised for size, allowing cross-town comparison | Comparing value across different flat sizes | Remaining lease and floor level differences not reflected |
| Transaction Volume | Number of completed resale deals per period | Gauging market activity and liquidity | Volume and price can move independently |
| Cash-Over-Valuation (COV) | Premium paid above HDB valuation (post-2014: now rare in formal sense) | Historical context; indicative of seller leverage | HDB abolished mandatory COV reporting in 2014 |
Worked Example: Using the RPI to Time a Resale Flat Sale
Mr and Mrs Tan are a Singapore Citizen couple who purchased a 4-room HDB flat in Ang Mo Kio (AMK) in 2019 at S$495,000. Their flat completed its 5-year MOP in Q1 2024. They are now considering selling to upgrade to a condominium. They want to use the RPI to assess whether Q2 2026 is a good time to list the flat.
Step 1 — Reading the RPI: The RPI stood at approximately 98.8 in 2019 (when they bought) and is at 203.4 as at Q1 2026. This represents a 106% increase in the index — suggesting that on a market-wide basis, resale prices have roughly doubled since their purchase. However, this is the market-wide figure; AMK is a mature estate and may have outperformed or underperformed the market.
Step 2 — Checking median data: HDB’s resale statistics show that the median 4-room resale price in Ang Mo Kio was approximately S$585,000 in Q1 2026, up from S$490,000 in Q1 2024. This is a 19.4% increase in two years — slightly above the RPI gain for the same period (+2.4% over those 6 quarters), suggesting AMK has outperformed the market slightly.
Step 3 — Evaluating timing: With the RPI at 203.4 and a first quarterly dip in Q1 2026, the market is at a high valuation point relative to history. Selling in a cooling market typically takes longer — average HDB resale time-to-sell in Q1 2026 was approximately 4 to 6 weeks for well-priced units. The Tans’ flat has a long remaining lease (approximately 86 years), which preserves CPF eligibility for buyers. They price the flat at S$595,000 (2% above median), engage an agent to list it in April 2026, and it transacts within 5 weeks at S$588,000. Net equity after repaying the outstanding HDB loan of S$120,000 and CPF refund of S$210,000 (with accrued interest) is approximately S$258,000 in cash — which they use as part of the ABSD remission exercise for their condominium purchase.
What the Q1 2026 Dip Means for the Market
The −0.1% QoQ RPI reading in Q1 2026 is best interpreted as a signal of market equilibration rather than the start of a downturn. Several structural factors underpin this view. First, the large BTO pipeline of the 2022–2024 period — including the Plus and Prime Plus flat categories introduced under the new HDB flat classification framework — is beginning to reach completion and release first-timers back into the HDB ecosystem. As these buyers resell, they add supply to the market. Second, the June 2026 BTO exercise (6,952 units including the landmark Bishan Lakeview and Bishan Shunfu projects) will absorb first-timer demand that might otherwise have competed in the resale market. Third, affordability constraints at current price levels — with a median 4-room resale flat in a mature estate costing S$570,000 to S$730,000 — are more binding today than at any time in HDB’s history.
None of this suggests an imminent price crash. The structural demand drivers for HDB resale — the marriage and family formation rate, the 5-year MOP cycle releasing flat supply, the absence of new HDB supply in many mature estates, and the continued preference of Singapore households for home ownership — remain robust. The most likely H2 2026 scenario is continued modest volume growth in HDB resale transactions alongside approximately flat-to-slightly-positive quarterly RPI changes, with individual estate and flat-type performance diverging significantly from the market average.
What Might Come Next for the RPI
The Q2 2026 HDB resale statistics will be released by HDB in late July 2026 and will provide the next definitive data point. Given that: (a) BTO application volumes for June 2026 are high (suggesting first-timer demand has been partially redirected to BTO); (b) the resale market in April and May 2026 maintained healthy volume; and (c) private property prices continued to rise in Q1 2026, keeping resale HDB prices competitive relative to condominium alternatives — the most likely outcome for Q2 2026 is a small positive RPI change in the range of 0% to +0.5%.
Over the medium term, the million-dollar HDB flat segment is likely to remain buoyant — sustained by the finite supply of large flats in mature estates with long leases, and by the fact that each en-bloc cycle in the private market temporarily redirects sellers back to the public housing segment. Conversely, the mass-market 4-room resale segment in non-mature estates may see modest price moderation as BTO completions add supply and as the affordability ceiling binds more buyers.
Frequently Asked Questions
How often is the HDB Resale Price Index published?
The RPI is published by HDB on a quarterly basis, typically within four weeks of the end of each calendar quarter. The Q1 (January–March) data is released in late April; Q2 (April–June) in late July; Q3 (July–September) in late October; and Q4 (October–December) in late January of the following year. HDB also publishes flash estimates for the quarter before the full release — these are preliminary figures that may be revised slightly in the final report. All releases are publicly available on hdb.gov.sg under “Resale Statistics.”
Does the RPI measure the price of all HDB flats, including new BTO flats?
No. The RPI measures only HDB resale flat transactions — flats that have completed their Minimum Occupation Period (MOP) and are being sold on the open market by existing owners. It does not capture the price of new BTO flats sold directly by HDB, which are heavily subsidised and priced below market. The RPI therefore reflects the “market price” of public housing rather than the subsidised launch price of new flat exercises. This is why the RPI can rise substantially even when HDB continues to offer new BTO flats at subsidised prices — the resale market and the BTO market serve partly different buyer profiles and operate under different pricing mechanisms.
What does an RPI of 203.4 mean in practical terms?
An RPI of 203.4 (Q1 2026, with Q1 2012 = 100) means that the quality-adjusted price of a typical HDB resale flat has increased by approximately 103.4% since Q1 2012. This is a market-wide average — individual flat types, towns, and specific blocks will have diverged from this average significantly. Mature estate flats in Bishan, Queenstown, and Toa Payoh have outperformed the market, while flats in newer estates such as Punggol and Sengkang, or smaller flat types, may have underperformed. The 203.4 level also tells you that, relative to the 2013 RPI peak of 108, the current market is approximately 88% higher — highlighting how dramatically the affordability environment for resale HDB buyers has changed over the past decade.
Can I use the RPI to predict the future price of a specific flat?
The RPI is not designed to predict the price of a specific flat. It measures broad market trends using a hedonic regression approach, which means it controls for the average influence of flat characteristics. Your specific flat’s future price will be influenced by factors the RPI does not capture individually: the quality of your renovation, whether a new MRT station is planned nearby, the school allocation proximity, the remaining lease length relative to CPF accessibility rules, and whether the block has been earmarked for Selective En-bloc Redevelopment Scheme (SERS) consideration. For flat-specific valuation, obtain an HDB-commissioned valuation report or consult a licensed appraiser before signing any Option to Purchase.
What is the significance of the 60-year remaining lease threshold?
The 60-year remaining lease threshold is critical because it governs both CPF usage and HDB loan eligibility for resale flat purchasers. Under the CPF rules administered by the Central Provident Fund Board (CPFB), buyers can use CPF Ordinary Account funds to purchase a resale flat only if the flat’s remaining lease covers the youngest buyer to at least age 95. For a 35-year-old buyer, this means the flat must have at least 60 years of remaining lease. Similarly, HDB requires a minimum remaining lease of 20 years for a resale flat to be eligible for an HDB loan, and the loan tenure is capped so that the flat’s remaining lease meets the age-95 requirement. Flats approaching the 60-year lease boundary typically transact at a discount of 10% to 20% below comparable flats with longer leases — making remaining lease length one of the most important pricing variables in the HDB resale market.
How does the HDB RPI compare to the URA’s private property PPI?
The HDB RPI and the URA Private Property Price Index (PPI) are both hedonic regression-based indices, but they measure different markets. The PPI covers private residential properties (non-landed condominium and apartment transactions), while the RPI covers only HDB resale flats. Historically, the two indices have moved in the same broad direction but at different rates: private property prices tend to be more volatile, amplifying both upturns and downturns relative to the HDB market, which benefits from more structural demand (the 80% of Singapore residents who live in HDB flats). In Q1 2026, the indices diverged — the PPI rose 0.9% QoQ while the RPI fell 0.1% QoQ — reflecting the differing supply dynamics, buyer profiles, and regulatory contexts of the two markets.
Is the HDB resale market affected by Additional Buyer’s Stamp Duty (ABSD)?
Yes, but less directly than the private market. HDB resale flats are subject to ABSD when purchased as a second or subsequent property. A Singapore Citizen buying a resale HDB flat as a first home pays zero ABSD — this is the typical scenario for most resale buyers. However, an SC couple who already own a private property and wish to purchase a resale HDB flat would face ABSD of 20% on the second property — making the transaction financially unattractive in most cases. Permanent Residents purchasing their first HDB resale flat pay 5% ABSD, while PRs purchasing a second property pay 30%. Foreigners cannot purchase HDB resale flats at all under the Residential Property Act. These ABSD rules effectively concentrate HDB resale demand among first-time SC buyers and upgrading SC couples in the ABSD remission window — shaping the demographics and price sensitivity of the resale market.
Related Articles
- ABSD Singapore 2026: Complete Guide to Additional Buyer’s Stamp Duty
- Singapore HDB Flat Eligibility Guide 2026: HFE Check, Income Ceilings and What Qualifies You
- Singapore HDB CPF Housing Grant Guide 2026: EHG, Family Grant, PHG Explained
- Singapore Property MOP Guide 2026: HDB Minimum Occupation Period Rules Explained
- Singapore ABSD Remission and Refund Guide 2026: SC Couple Scheme and Clawback Rules
- Singapore Property Market Mid-Year Review 2026: H1 Results and 2H Outlook
- Singapore HDB Resale Levy Guide 2026: Complete Guide for Second-Timer Flat Buyers
Disclaimer
This article is for general informational and educational purposes only and does not constitute financial, investment, or property advice. All HDB Resale Price Index data is sourced from official HDB quarterly releases. CPF rules, ABSD rates, HDB loan eligibility criteria, and remaining lease policies are correct as at June 2026 and are subject to change by the relevant authorities. For the most current data, visit hdb.gov.sg, cpf.gov.sg, and iras.gov.sg. Individual property valuations and transaction outcomes vary. Consult a CEA-registered property agent and a conveyancing solicitor for advice specific to your circumstances.
Click anywhere or press Esc to close