Thomson-East Coast Line Property Guide Singapore 2026: Best Districts & Investment Opportunities

Thomson-East Coast Line Property Guide Singapore 2026: Best Districts & Investment Opportunities

The Thomson-East Coast Line property guide Singapore 2026 is your complete reference for buying, investing, or upgrading along Singapore’s newest MRT trunk line. The TEL, operated by SMRT under the Land Transport Authority’s network, is the first line to run from the deep north of Singapore — Woodlands North — all the way to the eastern seaboard at Sungei Bedok, connecting eight of Singapore’s twenty-eight districts in a single continuous line. For property buyers, the TEL represents both a connectivity premium already priced into northern and eastern districts and a genuine price-growth runway in catchment areas where development is still maturing.

Quick Answer — TEL Property in 2026 at a Glance

  • The TEL runs 43 stations across 5 phases; all phases are operational as of November 2024
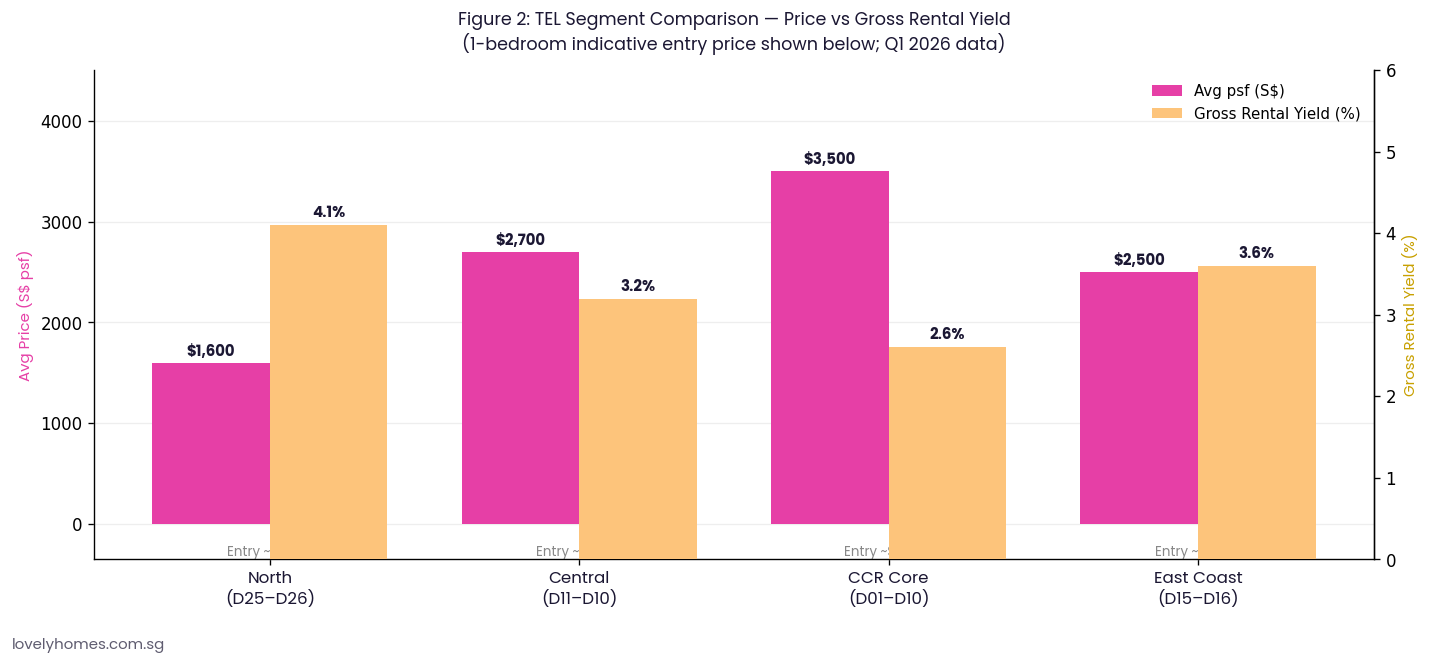
  • North segment (D25–D26): entry prices from S$1.2M–S$1.8M for 1–2 bedroom condos; gross yields 3.8–4.3%
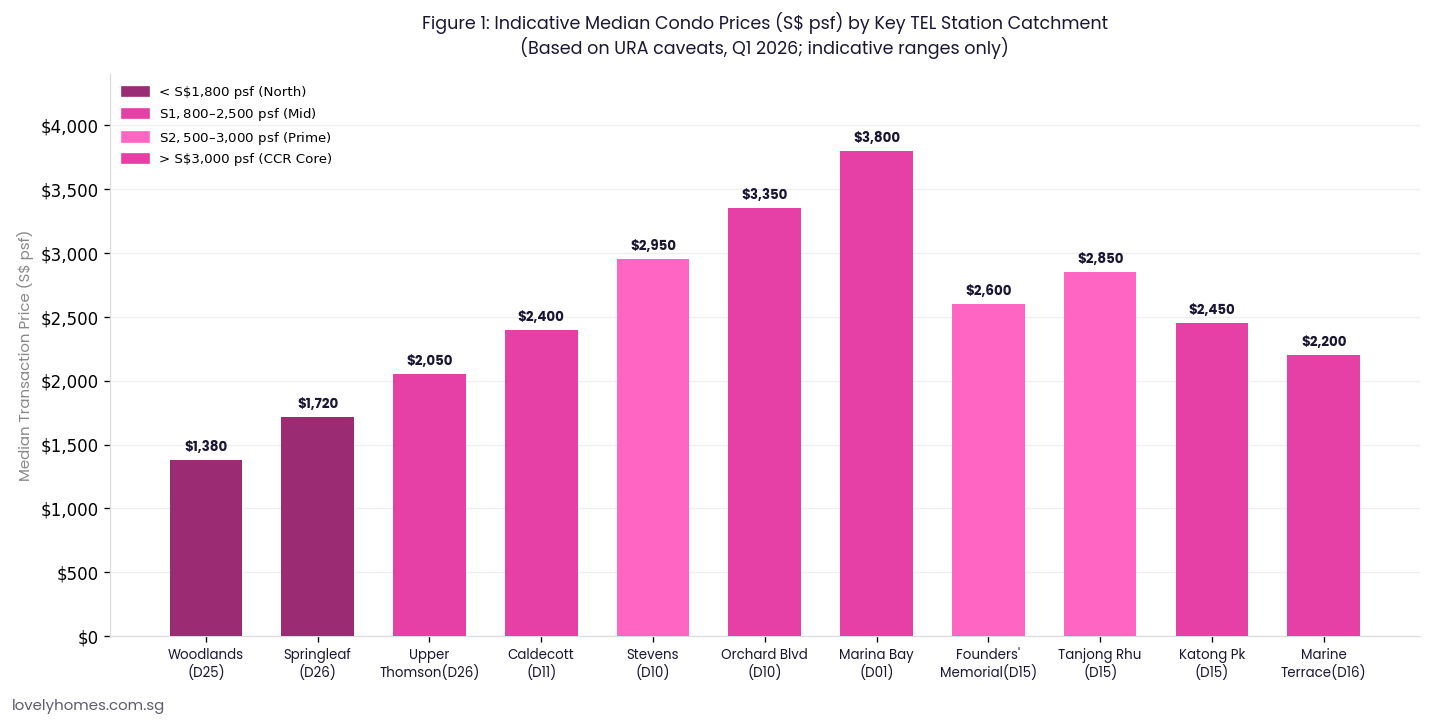
  • Prime central segment (D10–D11): average transaction prices S$2,900–S$3,800 psf; yields compress to 2.5–3.2%
  • East Coast segment (D15–D16): sweet spot for yield investors — S$2,200–S$2,600 psf with yields 3.5–4.0%
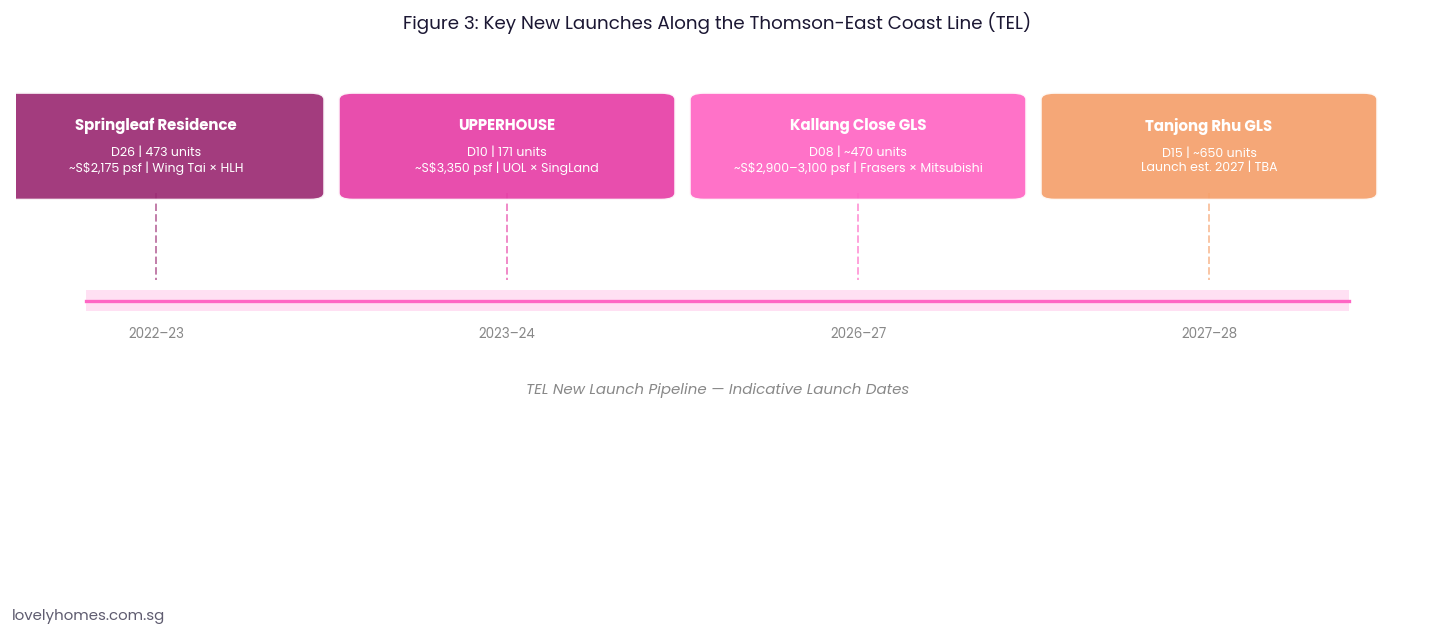
  • Three active new launches along the TEL corridor in 2026: Springleaf Residence (D26), UPPERHOUSE (D10), and the Kallang Close GLS
  • The TEL’s opening in D15 (Katong, Marine Parade, Tanjong Rhu) added a 6–12% price premium to catchment condos within 500m, per URA caveat analysis
  • Investors should note: TEL East Coast properties fall under the Rest of Central Region (RCR) and Core Central Region (CCR) frameworks for ABSD and LTV calculations
  • The Tanjong Rhu GLS site (D15) — first new land release in the area in 28 years — signals major upcoming supply in a historically undersupplied waterfront node

What Is the Thomson-East Coast Line?

The Thomson-East Coast Line is the sixth MRT line on Singapore’s Mass Rapid Transit network. Planned by the Land Transport Authority and built in five phases, the TEL broke ground in 2015 and reached full network connection in November 2024 when the final phase linking Bedok South to Sungei Bedok opened, completing the 43-station, approximately 43-kilometre corridor. Unlike older lines that were retrofitted through existing urban fabric, the TEL was master-planned as a north-south-east spine: it reaches previously MRT-unserved residential catchments in Woodlands, Upper Thomson, and the East Coast, while also adding new stations in the premium central districts of Stevens, Napier, and Orchard Boulevard.

The LTA’s long-term transport planning has established a clear correlation between MRT station proximity and private residential price premiums. Researchers at the National University of Singapore’s Institute of Real Estate and Urban Studies have documented average premiums of 5–15% for private properties within 500 metres of a station, with new lines generating the strongest uplift in the two to three years around opening. The TEL’s staged opening created sequential pricing events across its catchments, and property investors who tracked the LTA’s construction timeline were able to position ahead of each phase.

The TEL in Five Segments: A Property Investor’s Map

For analytical purposes, the TEL’s 43 stations divide into five investment segments, each with distinct supply, pricing, and yield characteristics.

Median condo prices psf by TEL station catchment Singapore 2026 Q1 URA caveats
Figure 1: Indicative median condo transaction prices (S$ psf) by key TEL station catchment area, based on URA caveat data for Q1 2026. The gradient from north (D25–D26) to central CCR reflects Singapore’s established price geography.

Segment 1 — The North (D25–D26): Woodlands to Springleaf

The northern anchor of the TEL serves Woodlands (D25) and Upper Thomson/Mandai (D26). This is the most affordable segment on the line, with median condo transaction prices in the S$1,300–S$1,800 psf range as of Q1 2026 (URA caveats). The key residential projects here are Woodlands-area condos such as The Woodleigh Residences and Canberra Crescent developments, alongside the more recent Springleaf Residence at Upper Thomson. Springleaf Residence — a Wing Tai Holdings and Hong Leong Holdings joint venture — launched at an average S$2,175 psf and achieved 92% sold at launch, validating strong homebuyer demand in the D26 corridor.

Investment fundamentals for the north segment: rental yields are the highest on the TEL, typically 3.8–4.3% gross for 1-bedroom and 2-bedroom units, driven by the presence of international school catchments (Woodlands International School, Singapore Sports School), and the Woodlands Regional Centre transformation under URA’s long-range master plan. Entry prices for 1-bedroom units start from approximately S$850,000–S$1,000,000, making this the most accessible entry point on the line for investors under S$1M. The Woodlands–Johor Bahru RTS Link, due to complete in end-2026, is an additional demand catalyst: cross-border workers commuting from Singapore to the Johor Bahru Bukit Chagar terminus will increasingly seek rental accommodation at or near Woodlands MRT.

Segment 2 — Upper Thomson to Caldecott (D20, D11): The Middle Ground

Between Springleaf and the Orchard stretch, the TEL passes through Upper Thomson Road, the Caldecott interchange (linking to the Circle Line), and Stevens (linking to the Downtown Line). This segment includes Districts 20, 11, and the western edge of D10. Caldecott and Stevens are immediately adjacent to premium private residential estates including Bukit Timah, Holland Road, and the Nassim/Tanglin clusters — traditionally among the most expensive residential districts in Singapore.

The Stevens station, in particular, serves as a gateway to the Good Class Bungalow belt in D10 and the UOL-SingLand UPPERHOUSE at Orchard Boulevard development (101 units, 99-year leasehold, average S$3,350 psf, launched 2024). The connectivity addition of the TEL here — bringing a direct one-seat ride from Stevens all the way to Marina Bay and the East Coast — solidified premium pricing in a corridor that was already well-served by car ownership. For buyers, the TEL has made D10–D11 properties accessible to a broader pool of non-car-owning tenants, improving rental sustainability for high-end CCR units.

Segment 3 — The CCR Core (D01–D10): Orchard to Marina Bay

The TEL’s central stations — Napier, Orchard Boulevard, Great World, Havelock, Outram Park (interchange), Maxwell, Shenton Way, and Marina Bay — traverse the very heart of Singapore’s Core Central Region. Median transaction prices in this segment range from S$2,900 psf (Havelock/Great World catchment) to S$3,800 psf (Orchard Boulevard environs), with top CCR addresses in Orchard exceeding S$4,500 psf. The key driver here is not yield — gross rental yields compress to 2.4–3.0% as capital values are elevated — but capital preservation and long-run appreciation in freehold or near-freehold assets.

The CCR core is where the ABSD differential matters most acutely. Foreigners buying in this segment pay 60% ABSD, which has materially shifted the buyer mix since April 2023 towards Singapore Citizens and PRs on investment purchases. URA Q1 2026 caveats show that CCR transactions remain below their 2021–2022 peak volumes, but median prices have held firm, suggesting that existing CCR owners are not distressed and are holding for long-term appreciation rather than selling at discounts.

Segment 4 — East Coast (D15): Katong to Marine Terrace

The TEL’s East Coast segment — from Tanjong Rhu to Marine Parade and Siglap — is arguably the most exciting investment corridor on the line in 2026. This is a historically low-supply, high-demand residential area. The East Coast has long commanded rental and lifestyle premiums driven by the concentration of international schools (SAS, CIS, UWCSEA East, EtonHouse), the East Coast Park, and a café-and-food-culture character that attracts young expatriate and local professional tenants. Before the TEL, the area had no MRT connectivity at all — residents relied entirely on buses and private transport. The arrival of Katong Park, Marine Parade, and Marine Terrace stations in 2023 was transformative.

URA caveat analysis shows that East Coast condos within 500 metres of the new TEL stations transacted at S$2,400–S$2,700 psf in Q1 2026, representing a 6–12% premium over comparable units further from the stations. Gross rental yields for 1-bedroom units in Katong and Marine Parade run at 3.5–4.1%, benefitting from high expatriate rental demand. The 2025 Tanjong Rhu GLS — the first government land sale in the area in 28 years — will eventually add supply, but the timeline to completion is 3–5 years, leaving the existing stock to absorb near-term rental demand.

Segment 5 — Far East (D16): Bedok to Sungei Bedok

The terminal segment, from Bedok South through Siglap, Bayshore, and Sungei Bedok, represents the TEL’s newest frontier. Bayshore Road — the subject of a significant GLS tender launched by the URA in March 2026, with a S$1.9–2.1B bid estimate and a 1,280-unit mixed-use integrated development — will be the anchor new launch for this segment. This site has MRT integration built into the development brief, meaning future residents will have a covered walk directly from their lobby to Bedok South MRT. The catchment here currently trades at S$1,900–S$2,300 psf, offering the best price-to-TEL-connectivity value on the entire line for medium-term investors who are comfortable with a 2–3 year supply wait.

TEL segment comparison price psf versus gross rental yield Singapore condo 2026
Figure 2: TEL segment comparison — average price psf against gross rental yield and indicative 1-bedroom entry price (Q1 2026). The north and east segments offer the superior yield profile; the CCR core delivers capital preservation and prestige.

Summary Table: TEL Segments at a Glance

Segment Districts Median psf (Q1 2026) Gross Yield Entry 1BR (~S$) Best For
North (Woodlands–Springleaf) D25–D26 S$1,300–1,800 3.8–4.3% S$850K–1.0M Yield-focused; RTS uplift play
Mid-North (Thomson–Caldecott) D20–D11 S$2,050–2,400 3.0–3.5% S$1.2M–1.5M Balanced; school proximity
CCR Core (Orchard–Marina Bay) D01–D10 S$3,000–3,800 2.5–3.0% S$2.2M–3.5M Capital preservation; prestige
East Coast (Katong–Marine Parade) D15 S$2,400–2,700 3.5–4.1% S$1.5M–1.8M Expat rental; lifestyle premium
Far East (Bayshore–Sungei Bedok) D16 S$1,900–2,300 3.6–4.0% S$1.1M–1.4M Medium-term upside; Bayshore GLS

Worked Example: Comparing Two TEL Investment Scenarios

To illustrate how the TEL’s price geography affects investor outcomes, consider two hypothetical purchasers buying in April 2026, each with a S$1.8M budget for a 2-bedroom investment unit (Singapore Citizen, first private property, no ABSD).

Option A — East Coast (D15), near Marine Parade MRT: 2BR, 700 sqft at S$2,500 psf = S$1.75M. BSD payable to IRAS: ~S$55,600. Monthly mortgage (75% LTV, S$1.31M at SORA+0.75% = ~3.70%, 25 years): ~S$6,720. Monthly rental income at 3.7% gross yield: ~S$5,390. Net monthly cash flow (before management fee, property tax, sinking fund): −S$1,330 per month. Capital appreciation target: 4–6% per annum over a 7-year hold. Total return (conservative 4% p.a. appreciation + cumulative rental income): estimated IRR of approximately 8–10% over a 7-year hold.

Option B — North (D26), near Springleaf MRT: 2BR, 800 sqft at S$1,850 psf = S$1.48M. BSD payable to IRAS: ~S$43,000. Monthly mortgage (75% LTV, S$1.11M at 3.70%, 25 years): ~S$5,700. Monthly rental at 4.1% gross: ~S$5,060. Net cash flow: −S$640 per month (significantly better than Option A). Capital appreciation at a more conservative 3% p.a. over 7 years. IRR: approximately 7–9%, with a stronger monthly cash flow during the hold period. Option B also leaves S$320K of the budget unused, which could service emergencies or fund a second property later.

Neither option is inherently superior — the trade-off is between location prestige and rental resilience (Option A) versus cash-flow comfort and lower entry risk (Option B). Both outperform a typical fixed deposit or Singapore Savings Bond over a 7-year horizon on a total return basis, based on current market data.

New launch condos along Thomson-East Coast Line TEL pipeline 2026 2027 Singapore
Figure 3: Key new launch projects along the TEL corridor — indicative launch dates and entry pricing. The pipeline includes both live launches and upcoming sites from the Government Land Sales programme.

Why the TEL Matters for Property Investors in 2026

Singapore’s MRT network has historically been the single most reliable infrastructure driver of residential price premiums. The TEL is unique in that it opened across a decade (2019–2024), meaning different catchments are at very different stages of the price-uplift cycle. The north segment is still absorbing the connectivity premium as the Johor Bahru RTS Link nears completion; the East Coast is in the early-mid stage of its premium maturation; and the CCR core stations are fully priced in. For investors, the implication is clear: the North and East Coast segments still offer the better forward-looking return profile relative to entry price.

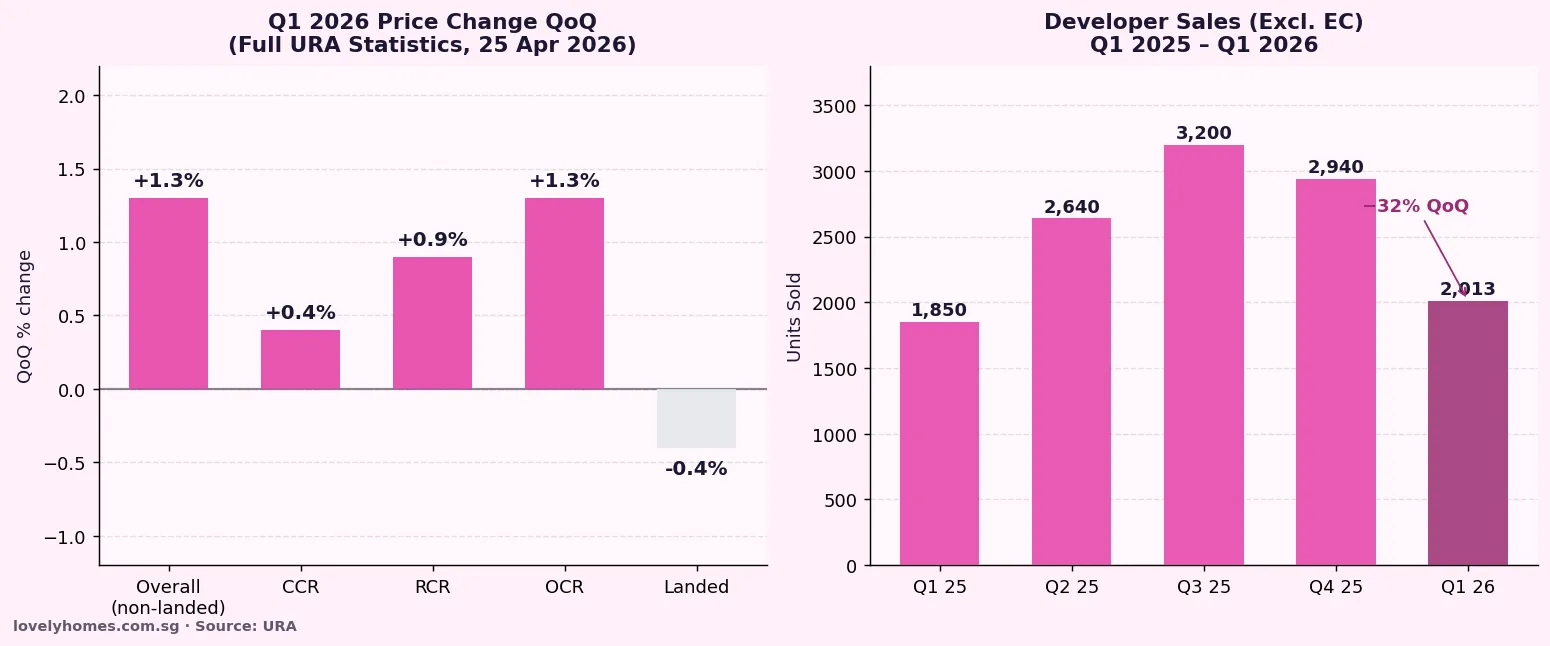
URA’s Q1 2026 full statistics (released 25 April 2026) showed that private residential prices rose 0.9% quarter on quarter, with the Rest of Central Region — which encompasses much of the East Coast TEL corridor — outperforming the Core Central Region in transaction volume. This divergence suggests that RCR properties, including East Coast condos, are currently absorbing more buyer demand than the premium CCR market, consistent with a pricing cycle where affordability-conscious buyers are moving down the price curve from CCR into RCR catchments along connective infrastructure like the TEL.

What Might Come Next Along the TEL

Looking forward, three developments warrant investor attention. First, the Bayshore Drive GLS (URA tender, closing July 2026) will be the defining new launch for the Far East segment. With 1,280 units and an MRT-integrated brief, the eventual project will set a new price benchmark for D16, potentially pushing neighbouring resale values upward in anticipation. Second, the Tanjong Rhu GLS — where the site was awarded in late 2025 — will bring the first new private development to the Tanjong Rhu waterfront in three decades; market estimates place the launch price at S$3,200–3,500 psf, consistent with D15 premium waterfront comparable transactions. Third, URA’s ongoing Draft Master Plan 2025 consultations include proposals to intensify the East Coast Park corridor and the Katong precinct, which, if implemented, could further bolster lifestyle premiums in the Marine Parade and Siglap catchments.

Frequently Asked Questions

Which TEL station has the best investment value in 2026?

For yield-focused investors, the Upper Thomson and Springleaf catchments (D26) currently offer the best combination of gross yield (3.8–4.3%), reasonable entry price (from S$1.2M for 2BR), and near-term demand catalysts from the Johor Bahru RTS Link. For capital appreciation, Marine Parade and Katong Park (D15) are the standout stations — still absorbing the TEL connectivity premium with a supply shortage that will persist until the Tanjong Rhu GLS project completes circa 2029–2030. For lifestyle owner-occupiers, Stevens and Orchard Boulevard (D10) offer unsurpassed centrality and school proximity at a premium entry point.

How much of a premium do TEL station properties command over non-MRT units?

Research from the Institute of Real Estate and Urban Studies at NUS estimates that properties within 500 metres of a new MRT station command a 5–15% price premium over comparable properties 800–1,500 metres away, with the premium being largest in the first two to three years after the station opens and in areas with low existing MRT coverage (such as the East Coast before the TEL). Properties integrated directly with a station (ground-level covered link) command a further 3–7% premium, per URA caveat analysis. For the East Coast segment, which had zero prior MRT coverage, the observed premium has been at the higher end of the 8–12% range for 500m-radius properties.

Are there new launch condos available along the TEL right now?

As of April 2026, active new launches along the TEL corridor include Springleaf Residence (D26, near Springleaf MRT, 473 units, 92% sold at launch at ~S$2,175 psf by Wing Tai and Hong Leong Holdings) and UPPERHOUSE at Orchard Boulevard (D10, near Orchard Boulevard MRT, 171 units at ~S$3,350 psf by UOL and Singapore Land Group). The Kallang Close GLS site (near Bendemeer MRT, an adjacent north-south TEL interchange station) is expected to launch circa 2027–2028 at S$2,900–3,100 psf by Frasers Property and Mitsubishi Estate. For the East Coast, the Tanjong Rhu waterfront site is in development and expected to preview approximately 2027.

How does ABSD apply to TEL property purchases by foreigners?

Foreigners purchasing any residential property in Singapore — including condos along the TEL — pay 60% ABSD on the full purchase price, regardless of whether it is their first or subsequent property. This applies equally to CCR Orchard Boulevard units and to more affordable East Coast apartments. The 60% rate, introduced in April 2023, has effectively priced most foreign investors out of the Singapore residential market. Singapore Permanent Residents buying their first private property pay 5% ABSD; their second residential property attracts 30% ABSD. Singapore Citizens pay 0% on a first private purchase and 20% on a second. All ABSD is administered by the Inland Revenue Authority of Singapore and is payable within 14 days of exercising the Option to Purchase.

What is the Johor Bahru RTS Link and why does it matter for TEL D25–D26 properties?

The Rapid Transit System (RTS) Link is a cross-border rail connection between Woodlands North MRT (the TEL’s northernmost station) and Bukit Chagar in Johor Bahru, Malaysia, scheduled for completion in late 2026. The RTS Link will allow commuters to travel between Singapore and Johor Bahru in approximately 5 minutes by rail, replacing a congested road crossing that currently takes 30–90 minutes in peak hours. For property investors, the RTS Link is a demand multiplier: Singaporeans working in Johor Bahru’s rapidly developing Iskandar Malaysia economic region, as well as Malaysians working in Singapore who choose to commute rather than rent, both anchor rental demand at or near Woodlands North and Woodlands MRT. Industry data suggests rental demand for 1BR and 2BR units within a 10-minute walk of Woodlands MRT could increase 15–25% once the RTS Link is fully operational.

How do I find resale condos near a specific TEL station?

The most reliable data source for resale condo transactions near any TEL station is the Urban Redevelopment Authority’s real estate information system at URA REIS. You can search by postal district or project name to see actual caveated transaction prices, floor area, and date of transaction. For a broader property search including current listings, URA’s public portal at ura.gov.sg provides planning information and the latest approved development details for each district. Cross-referencing URA caveats with listing prices gives you a reliable indication of the price gap (or premium) being applied by sellers in each catchment.

Related Articles

Disclaimer

This article is for general informational purposes only and does not constitute financial, legal, or property investment advice. All price per square foot figures, yield estimates, and transaction data referenced are indicative, based on publicly available URA caveat records and industry analysis, and are subject to change. Property values may go up or down. ABSD and stamp duty rates are administered by IRAS and are subject to revision. Consult a licensed property professional and a qualified financial adviser before making any investment decision.


Singapore Private Property Q1 2026 Full Statistics: Prices Rise 0.9%, Developer Sales Fall 32%, Rents Recover

Singapore Private Property Q1 2026 Full Statistics: Prices Rise 0.9%, Developer Sales Fall 32%, Rents Recover

URA Q1 2026 Singapore private residential full statistics prices up sales down

Quick Answer — Q1 2026 Key Findings

  • Overall private residential prices rose +0.9% QoQ in Q1 2026 — a significant upward revision from the +0.3% flash estimate issued 1 April
  • Non-landed segment led with +1.3% QoQ; landed homes fell −0.4% (first decline since Q1 2025)
  • Developer sales (excl. EC): 2,013 units — down 32% QoQ from 2,940 in Q4 2025; new launches: 1,844 units
  • Total private home sales (incl. resale & sub-sale): 5,413 units — down 19% QoQ
  • Rental prices reversed: +0.3% QoQ after −0.5% in Q4 2025; leasing volume +4% to 20,861 contracts
  • OCR led price growth at +1.3%; RCR +0.9%; CCR +0.4% — a reversal of the prior quarter’s CCR outperformance
  • Source: URA Full Q1 2026 Real Estate Statistics, released 25 April 2026 (pr26-31)

The Headline: Prices Firmer Than Expected, but Activity Cools

Singapore’s private residential property market ended the first quarter of 2026 on a note that confounded earlier market caution. The Urban Redevelopment Authority’s (URA) full Q1 2026 real estate statistics — released on 25 April 2026 — confirmed a price increase of 0.9% quarter-on-quarter, a significant upward revision from the flash estimate of +0.3% published on 1 April. The upward revision reflects the inclusion of transactions that settled late in the quarter and the complete dataset across all market segments.

This marks the sixth consecutive quarter of overall price appreciation, and comes despite a sharp slowdown in transaction volumes. Developer sales of new private homes (excluding executive condominiums) fell 32% quarter-on-quarter to 2,013 units in Q1 2026, compared with 2,940 in Q4 2025 — the lowest quarterly developer sales figure since Q1 2025. The divergence between resilient prices and declining volumes reflects constrained new supply, selective buyer behaviour, and the legacy of affordability compression from 2023–2025 price appreciation.

URA Q1 2026 Singapore private residential price change by segment developer sales data infographic
Figure 1: Q1 2026 price change by market segment (left) and developer sales trend (right). Source: URA Full Q1 2026 Real Estate Statistics, 25 April 2026.

Price Performance by Segment

Segment Q1 2026 QoQ Change Q4 2025 QoQ Change Commentary
Non-Landed (Overall) +1.3% −0.1% Strongest QoQ in 5 quarters; reversal of Q4 dip
OCR (Outside Central) +1.3% +1.2% Mass market continues to outperform; HDB upgrader demand
RCR (Rest of Central) +0.9% +0.5% Strong; reflects demand for city-fringe new launches
CCR (Core Central) +0.4% +1.1% Moderated from prior quarter; luxury demand more selective
Landed (Overall) −0.4% +3.4% First decline since Q1 2025; mean-reversion after strong 2025

The OCR’s continued leadership at +1.3% QoQ reflects the powerful structural driver of HDB upgraders — households completing their 5-year MOP on government flats and redeploying equity into mass-market private condominiums in districts 18, 19, 20, 23, and 27. This demographic pipeline is well-documented and shows no signs of abating through 2027.

The CCR’s moderation from +1.1% in Q4 2025 to +0.4% is consistent with a market where luxury buyers are more selective in an environment of elevated global uncertainty — including the US-China trade tensions and the spill-over effects of US tariff regimes on Singapore’s export-oriented economy. That said, +0.4% still represents appreciation, and the CCR has not seen negative quarterly price movement since Q3 2023.

The landed segment’s −0.4% retreat follows a very strong Q4 2025 (+3.4%). Landed properties are thinly traded and highly volatile on a quarterly basis; the Q1 dip is best read as mean-reversion rather than trend reversal, particularly given the structural scarcity of landed housing stock in Singapore.

Developer Sales and New Launches

Developers sold 2,013 private residential units (excluding ECs) in Q1 2026 — a 32% drop from the 2,940 sold in Q4 2025, and the weakest quarterly figure since Q1 2025. New project launches totalled 1,844 units, concentrated in the OCR and CCR, reflecting the pipeline of projects that had received sales licences after significant delays in late 2024.

The pull-back in volumes should be contextualised: Q4 2025 was exceptionally strong, driven by the simultaneous launch of multiple large-scale projects (THE ORIE, Promenade Peak, Elta, Parktown Residence) that collectively captured pent-up demand. Q1 2026’s normalisation is partly seasonal and partly a function of the reduced number of new projects in the pipeline following the Q4 burst.

Resale and sub-sale transactions also fell, with total private home sales (all categories) coming to 5,413 units — down 19% from 6,699 in Q4 2025. Industry observers note that the absolute volume remains healthy relative to the 2019–2022 baseline and that the quarter started slowly before accelerating in March 2026 following the Lunar New Year holiday period.

Rental Market Reversal — What It Means

Private residential rents reversed their recent softening trend, rising +0.3% QoQ in Q1 2026 after declining −0.5% in Q4 2025. Leasing volume also strengthened, climbing 4% quarter-on-quarter to 20,861 rental contracts. This is the first positive quarterly rental movement since Q4 2023, and may mark the end of the post-pandemic rental correction that saw prices ease from their 2022–2023 highs.

The rental recovery is supported by two converging forces: a continued influx of foreign professionals amid Singapore’s sustained tech and financial sector hiring, and a temporary tightening of rental supply as a number of large residential projects that reached TOP in 2023–2024 move past initial tenant search periods. The question for Q2 and Q3 2026 is whether this modest recovery sustains, or whether the global economic headwinds translate into reduced expatriate inflows and renewed rental softening.

What Might Come Next

The price upward revision from +0.3% (flash) to +0.9% (full) is the quarter’s most significant data surprise. It suggests that the late-quarter transactions — many of which were sub-sales and resales settled in March — carried higher psf values than the new launch transactions recorded earlier in the quarter. If this pattern holds into Q2 2026, the annual price growth trajectory for 2026 could exceed the more cautious industry forecasts of 2–4%, potentially tracking closer to 4–6%.

The key risk factors for H2 2026 remain: (a) global trade disruption and its impact on Singapore GDP growth and business confidence; (b) SORA rate movements — 3M compounded SORA remains above 2.9% as at April 2026, keeping home loan servicing costs elevated; (c) potential further ABSD measures if price momentum accelerates unexpectedly; and (d) the supply pipeline — with 17+ new project launches anticipated across Q2–Q4 2026, increased competition between developers for buyers could moderate per-unit pricing.

Note: This analysis is editorial commentary based on publicly available URA data. It is not investment advice.

Frequently Asked Questions

Why did the Q1 2026 price figure revise upward from the flash estimate?

The URA flash estimate, published 3–4 weeks into the following quarter, uses only transactions registered up to approximately mid-March. The full statistics incorporate all transactions completed through 31 March 2026, including late-settling resale and sub-sale contracts. These late transactions often involve higher-priced units (larger formats, upper floors, prime locations) that take longer to process — hence the full release tends to show a stronger price outcome than the flash.

Is the slowdown in developer sales a warning sign for the market?

Not necessarily. Developer sales of 2,013 units in Q1 2026 represent a normalisation after a bumper Q4 2025 that saw multiple large launches coincide. Historical Q1 figures often dip due to the Chinese New Year effect — reduced transaction activity during the festive period. The more telling metric is the 12-month trailing average, which remains above 8,500 units annually — a healthy pace for Singapore’s market size. Price resilience at +0.9% QoQ alongside lower volumes actually points to supply-demand balance rather than demand erosion.

What does the rental recovery mean for property investors?

The +0.3% QoQ rental increase in Q1 2026 (after −0.5% in Q4 2025) is a positive signal for landlords who have been holding property through the 2023–2025 rental correction. If rental yields stabilise or improve through H2 2026, the investment case for Singapore residential property — which was weakened during the high-ABSD, high-SORA, lower-yield environment of 2023–2024 — may recover modestly. However, with gross yields for most CCR and RCR condominiums still in the 2.5–3.2% range versus SORA-linked mortgage rates of ~3.5–3.7%, properties remain net-cash-flow negative on a leveraged basis for most investors.

Related Articles

Disclaimer: This article is editorial commentary based on data published by the Urban Redevelopment Authority of Singapore (URA). It is for general information only and does not constitute investment, financial, or property advice. All figures sourced from URA Media Release pr26-31 (25 April 2026). Verify data directly at ura.gov.sg. LovelyHomes.com.sg does not hold a real estate agency licence.


Singapore Private Property Market Q1 2026: Prices Rise 0.3%, OCR Leads at +1.3%

Singapore Private Property Market Q1 2026: Prices Rise 0.3%, OCR Leads at +1.3%

Singapore’s private residential property market began 2026 on a note of careful consolidation. The Urban Redevelopment Authority’s flash estimate for Q1 2026, released on 1 April, recorded a 0.3% quarter-on-quarter increase in the overall private residential price index — the softest quarterly growth in six quarters and a meaningful deceleration from the 0.6% gain seen in Q4 2025. Yet beneath this headline restraint lie important divergences across segments and regions that tell a more nuanced story.

Key Market Signals — Q1 2026

  • Overall private residential prices: +0.3% q-o-q (slowest growth in 6 quarters)
  • Non-landed segment: +1.0% q-o-q — strong rebound from Q4 2025’s slight dip
  • OCR leads: +1.3% q-o-q — suburban condos remain the demand driver
  • CCR recovery: +0.4% q-o-q — reverses the -3.5% slide of Q4 2025
  • Transactions: ~4,041 units — down 39.7% q-o-q from a high Q4 2025 base
  • New launch take-up: Several Q1 launches sold over 90% on launch weekend
Singapore Private Residential Market — Q1 2026
Flash estimate figures released 1 April 2026 by the Urban Redevelopment Authority

Overall Price Change (q-o-q) +0.3% — slowest growth in 6 quarters
Non-Landed Prices (q-o-q) +1.0% — rebound from -0.2% in Q4 2025
Landed Prices (q-o-q) -1.8% — reversal from +3.4% in Q4 2025
Core Central Region (CCR) +0.4% — reversal from -3.5% decline in Q4 2025
Rest of Central Region (RCR) +0.9% — after +0.7% in Q4 2025
Outside Central Region (OCR) +1.3% — strongest regional performer
Total Transactions (Q1 2026) ~4,041 units — down 39.7% q-o-q from 6,699 in Q4 2025
New Launch Take-up Highlight Several Q1 launches achieved >90% take-up at launch weekend
2026 Launch Pipeline ~17 projects / ~8,100 units — approx. 30% fewer than 2025
Key Takeaway
Private residential prices in Singapore remain in positive territory in Q1 2026, with non-landed homes leading a modest recovery. Transaction volumes fell sharply from a high Q4 2025 base but demand at quality new launches remained resilient.
Source: URA flash estimate — ura.gov.sg — 1 April 2026
LovelyHomeslovelyhomes.com.sg

Non-Landed Segment Rebounds; Landed Dips

The Q1 2026 data reveals a clear bifurcation between the non-landed and landed segments. Non-landed private homes (condominiums and apartments) posted a 1.0% quarter-on-quarter price gain — a healthy rebound from the marginal 0.2% decline recorded in Q4 2025. Landed homes, in contrast, retreated 1.8% after a strong 3.4% surge in the preceding quarter. The landed pullback is consistent with the typical volatility in that segment, which trades on thin volumes and is sensitive to single large transactions.

For most buyers and investors focused on the condominium market, the non-landed rebound is the more relevant signal. The data suggests that underlying demand for well-located private apartments remains positive, supported by a constrained 2026 launch pipeline and steady household formation among Singapore’s resident population.

OCR Leads; CCR Stages a Recovery

The Outside Central Region (OCR) — Singapore’s suburban heartland comprising districts such as Tampines, Jurong, Tengah, Sengkang, Upper Thomson, and Woodlands — delivered the strongest price performance of any region in Q1 2026 at +1.3% quarter-on-quarter. This reflects sustained demand from HDB upgraders, first-time private buyers, and families attracted to the OCR’s larger unit sizes and more accessible price quantum. Several OCR launches in late 2025 and early 2026 recorded impressive sales velocity; with the 2026 pipeline lean in this segment, competition for quality suburban new launches is likely to remain brisk.

The Rest of Central Region (RCR), covering districts like Bishan, Toa Payoh, Queenstown, River Valley, and parts of Novena, posted a 0.9% gain — a tick up from the 0.7% seen in Q4 2025, suggesting mid-market city-fringe product continues to attract steady demand from owner-occupiers and investors seeking a balance of accessibility and price growth.

The Core Central Region (CCR) — comprising the prime districts of Sentosa, Orchard, Holland, Tanglin, Marina Bay, and the financial district — staged a notable recovery with a +0.4% quarter-on-quarter gain, directly reversing the -3.5% decline of Q4 2025. The Q4 2025 weakness was largely attributed to a normalisation after a period of elevated prime-market activity and the impact of the 60% foreign buyer ABSD, which has materially suppressed international demand since April 2023. The Q1 2026 recovery suggests domestic CCR demand — led by Singapore Citizens, PRs, and Free Trade Agreement-eligible nationals including US citizens and Swiss nationals — is stabilising the top end of the market.

Transaction Volume Down on a High Base

Total private home transactions fell to approximately 4,041 units in Q1 2026, a 39.7% decline from the 6,699 units transacted in Q4 2025. The sharp percentage drop sounds alarming but should be read with important context: Q4 2025 was an unusually active quarter, boosted by a high concentration of new project launches in the second half of 2025 (including multiple large OCR and RCR projects that sold strongly). The Q1 2026 volume is closer to a normalised quarterly run-rate rather than an indication of distress.

Of the six developments launched in Q1 2026, several achieved take-up rates exceeding 90% on their respective launch weekends — a clear signal that buyer demand remains calibrated to the right product at the right price point. The cautionary note, however, is that with only approximately 17 projects and 8,100 units anticipated in the 2026 full-year pipeline (a 30% reduction on 2025’s approximately 11,000+ units), the aggregate transaction volume for 2026 is expected to be structurally lower than in prior years — not because demand has collapsed, but because supply is meaningfully constrained.

What This Means for Buyers in 2026

For prospective buyers, the Q1 2026 data paints a picture of a market in consolidation rather than in correction. Prices are neither accelerating dangerously nor sliding materially. The government has signalled no intention to introduce additional cooling measures in the near term, with the existing 60% foreign buyer ABSD and 55% TDSR cap continuing to provide structural support for affordability among genuine owner-occupiers.

For buyers considering the OCR, the combination of +1.3% price growth and a thin 2026 pipeline suggests that well-located suburban launches — particularly those with MRT proximity — are likely to see sustained demand. Projects such as Springleaf Residence (Upper Thomson, TEL, 941 units) and Pinery Residences (Tampines) illustrate the kind of connected suburban product that has been absorbing the bulk of OCR demand in early 2026. For CCR buyers, the segment’s Q1 recovery after a period of weakness opens a potential re-entry window for domestic buyers who have been waiting on the sidelines.

The full Q1 2026 URA report (incorporating complete sales data beyond the preliminary caveat cut-off) is expected in late April 2026. Buyers and investors should monitor the final figures alongside the HDB Resale Price Index, which is released in the same cycle, for a complete picture of how the private-public residential market relationship is evolving.

Related Guides

Disclaimer: Market data in this article is drawn from the URA flash estimate released 1 April 2026. Final figures will be published in the full URA quarterly release (typically 3–4 weeks after flash estimate). This article is for informational purposes only and does not constitute investment or financial advice.


Singapore Rental Yield Guide 2026: Where to Find 4%+ Gross Yields

Rental yield is the single metric that separates a property bought to rent out from a property bought to live in. In Singapore in 2026, gross rental yields on residential property have settled into a tight 2.5%–5.0% band, with the upper end reserved for suburban three-bedroom condominiums and smaller one-bedroom units in fringe micro-markets. This guide explains exactly how rental yield is calculated, which Singapore districts are delivering 4%+ gross yields in 2026, and the unit-type and tenure trade-offs that determine whether your rental yield translates into meaningful net cash flow after costs, taxes, and leverage.

Singapore rental yield guide 2026 condo yields district comparison
Figure 1: Gross rental yield is the headline, net yield is what pays the bills.

Quick Answer

  • Gross yield = annual rent ÷ purchase price × 100.
  • Singapore average (private condo, 2026): 3.5% gross.
  • Best yielding sub-markets: Woodlands, Jurong East, Sembawang, Tampines and selected OCR one-beds at 4.2%–4.8%.
  • Lowest yielding: CCR luxury freehold (Orchard, River Valley) at 2.2%–2.7%.
  • Net yield after costs is typically 30%–40% lower than gross — budget for maintenance, property tax, agent fees, income tax and vacancy.
  • Smaller units yield more: 1BR beats 3BR on gross yield by 60–120 bps.
  • HDB resale yield is not directly comparable — subletting rules apply (MOP, subletting-of-whole-flat rules).

How Rental Yield Works in Singapore

Rental yield has two forms: gross and net. Gross yield is simply the annual rent divided by the purchase price. Net yield deducts all the carrying costs — property tax, maintenance fees, agent commission, minor repairs, vacancy provision, income tax on rental income — and shows you the actual return before financing.

The formulae:

Metric Formula
Gross Yield (Monthly Rent × 12) ÷ Purchase Price × 100
Net Yield (Annual Rent − Annual Carrying Costs) ÷ Purchase Price × 100
Cash-on-Cash Return Net Cashflow ÷ Cash Downpayment × 100

Why Net Yield Is the Number That Matters

A condominium renting at S$4,500/month on a S$1.5M purchase looks like a 3.6% gross yield. But after you subtract property tax (S$3,600), maintenance (S$4,200), agent commission on a 2-year lease (S$4,500), minor repairs (S$2,000), 1-month annual vacancy provision (S$4,500) and income tax at 22% on taxable rent (approximately S$8,800) — you are looking at a net yield of 1.8%, roughly half the headline number. That is before interest on your mortgage, which would push a leveraged investor into negative cash flow territory unless rents outperform or rates fall.

Key takeaway

Always underwrite to net yield. Singapore investors frequently overestimate returns by anchoring on gross yield figures and ignoring 1.5–2.0 percentage points of carrying costs.

Singapore Rental Yield Map 2026 — By Region

Core Central Region (CCR)

The CCR — Districts 1, 2, 4, 9, 10, 11 and parts of 6 and 7 — is Singapore’s prestige market. It houses the bulk of freehold stock, luxury condominiums, and branded residences. CCR has the lowest gross yields of the three regions:

Sub-Market Tenure Gross Yield Range
Orchard / Tanglin (D10) Freehold / 99-yr 2.3% – 2.8%
River Valley (D9) Freehold / 99-yr 2.4% – 2.9%
Sentosa Cove (D4) 99-yr 2.2% – 2.6%
Newton / Novena (D11) Freehold / 99-yr 2.8% – 3.3%
Tanjong Pagar CBD (D2) Freehold / 99-yr 2.8% – 3.2%

Rest of Central Region (RCR)

The RCR — the districts ringing the CCR — has become Singapore’s sweet spot for balanced yield and capital growth:

Sub-Market Tenure Gross Yield Range
Queenstown / Alexandra (D3) 99-yr 3.2% – 3.8%
Science Park / Pasir Panjang (D5) 99-yr 3.0% – 3.6%
Toa Payoh / Bishan (D12 / D20) 99-yr 3.3% – 3.9%
Marine Parade / East Coast (D15) Freehold / 99-yr 2.9% – 3.5%
Bukit Merah / HarbourFront (D4 fringe) 99-yr 3.1% – 3.7%

Outside Central Region (OCR)

OCR — the suburbs — delivers the highest gross yields in Singapore, driven by cheaper acquisition costs, stable suburban rents and high tenant demand from upgrading locals and middle-management expats:

Sub-Market Tenure Gross Yield Range
Woodlands (D25) 99-yr 4.2% – 4.8%
Jurong East (D22) 99-yr 4.0% – 4.6%
Tampines (D18) 99-yr 3.9% – 4.5%
Sembawang / Yishun (D27) 99-yr 4.1% – 4.7%
Punggol / Sengkang (D19) 99-yr 3.8% – 4.3%
Clementi / West Coast (D5 West) 99-yr 3.5% – 4.0%

Unit-Size Effect: Why One-Bedders Lead the League Table

Within any single sub-market, smaller units yield more — a consistent pattern across OCR, RCR and CCR. The reason is mechanical: rent per square foot falls more slowly than purchase price per square foot as units grow. A 500 sqft 1BR in Jurong East might transact at S$930 psf and rent at S$3.80 psf/month (4.9% gross). The same project’s 1,100 sqft 3BR trades at S$1,150 psf and rents at S$3.20 psf/month (3.3% gross).

Unit Type Region Gross Yield
1-Bedroom (500–550 sqft) OCR 4.3% – 4.9%
2-Bedroom (700–750 sqft) OCR 3.8% – 4.3%
3-Bedroom (950–1,050 sqft) OCR 3.3% – 3.8%
4-Bedroom + (1,250 sqft+) OCR 2.8% – 3.3%
1-Bedroom (500–550 sqft) RCR 3.5% – 4.0%
3-Bedroom (950–1,050 sqft) RCR 2.8% – 3.3%

The trade-off: 1-bed demand is narrower — single tenants, young couples without children, international postings — meaning vacancy risk is higher in a downturn. Our shoebox unit guide dives deeper into the investment case.

Worked Example: OCR 1-Bedroom vs CCR 2-Bedroom

Consider two investors each deploying S$1.2M of equity:

Metric Investor A — OCR 1BR (Cash) Investor B — CCR 2BR (Leveraged)
Purchase Price S$1,200,000 S$2,400,000 (75% LTV ⇒ S$1.2M equity)
Location D22 Jurong East, 1BR 517 sqft D09 River Valley, 2BR 732 sqft
Monthly Rent S$4,000 S$5,800
Gross Yield 4.0% 2.9%
Annual Property Tax (non-owner) S$4,440 S$8,700
Annual Maintenance S$4,200 S$4,800
Annual Insurance S$600 S$800
Annual Agent Fees (avg) S$2,000 S$2,900
Vacancy Provision (1 month) S$4,000 S$5,800
Gross Rent p.a. S$48,000 S$69,600
Net Rent p.a. (pre-tax, pre-interest) S$32,760 S$46,600
Net Yield on Price 2.7% 1.9%
Mortgage Interest p.a. (4% on S$1.2M) S$0 (cash buyer) S$48,000
Pre-tax Net Cashflow S$32,760 −S$1,400

Investor A’s unleveraged OCR 1-bed generates positive cash flow of S$32,760 a year. Investor B’s leveraged CCR 2-bed is marginally cash-flow negative — which is fine if the strategy is capital appreciation on freehold tenure, but devastating if the investor miscalculated TDSR headroom. Stress-test using our TDSR/MSR guide.

The Six Factors That Drive Singapore Rental Yield

1. Transport Connectivity

Walk-to-MRT (within 400m) commands a 5%–8% rent premium over non-MRT peers, but also a price premium — so net yield effect is marginal. However, developments that are MRT-adjacent with a line upgrade coming (e.g. Cross Island Line or Jurong Region Line stations) see yields compress post-opening as prices re-rate faster than rents.

2. School Proximity

Tenants with Primary 1 registration imperatives pay a premium for the 1km and 2km catchment zones of sought-after primary schools. This is a tenant-pool effect, not a rent-per-sqft effect — it reduces vacancy rather than raising headline rents.

3. Unit Size and Facing

North-south facing with unblocked views, high-floor > 20th storey, and natural cross-ventilation all contribute 3–8% rent premium. Low-floor pool-facing units can underperform by 5%+.

4. Tenure

Contrary to popular belief, freehold commands a price premium but not a rent premium — tenants do not pay more for freehold because they are not buying. This directly compresses freehold yields below 99-year leasehold yields for otherwise-equivalent stock.

5. Age of Development

New launches rent at a premium in year 1–3 post-TOP, tapering towards market norms by year 5. 10–20 year old developments trade at the stable mid-range. 30+ year old freeholds often underperform on rent (dated finishes) but beat on yield (low purchase price).

6. Macro Cycle

Rental growth in Singapore tracks non-resident inflows (EP/PR approvals, multinational relocations). Expect outperformance during policy easing and underperformance when ICA and MOM tighten approvals. Check MAS Financial Stability Review annually.

Yield vs Capital Growth: The Eternal Trade-off

Singapore investors historically face a stylised choice:

  • OCR 1BR: 4.5% gross yield, 3% capital growth p.a. ⇒ 7.5% total return.
  • CCR freehold 2BR: 2.5% gross yield, 6% capital growth p.a. ⇒ 8.5% total return.

CCR wins on total return, OCR wins on cashflow. If you need the property to service its own mortgage, choose yield. If you can fund the shortfall from employment income and are playing for long-term wealth preservation, capital growth wins.

Tax Treatment of Rental Income

Singapore residents (citizens and PRs) are taxed on rental income at their marginal rate (up to 24% in 2026), with deductible expenses. Non-residents are taxed at a flat 24% without expense deductions (unless they elect to be taxed as tax-residents subject to the 183-day rule). Deductible expenses include mortgage interest, property tax, fire insurance, repairs, agent commission, and in certain cases, a 15% deemed rental expense in lieu of itemised receipts.

See the IRAS rental income and expenses page for the current deduction rules.

Five Ways to Increase Rental Yield

  1. Buy smaller. 1- and 2-bedroom units consistently out-yield 3- and 4-bedroom units in the same project.
  2. Buy older. 15–20 year old resale condos in established suburban districts often yield 80–120 bps more than comparable new launches next door.
  3. Avoid prestige premium. Freehold premium rarely justifies the yield compression; 99-year leasehold suburbs offer better cashflow.
  4. Furnish strategically. A S$20,000 furnishing package typically boosts monthly rent by S$300–S$500 — payback in 4–6 years, not 10+.
  5. Optimise vacancy. List at market, not above. Every month of vacancy is 8.3% of annual income lost.

Frequently Asked Questions

What is a good rental yield in Singapore?

Anything above 3.5% gross for a condominium in 2026 is above market average. Above 4.0% gross is considered strong. Above 4.5% is exceptional and usually limited to OCR shoebox units or distressed stock.

Why is my CCR condo’s yield so low?

CCR prices are elevated due to freehold tenure, land scarcity, and aspirational demand. Rents do not scale at the same rate as price because tenants are indifferent between freehold and 99-year leasehold for the same product. Result: headline yields of 2.3%–2.9% in prime Orchard, Tanglin, Sentosa.

Is HDB subletting a better yield play than condo rentals?

HDB subletting yields can be strong (3.5%–4.5%) but come with strict rules: minimum occupation period (5 years), subletting-of-whole-flat approvals, citizenship mix limits. See our HDB subletting guide.

What is a typical agent commission on a lease?

Standard market practice: 0.5 months’ rent for a 1-year lease, 1 month’s rent for a 2-year lease, 1.5 months for a 3-year lease, payable by the landlord.

Can I claim mortgage interest as a deductible expense?

Yes — mortgage interest on the rented property is deductible against rental income, as are property tax, fire insurance, repairs (not improvements) and agent commission.

How does the 15% deemed rental expense rule work?

IRAS allows landlords to claim 15% of gross rental as a deemed expense in lieu of itemised deductions, on top of mortgage interest and property tax. This simplifies tax filing for small landlords.

What is cash-on-cash return?

Net annual cashflow divided by total cash equity (downpayment + stamp duty + legal + furnishing). This is the number you actually experience in your bank account. Often divergent from net yield when leverage is high.

Can foreigners earn rental income in Singapore?

Yes — foreigners who own Singapore residential property can let it and earn rental income, subject to 24% non-resident tax rate.

Related Guides

External Authority Sources

Disclaimer: Rental yields are indicative and compiled from URA rental contract data, public transaction records, and market-survey estimates current at the time of writing. Individual yields vary by unit facing, floor, tenant profile and macro cycle. Nothing on this page is financial, tax, or investment advice — consult a qualified advisor before committing to a purchase.


Shoebox Units in Singapore: Are They Still a Good Investment? (2026)

Shoebox Units in Singapore: Are They Still a Good Investment? (2026)

Quick answer
URA defines a shoebox unit as a private residential unit under 500 sqft (46.4 sqm). Typical quantum in 2026 is S$0.9m–S$1.5m depending on region. Gross rental yields are 4.0–5.2% — the highest among private residential formats. Resale liquidity is harder than 2-bedders, especially in supply-heavy pockets. Shoeboxes still work as first rungs on the ladder, as pure yield plays near business parks, and as foreigner-owned entry points under ABSD 60%.

Shoeboxes have been polarising since URA first named them in 2012. Sceptics call them “yield traps” with poor resale mobility. Defenders point at sold-out launches in Geylang, Paya Lebar and Bugis, and at the arithmetic of getting into private property on one income.

This guide sets out the URA rules, the current quantum and yield picture, and the situations where the shoebox format genuinely still works. For broader investor comparison, read alongside our CCR vs RCR vs OCR guide.

Shoebox units scorecard — size, quantum, yield, resale horizon and trade-offs
The shoebox format, scored across size, quantum, yield and resale.

What counts as a shoebox

URA classifies any non-landed private residential unit under 500 sqft as a shoebox. Some of these are pure studios; others are 1-bedders with a defined bedroom. The common thread is minimal circulation space and a single main living area.

Since 2018 / 2019 URA guidelines, developers face minimum-size rules at project level outside the Central Area: typical average unit sizes must be above a floor (raised further in 2023 for selected districts), which caps how many shoeboxes go into a new OCR project.

Quantum and PSF

Region Typical quantum (new + resale) PSF (shoebox)
CCR S$1.2m–S$1.6m ~S$3,200
RCR S$1.0m–S$1.4m ~S$2,600
OCR S$0.9m–S$1.2m ~S$2,100

Shoebox PSF always runs above larger units in the same project — developers price the scarcity of small-unit entry tickets.

Rental yield

Rental yields run 4.0–5.2% gross across regions. The drivers:

  • Single-occupant tenant profile willing to pay a rent-per-head premium
  • Shorter vacancy cycles in business-park / CBD-fringe locations
  • Lower total maintenance cost base

Net yield (after maintenance fees, property tax, insurance, agent fees) is typically 70–80% of gross.

Who shoeboxes suit

  • Singles / young couples without children: entry ticket into private property from one income.
  • Upgraders from HDB wanting a second income stream (inside LTV limits).
  • Foreign buyers absorbing ABSD 60% on a smaller base.
  • Near-workplace pied-à-terres in Marina South / Paya Lebar.

Where the numbers break

Four failure modes:

  • Supply concentration. A 500-unit shoebox-heavy OCR project produces a resale queue where nothing moves.
  • Capital appreciation lag. Over 5–10 year horizons, 2-bedders have outperformed shoeboxes in most tracked projects.
  • Family-upgrade demand ceiling. Hard to sell to growing families.
  • Rental concentration risk. Yield dependence on proximity to specific employment nodes.

Worked example — OCR shoebox, 10-year horizon

A S$1.1m OCR shoebox bought at launch in 2016, rented at S$2,800/month from year 2, with 3% annual rent escalation and a 1.5% net of gross conversion:

  • Gross rent over 10 years: ~S$385,000
  • Net rent (70%): ~S$270,000
  • Capital appreciation at 2%/year: ~S$245,000 price uplift
  • Transaction costs (BSD, agent, legal): ~S$45,000

Simple pre-SSD, pre-CPF-accrued-interest total return: roughly S$470,000 on a ~S$250,000 net cash outlay (assuming 75% LTV). Attractive on paper — but highly sensitive to vacancy and rental softness.

Frequently asked questions

Can I buy a shoebox in an HDB estate?

HDB flats are not shoeboxes under URA’s definition (they’re public housing). The 2-room Flexi at ~430 sqft is the closest HDB analogue; the Fresh Start scheme uses it. See our Fresh Start guide.

Are shoeboxes eligible for CPF usage?

Yes, same as any private residential. Lease-to-95 test still applies.

What’s the smallest shoebox allowed?

URA’s minimum internal gross floor area for new developments is 35 sqm (~377 sqft). Some pre-rule stock goes smaller.

Does URA measurement exclude balconies?

URA applies a minimum GFA excluding balcony. Resale listings typically quote strata area including balcony, so always check the GFA.


This guide is for general information only and is accurate as of April 2026. Singapore property rules, taxes and cooling measures change frequently — always verify current figures with URA, IRAS, HDB or a licensed professional before committing. LovelyHomes is not a financial, legal or tax advisor.


Dual-Key Condo Units in Singapore: Who They’re Really For (2026)

Dual-Key Condo Units in Singapore: Who They’re Really For (2026)

Quick answer
A dual-key condo is a single strata title with two self-contained sub-units — typically a main 2 or 3-bed and a separate studio — behind a shared private lobby. It counts as one property for ABSD, LTV and TDSR. Typical size is 1,100–1,600 sqft. Rental yield uplift from partial rental is 0.5–1.0% over an equivalent single-key unit. Best for multi-gen families, WFH separation, or partial rentals while occupying the main unit.

The dual-key layout was a mid-2010s development marketing innovation: take a standard 3-bedroom floorplate, wall off one of the rooms into a self-contained studio with its own kitchenette and bathroom, and sell the whole thing as one strata title. Ten years on, dual-keys are a small but durable slice of the launch menu — and the rental maths often makes sense.

This guide covers the layout, the financing treatment, the rental-yield case, and the situations where a dual-key actively hurts you. If dual-key is on your shortlist alongside other condo formats, our condo downpayment guide covers the cash/CPF/LTV maths you’ll need to price it.

Dual-key condo floorplan schematic with main unit, sub-unit and shared private lobby
Typical dual-key layout — one title, two self-contained homes.

What a dual-key actually is

Two separate self-contained units sharing a private lift lobby. Each unit has its own:

  • Front door
  • Kitchen or kitchenette
  • Bathroom
  • Living / sleeping area

But critically, they share one strata title, one loan, one ABSD payment, one property-tax account.

Typical sizes and configurations

Layout Main unit Sub-unit Total size
2 + 1 dual-key 2-bed, ~700–900 sqft Studio, ~300–400 sqft 1,100–1,300 sqft
3 + 1 dual-key 3-bed, ~950–1,200 sqft Studio, ~400 sqft 1,400–1,600 sqft

Financing, ABSD and TDSR

One property, one set of duties

The entire dual-key unit is a single purchase. BSD and ABSD are calculated on the full purchase price; LTV is capped as if it were one property; TDSR and MSR apply once. This is the defining benefit over buying two shoeboxes — which would each attract separate ABSD.

Bank valuation quirks

Valuers apply a small discount to the sub-unit versus a freestanding studio, because it cannot be sold or remortgaged separately. Expect 3–6% under the sum of two equivalent standalone units.

The rental-yield case

The typical dual-key yield uplift runs 0.5–1.0 percentage points over an equivalent single-key 3-bedder. Two drivers:

  • The studio rents at studio PSF, which is always the highest PSF band.
  • Partial-rental frees the owner to occupy the main unit — keeping one-time ABSD exposure.

Who dual-keys suit

  • Multi-gen families: adult children, parents-in-law, or a helper with a separate bath/kitchen.
  • Hybrid owner-occupy + rent-out: owner in the main unit, studio leased on 12-month terms (short-term AirBnB is prohibited under URA < 3-month rule).
  • WFH professionals: completely separate workspace behind its own door.
  • First-time investors: live in the main unit, let the studio produce cash flow without triggering ABSD on a second property.

When the dual-key format hurts

  • Resale liquidity is thinner than a standard 3-bedder — the buyer pool is narrower (single families who want a standard 3-bed may skip dual-keys).
  • The sub-unit can feel cramped without good natural light — check window/air conditioning provisions.
  • PSF at launch is often above the comparable single-key because the developer prices in the yield-potential premium.

Frequently asked questions

Can I sell the two units separately later?

No. One strata title. The only way to sell separately is physical remodelling + strata subdivision, which is almost never approved.

Can I AirBnB the sub-unit?

No. URA forbids short-term rentals (< 3 months) of private residential property. 12-month leases are fine; serviced-residence-style rentals are not.

How does property tax work?

One tax account based on the unit’s Annual Value. If you owner-occupy the main and lease the sub-unit, the owner-occupier AV rates apply to the whole unit — a subtle benefit over leasing the entire unit. See our property tax guide.

Do dual-keys en bloc well?

Same as any other unit in the development — the en bloc sale is on the development, not the unit. Apportionment is usually by total share value, so dual-key owners are not disadvantaged.


This guide is for general information only and is accurate as of April 2026. Singapore property rules, taxes and cooling measures change frequently — always verify current figures with URA, IRAS, HDB or a licensed professional before committing. LovelyHomes is not a financial, legal or tax advisor.


Translate »