Jurong Lake District White Site 2026: Town Hall Link GLS Tender, 1,200 Homes and CRL CR19

Jurong Lake District White Site 2026: Town Hall Link GLS Tender, 1,200 Homes and CRL CR19

Quick Answer: JLD Town Hall Link White Site at a Glance

  • Site: Town Hall Link, Jurong Lake District (JLD), adjacent to the Jurong Town Hall national monument.
  • Total GFA: 186,139 sqm — one of the largest mixed-use sites launched in Singapore in recent years.
  • Residential: up to 1,200 private residential units.
  • Office: minimum 40,000 sqm — anchoring JLD’s ambition as the largest business node outside the city centre.
  • Complementary uses: up to 44,000 sqm for retail, serviced apartments, hotel, sports, community and medical facilities.
  • Connectivity: integrated with Jurong East MRT interchange (EWL/NSL), future JRL JE5 station, and upcoming CRL CR19 station (planned 2032).
  • Tender closes: 17 November 2026.
  • Why it matters: the White site designation gives developers flexibility to configure uses — residential, commercial, or mixed — based on market conditions at launch, making it one of Singapore’s most strategically significant land sales of 2026.

URA Launches JLD White Site: Singapore’s Most Anticipated 2H 2026 GLS Tender

The Urban Redevelopment Authority (URA) launched the tender for a White site at Town Hall Link in the Jurong Lake District (JLD) on 3 July 2026, marking one of the most significant Government Land Sales (GLS) moves of the year. At 186,139 sqm of total potential Gross Floor Area (GFA) — comprising a minimum 40,000 sqm of office, up to 1,200 private residential units, and 44,000 sqm of complementary uses — this site has the potential to define the next chapter of Singapore’s western regional centre.

The tender forms part of the Confirmed List for the 2H 2026 GLS Programme and will close at 12 noon on 17 November 2026. It comes less than two weeks after URA released its Q2 2026 property price flash estimate showing the overall private residential PPI rising a modest 0.5% — a market context that is stable enough for developers to bid with confidence, but not so frothy as to suggest over-payment risk.

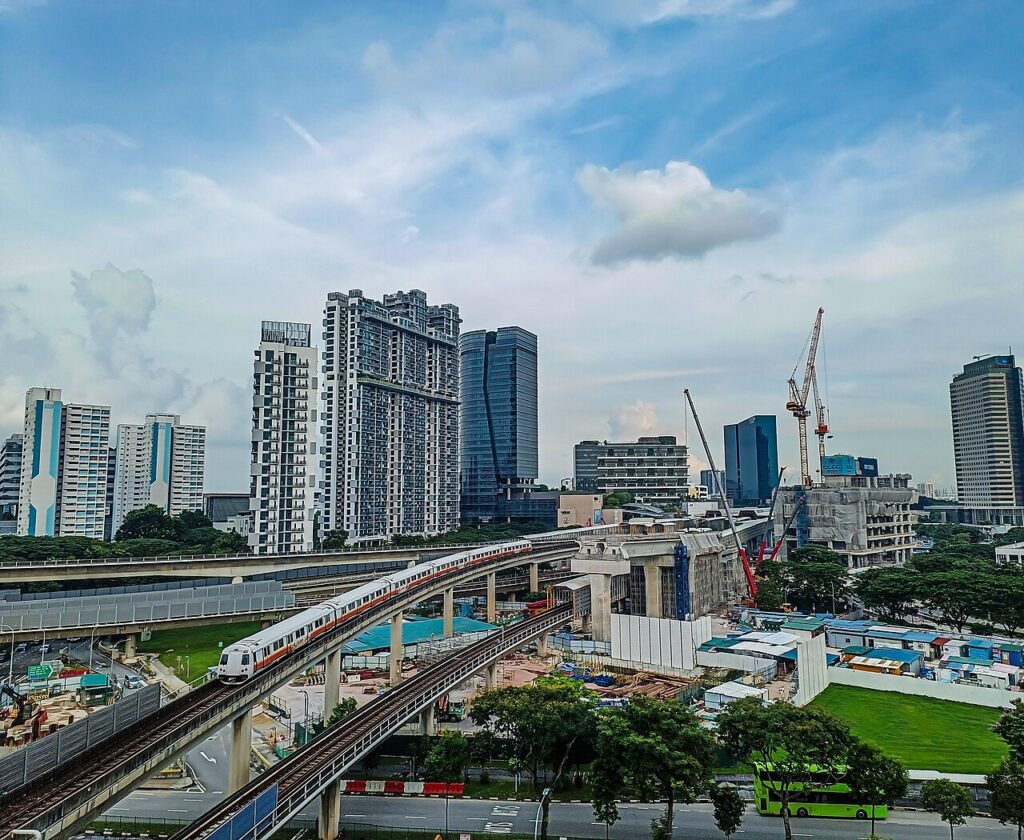
JLD is Singapore’s flagship decentralisation initiative: a vision to create a vibrant live-work-play precinct in the western part of Singapore that can absorb commercial, residential, and civic activity without adding further pressure on the already-congested central business district. The Town Hall Link site occupies a prime position within this vision — sited next to the Jurong Town Hall national monument, directly connected to the Jurong East MRT interchange, and in the future path of two new MRT lines.

What Is a White Site?

A White site in Singapore’s GLS framework is a land parcel that developers may develop for any combination of uses permitted under the Master Plan, subject to a minimum requirement for one or more specified uses. Unlike purpose-specific GLS sites (e.g., residential-only or commercial-only), a White site allows developers to calibrate the use mix based on their read of market conditions at the time of design and launch.

For the Town Hall Link site specifically, the conditions are: minimum 40,000 sqm office; up to 1,200 residential units; and up to 44,000 sqm for complementary uses. The developer awarded the site will have latitude to decide the precise mix of hotel, serviced apartments, retail, community facilities, and sports/recreation components — creating significant design flexibility in exchange for the commitment to deliver a meaningful commercial core.

White sites have historically attracted strong bidding interest in Singapore because they reduce the development risk associated with committing entirely to a single use in a market that can shift between residential launch and commercial occupation. The last major White site in JLD — the site that became J Gateway and the surrounding cluster — generated keen bidding when it was first introduced.

Jurong Lake District JLD Town Hall Link white site GFA breakdown office residential complementary 2026

Figure 1: Town Hall Link White Site — indicative GFA breakdown by use. Total 186,139 sqm. Source: URA pr26-53, 3 July 2026.

The JLD Masterplan: Context for This Site

JLD’s transformation has been driven by two decades of sustained government investment in infrastructure and planning. The revitalised Jurong Lake Gardens (90 hectares) provides the greenery spine at the district’s heart. Two new MRT lines are changing the connectivity calculus dramatically:

  • Jurong Region Line (JRL): JE5 station at Jurong East and JE6 station at International Business Park (planned to open 2028).
  • Cross Island Line (CRL): CR19 station at the heart of the new JLD precinct (planned to open 2032).

The addition of CRL is particularly significant: it will provide a direct east-west connection from JLD to Ang Mo Kio, Pasir Ris, and eventually Changi — transforming what has historically been perceived as a “western” destination into a genuinely cross-island node. For the Town Hall Link site, the multi-level pedestrian connections to Jurong East MRT interchange and the upcoming CR19 station mean that residents and office workers at this development will enjoy arguably the best public transport connectivity of any mixed-use site currently on the GLS market.

The site sits next to the Jurong Town Hall, a gazetted national monument. This adjacency imposes design constraints — any development will need to respect the monument’s visual and physical setting — but also provides a distinctive civic character that differentiates the JLD precinct from purely commercial developments elsewhere.

Development Mix Analysis

Use Component GFA (sqm) Status Commentary
Office 40,000 minimum Mandatory Anchors JLD’s role as business node; positions site as corporate headquarters address
Private Residential Up to ~102,139 (est.), max 1,200 units Optional (developer discretion) 1,200 units at typical 80–90 sqm average ≈ 102,000 sqm; adds residential critical mass to district
Complementary Uses Up to 44,000 Optional (developer discretion) Can include: retail, hotel, serviced apartments, sports/recreation, medical clinics, community facilities, visitor attractions
Total GFA 186,139 One of Singapore’s largest mixed-use GLS sites

At 1,200 residential units, this would represent one of Singapore’s larger single-site condominium developments — comparable in scale to recent developments like Canninghill Piers (696 units) and Lentor Modern (605 units), but notably larger. The scale is appropriate for JLD’s ambition to create residential density that sustains the commercial base.

Key Catalysts and Infrastructure Timeline

The development that occupies this site will benefit from a series of planned catalysts over the 2026–2035 horizon:

Catalyst Timeline Impact on Site
JRL JE5 (Jurong East) and JE6 (International Business Park) Phased opening, 2027–2028 Improved east-west connectivity within JLD; connects IBP to Jurong East interchange
New Science Centre at JLD Expected by 2027 Adds visitor attraction and civic anchor to the precinct; drives weekend footfall
Jurong Gateway Hub (bus interchange + office + retail + community club + library + sports) Expected by 2028 Integrated civic hub immediately adjacent; dramatically increases JLD’s daytime and evening population
CRL CR19 station at JLD Planned 2032 Cross-island connectivity; potential 15% to 20% capital value uplift for residential units at this site based on historical TEL/MRT proximity premiums

Residential Investment Angle: 1,200 Units in JLD

If the awarded developer proceeds with the full 1,200-unit residential allocation, this will be among the more significant new private residential supply additions to JLD since the area last saw major development activity in the 2013–2017 era (J Gateway, Westwood Residences, Lake Grande, Twin Vew). JLD has historically commanded a premium relative to other OCR locations — driven by the live-work-play narrative, the lake setting, and the Jurong East MRT interchange’s accessibility to both the western industrial belt and the central business district via the East-West Line.

A new-launch condo at this site, post-CRL connectivity, could plausibly target $2,000–$2,400 psf based on the trajectory of comparable new launches in OCR/RCR boundary locations in 2025–2026. The tender price paid by the developer will be the key determinant of eventual launch pricing — a high land bid will translate into a premium launch price, while a competitive-but-measured bid could allow the developer to price attractively and generate strong take-up. The tender close date of 17 November 2026 gives the market approximately four and a half months to assess these dynamics.

What This Means for the Broader Market

The JLD White Site launch is a policy signal as well as a commercial opportunity. URA’s decision to include a major White site in the 2H 2026 Confirmed List — rather than deferring it to the Reserve List — indicates confidence that developer demand is sufficient to support a committed bid within the current market cycle. The White site mechanism also signals flexibility: if the residential market softens before design completion, the developer can weight the mix toward commercial and serviced apartment uses.

For existing JLD residential owners — in projects like J Gateway, Lake Grande, Twin Vew, and the upcoming The LakeGarden Residences — the Town Hall Link development represents both an opportunity (improved amenity and connectivity as the precinct builds out) and a risk (increased residential supply within the immediate catchment). On balance, the infrastructure and amenity uplift from the New Science Centre, Jurong Gateway Hub, and CRL CR19 is likely to outweigh the supply effect, particularly for well-located existing units.

What Might Come Next

The following is editorial commentary — not official guidance.

Bidding for the Town Hall Link site is expected to attract Singapore’s larger developers and possibly joint ventures. The scale of the site (186,139 sqm) requires significant capital — a land price in the S$1.5–S$2.5 billion range would not be surprising, depending on the assumed residential launch pricing and the developer’s commercial income projections. International developers with Asian regional headquarters-in-a-hub ambitions could also consider the mandatory 40,000 sqm office component as a corporate campus opportunity.

The CRL CR19 station opening in 2032 is a known future catalyst — developers will model this into their land bid assumptions. A project that launches residential units in 2028–2029 (assuming a 2027 tender award, 1-year design/approval, and early 2028 launch) would be telling buyers that their units will be CRL-connected by the time they reach the 5-year mark of ownership.

Frequently Asked Questions

What does “White site” mean for buyers of the eventual development?

A White site designation affects the developer’s design choices, not individual buyers’ rights. When the eventual development is launched for sale, buyers will purchase units in a standard private condominium development. They will benefit from the mixed-use amenities — retail, food and beverage, possibly a hotel or serviced apartment building within the same development — that result from the White site configuration. The White site label itself conveys no special lease conditions or restrictions on buyers beyond the standard conditions of a freehold or 99-year leasehold private condominium.

When will the residential units at Town Hall Link be available for sale?

The tender closes 17 November 2026. Assuming the tender is awarded in Q1 2027, and accounting for design, planning approval, and construction timelines, the earliest a residential launch could realistically occur is late 2027 or 2028. Physical completion (Temporary Occupation Permit) would likely follow in 2030–2032. Prospective buyers interested in this development should monitor URA and the awarded developer’s announcements in 2027.

How does the JLD CRL station affect property values nearby?

Historical evidence from Singapore MRT openings — most recently the Thomson-East Coast Line (TEL) stages 1–4 and the Downtown Line — suggests that residential properties within 500 metres of a new MRT station tend to appreciate by 8–15% relative to comparable properties further away in the 3–5 years following station opening. The effect is partially priced in ahead of the opening as buyers and investors anticipate the connectivity uplift. For CR19 (planned 2032), properties in the immediate JLD precinct likely already incorporate some forward-looking CRL premium in 2026. The full premium crystallises as the opening date approaches and actual connectivity is confirmed.

Is the Town Hall Link site freehold or leasehold?

GLS sites in Singapore are typically sold on 99-year leasehold terms. The Town Hall Link site is expected to follow this standard. Buyers of units in the eventual development will hold 99-year leasehold titles, with the lease commencement date tied to the date of the land award. Leasehold tenure is the norm for new GLS-sourced developments in Singapore; the premium-location attributes of the site — MRT connectivity, JLD masterplan, CRL uplift — are expected to sustain long-term value notwithstanding the leasehold structure.

What other major GLS sites were launched in 2H 2026?

The 2H 2026 GLS Confirmed List provides a total of 4,745 private residential units. In addition to the Town Hall Link White site, URA also launched sites at Lorong Puntong/Sin Ming Avenue (~140 units, TEL Bright Hill MRT, tender closes 15 September 2026) and Kitchener Link (~145 units, Reserve List, Farrer Park MRT NEL). The full 2H 2026 GLS programme — including industrial and commercial sites — is available on the URA website at ura.gov.sg/land-sales.

Related Articles

Disclaimer

This article is for general informational purposes only and does not constitute financial or investment advice. Details of the Town Hall Link White site are sourced from URA press release pr26-53 (3 July 2026) and the URA website. Developer bidding, design outcomes, launch pricing, and project timelines are speculative editorial commentary and do not represent commitments by URA or any developer. For authoritative site details and tender conditions, refer to ura.gov.sg. Consult a licensed financial adviser before making any property investment decision.

URA Q2 2026 Singapore Property Price Index: Market Softens as CCR Rebounds

URA Q2 2026 Singapore Property Price Index: Market Softens as CCR Rebounds

Quick Answer: URA Q2 2026 PPI Flash Estimate

  • Overall PPI: +0.5% QoQ — a deceleration from +0.9% in Q1 2026. Prices are still rising but at a slower pace.
  • Core Central Region (CCR) rebounded: +2.0% (vs +0.6% in Q1 2026) — luxury segment recovering after two quarters of underperformance.
  • Rest of Central Region (RCR): −1.4% (vs +0.8% in Q1) — notable reversal; high-priced new launches in this segment may have peaked.
  • Outside Central Region (OCR): −0.2% (vs +2.2% in Q1) — mass market segment cools after a strong Q1.
  • Landed properties: +2.6% (vs −0.4% in Q1) — sharp rebound in the landed segment, driven by supply scarcity.
  • Transaction volume: 5,420 units (up to mid-June) — broadly comparable to Q1’s 5,413. No supply glut or demand collapse.
  • Government response: 2H 2026 Confirmed List GLS supply = 4,745 units; full-year 2026 Confirmed List = 9,320 units, over 50% above the 10-year average.
  • Full Q2 statistics will be released by URA on 24 July 2026.

Singapore Q2 2026 Private Residential Property Prices: A Measured Softening

Singapore’s private residential property market continued its gradual moderation in the second quarter of 2026, according to the flash estimate released by the Urban Redevelopment Authority (URA) on 1 July 2026. The overall Private Residential Property Price Index (PPI) rose by 0.5% on a quarter-on-quarter basis — a visible step down from the 0.9% gain recorded in Q1 2026 and a world away from the 3%+ quarterly swings seen during the 2021–2022 boom.

The headline figure conceals a striking divergence beneath the surface: the Core Central Region (CCR) — Singapore’s luxury prime district covering the traditional Central Business District fringe, Orchard Road, and Sentosa Cove — rebounded strongly with a 2.0% gain, while the Rest of Central Region (RCR) and Outside Central Region (OCR) recorded modest declines of 1.4% and 0.2% respectively. Landed properties, which had dipped 0.4% in Q1, surged 2.6% in Q2 — reflecting the structural supply scarcity of this asset class.

The flash estimate is based on transaction prices submitted for stamp duty payment and developer sales data from 1 April 2026 up to mid-June 2026. The full Q2 2026 real estate statistics — covering HDB resale, rental, and the complete development pipeline — will be published by URA on 24 July 2026.

URA Q2 2026 private residential property price index flash estimate QoQ by segment CCR RCR OCR Singapore

Figure 1: URA Q2 2026 PPI flash estimate — quarter-on-quarter % change by segment, compared to Q1 2026. Source: URA press release pr26-51, 1 July 2026.

Segment-by-Segment Analysis

Segment Q1 2026 QoQ % Q2 2026 Flash QoQ % Direction
Overall PPI +0.9% +0.5% ↓ Deceleration
Non-Landed Overall +1.3% −0.1% ↓ Turned Negative
CCR (Core Central Region) +0.6% +2.0% ↑ Sharp Recovery
RCR (Rest of Central Region) +0.8% −1.4% ↓ Sharp Reversal
OCR (Outside Central Region) +2.2% −0.2% ↓ Turned Negative
Landed Properties −0.4% +2.6% ↑ Sharp Rebound

CCR rebound: The 2.0% CCR gain in Q2 is the strongest single-quarter reading for this segment since early 2024. The CCR has historically lagged the OCR/RCR recovery because foreign buying — the CCR’s key demand driver — was hit hardest by the April 2023 cooling measures (which raised the foreigners’ ABSD from 30% to 60%). The Q2 2026 recovery suggests that either (a) some internationally mobile buyers are re-engaging despite the 60% ABSD, or (b) domestic upgrader demand from Singaporeans and PRs is filling the luxury segment. The URA’s full Q2 data release on 24 July will shed more light on the transaction mix.

RCR contraction: The −1.4% RCR reading is notable. The RCR has been the market’s most active new-launch corridor, with several high-profile projects launching in 2025–2026 at elevated per-square-foot prices. A reversion in Q2 may reflect buyers’ price resistance after the aggressive pricing of some recent launches, combined with increased competition from HDB upgraders who are now also being drawn by improving BTO supply timelines.

Landed recovery: The 2.6% landed rebound follows a brief Q1 pause. Singapore’s landed housing supply is essentially fixed — there is virtually no new landed housing land being released — and as such, landed prices reflect pure demand dynamics. The Q2 strength likely reflects pent-up demand from local ultra-high-net-worth families who had been watching the market from the sidelines.

Transaction Volume: Stable, Not Surging

Sale transaction volume for Q2 2026 (up to mid-June) totalled 5,420 units, broadly comparable to Q1 2026’s 5,413 units. This stability is significant: it indicates that the market is transacting at a healthy pace without the frenzied turnover of 2021–2022 (when quarterly volumes regularly exceeded 6,000–7,000 units). A market that transacts steadily at moderate volumes — without speculative churning — is precisely what Singapore’s property policy framework has been calibrated to achieve.

The comparable volume across Q1 and Q2, combined with decelerating overall price growth, is broadly consistent with URA’s characterisation of the market as “broadly stable.” There is no sign of a demand-side collapse, nor of a renewed speculative surge.

Government Policy Response: GLS Supply Elevated

In its press release accompanying the Q2 2026 flash estimate, URA noted that the Government is sustaining a high and steady supply of private housing through the Government Land Sales (GLS) Programme. Key supply data:

  • 2H 2026 Confirmed List: 4,745 private residential units to be launched.
  • Full-year 2026 Confirmed List: 9,320 units — over 50% higher than the past 10-year annual average of approximately 6,100 units.
  • Total pipeline (including ECs): around 61,000 private residential units expected to be completed over the next few years.
GLS confirmed list supply 2026 versus 10 year average Singapore government land sales

Figure 2: GLS Confirmed List supply — 2026 full year at 9,320 units is more than 50% above the 10-year average, reflecting the government’s commitment to market stability. Source: URA.

What This Means for Property Buyers and Sellers

For buyers, the Q2 2026 data reinforces a cautious but constructive outlook. The market is not in free fall, but neither is it in a runaway boom. Price growth is positive but subdued at the overall level, meaning buyers who act carefully — securing financing, doing diligent market research, and buying at realistic prices — are unlikely to face an immediately adverse market movement. The government’s elevated GLS supply commitment over the coming years means that the supply pipeline will continue to exert a moderating influence on prices in the medium term.

For sellers, the divergence between CCR strength and RCR/OCR softness matters. Sellers of mass-market condominiums in the RCR and OCR face a more challenging environment than they did in early 2026, when Q1 showed strong gains. Setting realistic asking prices — based on recent comparable transactions rather than the 2021–2022 peak — will be critical to achieving timely sales.

URA reminds buyers that “the macroeconomic outlook remains highly uncertain,” and that “households are advised to exercise prudence when purchasing property and taking out mortgage loans.” In a global environment where interest rates remain elevated and economic uncertainty persists, this is sound counsel.

What Might Come Next

The following is analytical commentary — not official guidance.

The Q2 2026 flash PPI reading, combined with the full-year supply trajectory, suggests the most likely scenario is continued modest positive overall price growth through H2 2026 — perhaps in the +0.2% to +0.8% range per quarter — with the CCR outperforming and OCR/RCR remaining relatively flat or slightly negative. A material downside scenario (sharp price falls) would require a severe external shock — a global recession, a sharp rise in Singapore unemployment, or a significant tightening of MAS monetary conditions. None of these appear imminent as at early July 2026.

The June 2026 JLD White Site tender launched by URA (Town Hall Link; tender closes 17 November 2026) adds a significant new mixed-use supply node to the western corridor. Investor sentiment around this site will be a useful bellwether for developer confidence in the H2 2026 market — a strong bid premium would signal that private developers remain bullish despite the moderating price environment.

Frequently Asked Questions

What is the URA PPI and how is it calculated?

The URA Private Residential Property Price Index (PPI) measures the change in prices of private residential properties in Singapore on a quarterly basis. It is compiled by URA using transaction data from stamp duty submissions and developer sale returns, covering all private residential transactions (both new sales and resale). The index uses a hedonic regression model that controls for property characteristics (size, location, floor level, age) to isolate pure price change from changes in the mix of properties transacted. The flash estimate, released around the first day of the following quarter, is a preliminary reading based on transactions up to mid-quarter; the full estimate, released three to four weeks later, incorporates complete quarter data and may differ from the flash figure.

Why did CCR prices rise so sharply in Q2 2026?

The CCR’s 2.0% rebound likely reflects a combination of factors: (1) limited new CCR supply coming to market in Q2 2026, creating upward price pressure on the available stock; (2) renewed demand from Singapore Citizens and PRs upgrading to prime-district condominiums, partially replacing the foreign demand that was curtailed by the 2023 cooling measures; and (3) the delayed effect of earlier GLS site launches around the Orchard / River Valley / Marina Bay corridors. The CCR has historically been more volatile than OCR/RCR — large individual transactions can move the segment average. The full Q2 data release on 24 July 2026 will clarify whether this rebound is broad-based or driven by a handful of high-value transactions.

What is 61,000 units in pipeline mean for future prices?

URA’s announcement that approximately 61,000 private residential units (including executive condominiums) are expected to be completed “in the next few years” represents a substantial supply pipeline. As a reference point, annual demand for private homes in Singapore has typically ranged from 8,000 to 13,000 units per year over the past decade. A pipeline of 61,000 units spread over approximately 5–6 years implies a continued period of elevated completions that is expected to moderate demand-supply imbalances and limit sharp price appreciation. This is a deliberate policy signal from the government: it is committed to keeping supply well ahead of demand to prevent the kind of price spike seen in 2021–2022.

Should I buy now or wait for the full Q2 data on 24 July 2026?

For most buyers, the difference between the flash estimate and the full Q2 data release (on 24 July 2026) will be immaterial to their purchase decision. The flash estimate is generally close to the final figure. Waiting for the full release — if you are ready to buy and have found a suitable property — is unlikely to reveal a dramatically different picture. More meaningful than the index number is individual property pricing relative to comparable transactions, your personal financing capacity, and your long-term holding horizon. The PPI is a broad market average; individual properties in specific locations can diverge significantly from the average.

Is now a good time to invest in Singapore property given this data?

This article does not constitute financial advice. The Q2 2026 data presents a mixed but broadly stable picture: limited overall price growth, elevated supply pipeline, divergent performance across segments. For owner-occupiers, Singapore property remains a significant but generally sound long-term asset — the fundamentals (limited land, stable governance, strong rule of law, robust demand from domestic upgraders) are intact. For investors, the combination of elevated ABSD (for second-property and foreign purchases), 4% SSD on early disposals, moderate rental yields (typically 2.5%–3.5% for private condominiums), and elevated mortgage rates means that the return calculus is tighter than it was in 2019 or 2021. Independent financial advice from a licensed professional is strongly recommended before making any investment property decision.

Related Articles

Disclaimer

This article is for general informational purposes only and does not constitute financial or investment advice. Property market data is sourced from URA press release pr26-51 (1 July 2026) and supplementary URA publications. All analysis and projections are LovelyHomes editorial commentary and should not be relied upon as predictions of future prices or market movements. For authoritative data, refer to www.ura.gov.sg. Before making any property purchase or investment decision, consult a licensed financial adviser and a licensed real estate salesperson registered with the Council for Estate Agencies (CEA).

Singapore Luxury Homes and Safe-Haven Demand: CCR Surges +2.0% in Q2 2026

Singapore Luxury Homes and Safe-Haven Demand: CCR Surges +2.0% in Q2 2026

Quick Answer: What Is Driving Singapore Luxury Home Sales in 2026?

  • Singapore’s Core Central Region (CCR) posted a +2.0% price increase in Q2 2026 — the strongest of any market segment and a sharp reversal from Q1’s tepid +0.6%.
  • Industry observers and URA data point to a safe-haven demand thesis: high-net-worth individuals from Asia and globally are channelling wealth into Singapore amid geopolitical uncertainty in 2026.
  • Good Class Bungalow (GCB) deals in H1 2026 are reported to average S$2,121 per square foot — near all-time highs despite lower transaction volumes.
  • Foreigner buying share of private residential transactions remains below 2% due to the 65% ABSD, but dollar volumes in the CCR continue to outpace other regions.
  • The luxury market is bifurcating: sub-S$3M OCR and RCR condos are softening (OCR -0.2%, RCR -1.4% in Q2 2026), while trophy assets above S$5M are tightening.
  • Singapore’s combination of rule of law, no capital gains tax, SGD strength, and geopolitical neutrality underpins its premium positioning among global wealth management centres.
  • Full Q2 2026 transaction data is expected from URA on 24 July 2026 — the flash estimate published 1 July 2026 covers pricing only, not full volumes.

CCR Surges 2.0% in Q2 2026 as Luxury Demand Returns

Singapore’s Core Central Region (CCR) property market recorded a 2.0% price increase in Q2 2026, according to the Urban Redevelopment Authority’s flash estimate released on 1 July 2026. This makes the CCR the best-performing segment of the entire private residential market for the quarter — outpacing the overall market gain of 0.5% and standing in sharp contrast to the Rest of Central Region (RCR, -1.4%) and Outside Central Region (OCR, -0.2%), which both posted price declines.

The CCR’s outperformance is particularly notable given the backdrop: the wider Singapore private residential market has been moderating since early 2025, with the URA Private Property Price Index (PPI) recording gains of just 0.9% in Q1 2026 and 0.5% in Q2 2026 — well below the 8.4% full-year gain of 2023. The surge in CCR prices reflects a specific dynamic: demand from wealth-preserving investors, both domestic and international, for premium Singapore residential assets.

The Safe-Haven Thesis: Why Singapore Is Attracting Global Wealth

Industry observers note that Singapore’s luxury property market has increasingly attracted demand driven not by speculative gain but by wealth preservation. Several structural factors reinforce Singapore’s position as a premium repository of global capital in 2026.

Geopolitical diversification: Ongoing conflicts in Europe, rising trade tensions between the United States and China, and political uncertainty in multiple Southeast Asian nations have prompted high-net-worth individuals to diversify their real-asset holdings into jurisdictions perceived as politically stable. Singapore — with its neutral foreign policy, independent judiciary, and transparent legal framework — is among a short list of global cities offering this combination.

No capital gains tax: Singapore does not tax capital gains on property disposal (subject to the IRAS’s anti-speculation rules around short-term trading). For investors holding a property for more than three years, any appreciation is fully exempt from tax. This contrasts sharply with major competing markets: the United Kingdom taxes property gains at 18–28%, Australia at the marginal income rate, and Hong Kong at stamp duty and property tax regimes that have been progressively tightened.

Singapore Dollar resilience: The Monetary Authority of Singapore (MAS) manages the Singapore Dollar within a policy band that has delivered steady appreciation against a trade-weighted basket since the 1980s. For USD or EUR-denominated investors, Singapore property effectively provides implicit currency protection alongside the real-asset yield.

Rule of law and property rights: Singapore property title is freehold or 99-year leasehold under a clear and well-enforced framework. Title searches are transparent, conveyancing is regulated, and disputes are adjudicated by courts with a strong track record of enforcing property rights. There is no risk of compulsory acquisition without fair compensation under the Land Acquisition Act.

Singapore private residential property price index CCR RCR OCR Q1 Q2 2026 URA flash estimate
Figure 1: Singapore Private Residential PPI — Q1 vs Q2 2026 by Market Segment. Source: URA (Q2 based on flash estimate, 1 July 2026).

The Luxury Segment in Numbers: What the Data Shows

The Q2 2026 URA flash estimate provides pricing data but not full transaction volumes — those will be released with the full Q2 statistics on approximately 24 July 2026. However, the H1 2026 market narrative is already forming from the available data points.

Market Segment Q1 2026 PPI Change Q2 2026 PPI Change (Flash) H1 2026 Direction
Overall Private Residential +0.9% +0.5% Moderating
Non-Landed Overall +1.3% -0.1% Softening
CCR (Core Central Region) +0.6% +2.0% Accelerating
RCR (Rest of Central Region) +0.8% -1.4% Correcting
OCR (Outside Central Region) +2.2% -0.2% Cooling
Landed Residential -0.4% +2.6% Rebounding

The data shows a clear bifurcation: mid-market mass-market condominiums (OCR and RCR) are softening or correcting, while the premium CCR segment and landed residential — the two categories most associated with high-net-worth buying — are strengthening. This is consistent with the safe-haven demand thesis: wealth-preserving buyers are focused on premium Singapore assets, not the mass-market segment where supply from new GLS sites is more acute.

Landed residential and GCBs: Industry data cited in market commentary indicates that Good Class Bungalow (GCB) transactions in H1 2026 averaged approximately S$2,121 per square foot — near historical highs. While GCB volume has been subdued (fewer than 20–30 transactions per half typically), the average transacted PSF points to the depth of demand at the very top of the market. GCBs are the only residential asset class in Singapore where the absolute supply is fixed by planning policy: there are approximately 2,800 GCB plots gazetted in 39 designated GCB Areas, and no new GCB land has been released since the 1990s.

ABSD as a Structural Filter: Who Is Still Buying at the Top End?

The 65% ABSD for foreigners did not eliminate luxury CCR buying — it filtered it. At the S$5 million price point, a foreign buyer pays S$3,250,000 in ABSD alone. The buyers who can absorb this cost are a qualitatively different group from the pre-2023 foreign luxury buyer cohort: predominantly ultra-high-net-worth (UHNW) individuals or family offices for whom the ABSD represents a tolerable cost of admission to a prized asset class rather than a prohibitive barrier.

The primary luxury buyer base in 2026 remains Singapore Citizens and PRs, who face no ABSD (SC 1st property) or 5% ABSD (SPR 1st property) respectively. Singapore-based UHNW families who have grown their wealth over the past two decades through private equity, technology, or trade finance are the backbone of CCR demand. A secondary and growing segment is foreign family office principals who have established Single Family Office (SFO) structures in Singapore under the Monetary Authority of Singapore’s SFO incentive framework — these are resident in Singapore and may qualify for SC or PR status over time.

What This Means for Property Buyers in Singapore

The CCR’s Q2 2026 outperformance is both a market signal and a policy-test. It signals that the ultra-premium segment is resilient to macroeconomic headwinds and retains structural demand even at historically high price levels. The question for the government is whether this resilience in the top tier justifies ongoing caution about relaxing the foreigner ABSD — or whether the bifurcation (luxury up, mass-market softening) suggests the cooling measures are having their intended effect of segmenting demand without depressing the overall market.

For Singapore Citizens and PRs looking at the CCR, the data suggests that the window of Q4 2025 / Q1 2026 softness (CCR posted only +0.6% in Q1) may have already passed. If the CCR’s Q2 2026 momentum carries into Q3, the entry window could narrow further. Buyers targeting premium properties — Orchard Road, Sentosa Cove, River Valley, Buona Vista — may find pricing firming through the second half of 2026.

What Might Come Next

The full Q2 2026 private residential statistics from URA (expected 24 July 2026) will reveal whether the CCR volume recovery matched the price recovery. If CCR transaction volumes in Q2 2026 show a meaningful uptick from the subdued Q1 levels, it would confirm the demand recovery is broad-based rather than driven by a small number of high-value transactions. Conversely, a further Q3 2026 reading above +1.5% CCR PPI growth could bring the CCR back onto the radar of the government’s cooling measure review — though any specific policy response ahead of the next scheduled review is speculative.

The full Q2 2026 HDB resale statistics (expected from HDB around 23 July 2026) will provide a complementary read on the mass-market segment — and whether the flash estimate’s -0.3% RPI decline was accurately captured. Taken together, the two data releases in late July 2026 will give the market its clearest picture yet of whether Singapore’s property bifurcation — luxury strengthening, mass-market moderating — is the dominant theme for H2 2026.

Frequently Asked Questions

Why is the CCR doing better than the RCR and OCR in 2026?

The Core Central Region comprises Districts 1–4 and 9–11 — the prime downtown and Orchard Road belt. It attracts a qualitatively different buyer profile: high-income Singapore residents, wealth-preserving investors, and family office principals. This cohort is less sensitive to interest rate cycles and supply pipeline impacts because they are buying premium or trophy assets rather than investment units. In contrast, the RCR and OCR have seen more mid-market supply from new Government Land Sales (GLS) sites, and their buyer base — including upgraders and first-time condo buyers — is more sensitive to mortgage rates and HDB resale price trends.

Can foreigners still buy Singapore luxury property given the 65% ABSD?

Yes, but the economics have changed dramatically since the April 2023 cooling measures. On a S$5 million CCR condo, a foreign buyer faces S$3,250,000 in ABSD alone. This effectively restricts the foreign luxury buyer market to ultra-high-net-worth individuals or family office structures where the ABSD is an acceptable cost of entry. MAS data suggests foreign buyer volumes remain below 2% of all private residential transactions — but their average deal size is materially higher than the market average, meaning they contribute disproportionately to CCR dollar volume.

What is a Good Class Bungalow (GCB) and why are prices so high?

Good Class Bungalows are the most exclusive form of landed residential property in Singapore, located within 39 designated GCB Areas gazetted under the URA Master Plan. GCBs must occupy a minimum land area of 1,400 square metres (about 15,000 sqft) and are subject to strict development controls. The supply is fixed at approximately 2,800 plots — no new GCB land has been created since the 1990s. Combined with strong demand from Singapore’s wealthiest families and a long-standing restriction on foreign ownership (SLA approval required), GCBs represent the most inelastic supply in the Singapore property market. Average transacted PSF of approximately S$2,121 in H1 2026 reflects this structural scarcity premium.

When will the full Q2 2026 property transaction data be released?

The Urban Redevelopment Authority typically releases full quarterly private residential statistics approximately 3–4 weeks after the quarter ends. The Q2 2026 flash estimate (covering the PPI only) was released on 1 July 2026. The full data — including transaction volumes, unit counts, new sales, sub-sales, and resale transactions by region and property type — is expected around 24 July 2026. LovelyHomes will cover the full release when it is published. For HDB resale statistics, the Q2 2026 full data (including median prices by flat type and town) is expected around 23 July 2026.

Is Singapore’s luxury property market in a bubble?

This is a contested question among market analysts. Arguments against a bubble: Singapore property prices are underpinned by genuine end-use demand, a restricted land supply, and government cooling measures that actively suppress speculative demand; the ABSD itself is the most powerful anti-bubble tool in the market. Arguments for caution: CCR prices are near historical highs on a PSF basis; low transaction volumes mean that a small number of trophy deals can move the index; and if global macroeconomic conditions worsen materially — reducing the “safe-haven” narrative — demand could soften quickly. The MAS monitors private residential price trends closely through its Financial Stability Review process, and will act if it assesses that price growth is becoming detached from fundamentals. As at July 2026, the government has not signalled any concern about a bubble in the CCR.

Related Articles

Disclaimer: This article is for general information and editorial purposes only. Property market data is sourced from URA’s Q2 2026 flash estimate (released 1 July 2026) — full Q2 2026 data is expected on approximately 24 July 2026. GCB and luxury transaction figures are indicative industry data. This article does not constitute investment advice. Readers should conduct their own research and seek qualified advice before making any property or investment decisions. LovelyHomes.com.sg is not a licensed real estate agency.

URA GLS 1H2026: New Residential Sites at Lorong Puntong/Sin Ming Avenue and Kitchener Link

URA GLS 1H2026: New Residential Sites at Lorong Puntong/Sin Ming Avenue and Kitchener Link

⚡ Quick Answer: URA 1H2026 GLS — Two New Sites Released 25 June 2026

  • On 25 June 2026, URA released two new residential sites under the 1H2026 GLS Programme.
  • Lorong Puntong / Sin Ming Avenue — near Bright Hill MRT (TEL Stage 3), ~140 units, Confirmed List, tender closes 15 September 2026.
  • Kitchener Link — near Farrer Park MRT (NEL), ~145 units, Reserve List (developer application required).
  • Combined potential yield: approximately 285 new private residential units.
  • Lorong Puntong is part of the Sin Ming residential transformation adjacent to the Bright Hill MRT interchange; Kitchener Link taps Farrer Park’s strong healthcare-driven rental market.

URA Releases Two GLS Sites on 25 June 2026

The Urban Redevelopment Authority (URA) announced on 25 June 2026 the release of two residential sites for sale under the first half of 2026 (1H2026) Government Land Sales Programme. The two sites — at Lorong Puntong/Sin Ming Avenue in Bishan and at Kitchener Link near Farrer Park — represent different tiers of the GLS mechanism: the Sin Ming site is on the Confirmed List (it will be tendered regardless of developer interest), while Kitchener Link is on the Reserve List (a developer must first submit a sufficiently high application price to trigger the tender).

These releases form part of Singapore’s broader housing supply pipeline. The 1H2026 GLS programme was announced in December 2025 with 5,050 private residential units and 3,455 executive condominium (EC) units on offer — a total pipeline of approximately 8,505 units across both Confirmed and Reserve Lists. The Lorong Puntong and Kitchener Link releases bring two additional parcels in the 1H2026 programme to market.

URA GLS June 2026 site comparison Lorong Puntong Sin Ming Avenue versus Kitchener Link residential sites

Figure 1: Key facts comparison — Lorong Puntong/Sin Ming Avenue (Confirmed List) versus Kitchener Link (Reserve List). Source: URA, 25 June 2026.

Site 1: Lorong Puntong / Sin Ming Avenue — Bright Hill MRT Catchment

The Lorong Puntong/Sin Ming Avenue site is located in the Sin Ming planning area, within the broader Bishan/Upper Thomson precinct. Its most significant attribute is proximity to Bright Hill MRT station — the Thomson-East Coast Line (TEL) Stage 3 station that serves the Sin Ming/Upper Thomson Road corridor and will also connect to the Cross Island Line (CRL) when the CRL’s eastern extension opens. Sin Ming Avenue has historically been a light industrial and automotive area; the release of a residential GLS site here is a deliberate planning signal that URA is guiding the gradual residential transformation of the Sin Ming corridor as TEL and CRL connectivity uplift its residential attractiveness.

The site can potentially yield approximately 140 residential units. Industry expectations for the bid quantum fall in the range of S$680–820 psf per plot ratio (ppr), based on comparable land transactions in the D20 catchment. The tender closes on 15 September 2026 at 12 noon. A successful award in Q4 2026 would position a new launch for 2027–2028 at estimated prices of S$2,000–2,400 psf, if comparable to existing condos such as those along Thomson Road and Upper Thomson.

Site 2: Kitchener Link — Farrer Park Reserve List Addition

The Kitchener Link site is within the Farrer Park planning area in District 8, adjacent to Farrer Park MRT station on the North East Line (NEL). Farrer Park has seen steady demand from healthcare workers employed at nearby Connexion (the integrated medical hub) and Tan Tock Seng Hospital. As a Reserve List site, Kitchener Link will only be tendered if a developer submits an acceptable minimum-price application to URA — a demand-sensing mechanism that prevents oversupply when market sentiment is weak.

The site can potentially yield approximately 145 residential units. Comparable land in D8 has transacted in the S$1,050–1,200 psf ppr range in recent tender cycles, suggesting a potential launch price of S$2,100–2,500 psf for a new development here, consistent with resale values in the Farrer Park condo market today.

1H2026 GLS Programme: Where These Sites Fit

Site List Type Est. Units Key Transport Tender / Status
Lorong Puntong / Sin Ming Ave Confirmed ~140 Bright Hill MRT (TEL) Closes 15 Sep 2026
Kitchener Link Reserve ~145 Farrer Park MRT (NEL) Application required
Peck Hay Road (awarded Jun 2026) Confirmed ~220 Newton MRT (NSL/DTL) Awarded Jun 2026
River Valley Green Parcel C (awarded Jun 2026) Confirmed ~350 Havelock MRT (TEL) Awarded Jun 2026
JLD White Site (launched Jul 2026) White Site ~1,200+ Jurong Lake District Launched Jul 2026

The June 2026 GLS releases follow a busy first half for URA land sales. River Valley Green Parcel C was awarded in June 2026 (to CDL at approximately S$1,325 psf ppr), and Peck Hay Road near Newton was also awarded in June. The Jurong Lake District white site was formally launched in July 2026. Against this backdrop, Lorong Puntong and Kitchener Link represent smaller, more surgical supply additions rather than market-moving mega-sites.

What This Means for Buyers and Investors

For buyers evaluating resale condos in the Sin Ming/Upper Thomson and Farrer Park micro-markets, the GLS releases signal new supply entering in 2027–2028 (assuming a standard 3–4 year construction timeline from award to Temporary Occupation Permit). This may create modest pricing competition for older resale stock at launch in those years. However, for capital appreciation investors, the Sin Ming GLS release is a positive long-term signal: URA’s conversion of industrial land to residential use endorses the Bright Hill MRT’s transformative effect on the corridor, and buyers who enter the precinct now may benefit from the full value uplift before new supply arrives.

For the Kitchener Link site, triggering depends on developer confidence in the D8 condo market. If CCR/RCR sentiment remains stable through late 2026, it is likely a developer will submit a trigger application in H2 2026 or H1 2027.

Frequently Asked Questions

What is the difference between a Confirmed List and Reserve List GLS site?

A Confirmed List site is put out for public tender by URA regardless of developer interest — it will be sold. A Reserve List site is only tendered if a developer submits a minimum acceptable price application first. This two-track system lets URA release supply systematically (Confirmed) while maintaining a buffer of ready-to-activate land that responds to actual market demand (Reserve). Reserve List sites are not “less desirable” — they are simply a policy mechanism to avoid releasing land faster than the market can absorb.

When could a new condo at the Sin Ming/Lorong Puntong site launch for sale?

If the Lorong Puntong/Sin Ming Avenue tender closes 15 September 2026 and is awarded in Q4 2026, a developer would typically spend 12–18 months on planning approvals and design before a sales launch. An early preview or public launch could therefore occur in late 2027 or early 2028, with keys (Temporary Occupation Permit) expected by 2030–2031 based on standard construction timelines. Buyers should monitor URA’s tender award announcements and developer project registration notices.

Can foreigners buy units in the new condos developed on these sites?

Yes. Both sites are zoned non-landed private residential, and resulting condominiums are open to Singapore Citizens, Permanent Residents, and foreigners — subject to applicable ABSD rates. Foreign buyers currently pay 60% ABSD. Singapore Citizens pay no ABSD on a first property purchase, and 20% ABSD on a second. The ABSD framework applies uniformly to new launches and resale private condominiums.

How does the Kitchener Link Reserve List site get triggered?

A developer must submit a formal written application to URA with a minimum acceptable price. If URA finds the application price acceptable, it launches a public tender within approximately 8 weeks. The triggering developer then competes openly against other bidders — there is no guaranteed right of purchase just from submitting the trigger application. If no developer submits an acceptable application price, the site remains dormant on the Reserve List.

Where can I find the full URA press release for these two GLS sites?

The official URA press release (pr26-49, 25 June 2026) is available at the URA website under Media Releases. The Lorong Puntong/Sin Ming Avenue tender details are listed under URA’s sites-for-tender page, and the Kitchener Link details appear on the sites-for-application page. Both pages are accessible at ura.gov.sg. The eDeveloper’s Packets with full conditions of tender are available for purchase through URA’s One-Stop Developer Portal.

Related Articles

Disclaimer: This article is for general information purposes only and is based on URA press release pr26-49 (25 June 2026) and publicly available GLS data. Indicative tender bid and launch price estimates reflect LovelyHomes’ own analysis and do not constitute financial or investment advice. Readers should verify all GLS details directly with the Urban Redevelopment Authority (ura.gov.sg) before making any property purchasing or investment decision.

HDB Resale Prices Fall for Second Consecutive Quarter in Q2 2026: RPI Slips to 202.7

HDB Resale Prices Fall for Second Consecutive Quarter in Q2 2026: RPI Slips to 202.7

×Click or press Esc to close
Quick Answer — HDB Resale Q2 2026 Flash Estimates

  • The HDB Resale Price Index (RPI) fell 0.3% in Q2 2026 (quarter-on-quarter), bringing the index to 202.7. This is the second consecutive quarterly decline.
  • Combined with Q1 2026’s −0.1%, this marks the first back-to-back decline since the four-quarter fall from Q3 2018 to Q2 2019.
  • Resale volume in Q2 2026: 6,268 transactions — nearly unchanged from Q1’s 6,285, but the 1H 2026 total of 12,553 is 8.3% below 1H 2025’s 13,692.
  • Million-dollar flat transactions rose to 491 in Q2 2026 alone, bringing 1H 2026 to 902 — surpassing the 763 recorded in all of 1H 2025.
  • These are flash estimates released by HDB on 1 July 2026; full Q2 2026 statistics are expected around 23 July 2026.
  • The decline reflects the combined impact of property cooling measures (15-month wait-out period, tightened HDB loan conditions introduced in 2023–2024) and increased BTO supply.
  • Private property prices rose 0.5% in Q2 2026, widening the gap between the HDB resale and private residential markets.

HDB Resale Prices Slip for the Second Consecutive Quarter

Singapore’s public housing resale market posted its second consecutive quarterly price decline in Q2 2026, according to flash estimates released by the Housing and Development Board (HDB) on 1 July 2026. The HDB Resale Price Index fell 0.3% to 202.7, following the 0.1% dip recorded in Q1 2026.

While the absolute magnitude of the decline remains modest, the back-to-back nature of the falls is significant. Prior to Q1 2026, the HDB resale market had not recorded a single quarterly price decline since Q3 2018 — a stretch of more than six years of unbroken price appreciation that weathered the COVID-19 pandemic, successive rounds of cooling measures, and record-breaking million-dollar flat transactions.

The Q2 2026 data points to a market that is adjusting — gradually but meaningfully — to higher interest rates, an expanded BTO supply pipeline, and the cumulative weight of demand-side cooling measures introduced since September 2022. At the same time, the continued surge in million-dollar flat transactions to 491 in Q2 suggests that the prestige end of the market remains resilient, even as broad prices soften.

HDB resale price index Q2 2026 quarterly change and transaction volume flash estimate Singapore
Figure 1: HDB Resale Price Index — Quarterly % Change (Q2 2025 to Q2 2026 Flash Estimate) and Transaction Volume Comparison 1H 2025 vs 1H 2026. Source: HDB flash estimates, 1 July 2026.

Reading the Data: Three Dimensions

Price: The Second Consecutive Dip

The 0.3% decline in Q2 2026 follows the 0.1% fall in Q1, giving a cumulative 1H 2026 decline of approximately 0.4% from the Q4 2025 peak. In absolute terms, the RPI at 202.7 is approximately 2.5% below the peak recorded in Q3 2023 (estimated 207.8), when a series of aggressive cooling measures first began to deflect demand. For context, the RPI stood at roughly 168 before the pandemic surge of 2020 — meaning prices are still some 20% above pre-pandemic levels even after the current decline.

Volume: Stable Quarter but Down Year-on-Year

At 6,268 transactions, Q2 2026 resale volume was broadly steady versus Q1’s 6,285. The constancy suggests that the market is softening on price, not experiencing a liquidity freeze — there is still a functioning market of willing buyers and sellers. However, the 1H 2026 total of 12,553 transactions is 8.3% below the 13,692 recorded in 1H 2025, signalling that fewer households are choosing to enter or exit the HDB resale market compared to a year ago. This may reflect buyers waiting for BTO completions, or sellers reluctant to accept lower prices.

Million-Dollar Flats: The Paradox of Rising Premium Transactions

The 491 million-dollar resale transactions in Q2 2026 is one of the highest quarterly counts on record, bringing the 1H 2026 total to 902 — compared to 763 in 1H 2025. This appears paradoxical given the broader price decline. The explanation lies in composition: a greater proportion of large, well-located flats (such as mature-estate 5-Rooms, Executive flats in Bishan, Queenstown, and Toa Payoh, and high-floor units with unobstructed views) are transacting at S$1 million or above, even as median prices for standard flat types ease. The million-dollar threshold is increasingly a function of location and flat specifications rather than broad market inflation.

Why Are HDB Resale Prices Falling?

Several structural and policy-driven factors help explain the shift:

  • BTO supply ramp-up: HDB is on track to launch approximately 19,600 new BTO flats in 2026 alone, including major tranches in Tengah, Bedok, and Toa Payoh. A substantial portion of buyers who might otherwise have purchased resale flats are opting to wait for BTO completions, particularly after the government’s introduction of the Plus and Prime flat classifications in 2024 which offer new flats in desirable locations at subsidised prices.
  • 15-month wait-out period: the wait-out period imposed in September 2022 — requiring owners of private residential properties to wait 15 months before purchasing a resale HDB flat — has reduced upgrader-to-downgrader demand for HDB resale. Private property owners who previously used HDB resale as a “cashing out” destination are constrained.
  • Tighter HDB loan criteria: the reduction in HDB concessionary loan LTV from 85% to 80% introduced in 2023, combined with HDB’s stress test at 3.0%, has reduced the maximum loan quantum for some buyers, dampening purchasing power.
  • Interest rate environment: while Singapore interbank rates have moderated from 2022–2023 peaks, bank mortgage rates remain above 2.5%, increasing monthly repayment obligations and constraining affordability relative to the 2019–2020 era when rates were near zero.

What the Data Means for Buyers and Sellers

For buyers, two consecutive declining quarters represent a modest but real opportunity to negotiate. The market is softer than at any point since 2019, and sellers are generally more realistic about pricing than during the frenzy of 2021–2023. However, buyers should not expect a dramatic correction — the fundamental demand for housing in Singapore remains strong, and government policy is explicitly designed to maintain market stability rather than to allow sharp corrections.

For sellers, the data confirms that the period of listing and achieving above-valuation prices within days has passed in most segments. Realistic pricing at or near recent transacted values — checked via HDB’s HDB Resale Flat Prices portal — is now essential for a timely sale. Premium-location flats (mature estates, near MRT, high floor) continue to command strong demand even as median prices ease.

Metric Q1 2026 Q2 2026 (Flash) Change
HDB Resale Price Index (RPI) ~203.3 202.7 −0.3% QoQ
Consecutive quarters of decline 1 (first since 2018) 2 ↑
Resale transactions 6,285 6,268 −0.3%
1H 2026 vs 1H 2025 volume 12,553 vs 13,692 −8.3% YoY
Million-dollar flat transactions 411 (1H total partial) 491 1H total: 902 (+18.2% vs 1H 2025)
Full data release ~23 July 2026 (HDB full Q2 2026 statistics)

Table 1: HDB Resale Market Q2 2026 Flash Estimate Summary. Source: HDB, 1 July 2026.

What Might Come Next

The full Q2 2026 HDB resale statistics — due around 23 July 2026 — will provide complete data including town-by-town breakdowns, flat-type analysis, and cash-over-valuation (COV) trends. LovelyHomes will publish a comprehensive analysis at that time.

Looking ahead, the direction of HDB resale prices through the second half of 2026 will be shaped primarily by the pace of BTO completions and move-ins (which should free up additional resale supply), the trajectory of interest rates in Singapore (closely linked to US Federal Reserve policy), and any policy adjustments HDB may announce in the August or October BTO exercises. Market consensus among analysts tracked by LovelyHomes suggests a further modest decline of 0–1% in Q3 2026 before the market stabilises around year-end.

Frequently Asked Questions

What is the HDB Resale Price Index (RPI) and how is it calculated?

The HDB Resale Price Index is a measure published by the Housing and Development Board that tracks movements in the overall level of resale flat prices in Singapore. It is calculated using a hedonic regression model that controls for factors such as flat type, floor area, storey height, remaining lease, and location, allowing like-for-like comparison across periods. The index base year is Q1 2012 = 100. A reading of 202.7 in Q2 2026 means that prices are broadly 102.7% above Q1 2012 levels. The flash estimate published in the first week of each quarter uses a partial transaction dataset; the final figure is revised approximately three weeks later when the full quarter’s data is available.

Does a second consecutive quarterly decline mean the market is crashing?

No. A cumulative decline of 0.4% over two quarters is far from a crash — by any measure it represents a gentle correction after a multi-year price surge. For context, the 2018–2019 cooling cycle saw four consecutive quarters of decline totalling approximately 4% before prices stabilised and resumed their upward trend. The current environment is different: housing supply is expanding deliberately via BTO, borrowing conditions are tighter, and government policy is actively calibrated to engineer a soft landing rather than a correction. Buyers should view the current data as a modest softening, not a distress signal.

Should I wait for further price falls before buying an HDB resale flat?

Market timing in property is notoriously difficult, even for professional analysts. If your housing need is immediate — for example, you have a growing family, your existing lease is ending, or you have just passed the five-year MOP on your current flat — then market timing is largely irrelevant: the right time to buy is when it meets your household’s needs and financial capacity. If you are buying purely as an investment or as an upgrade with flexibility on timing, then the current softening does offer a more favourable negotiating environment than 2022 or 2023. However, attempting to call the exact bottom is speculative. For personalised financial planning, consult a licensed financial adviser.

Why are million-dollar flat transactions rising even as the overall RPI falls?

The million-dollar threshold is not itself a price index — it is a count of transactions above S$1 million regardless of flat size or type. The rising count reflects several factors: more large flats (5-Room and Executive) in desirable mature estates were completed with MOP five or more years ago and are now entering the resale market; the premium placed on location, floor height, and remaining lease has widened the spread between ordinary and premium flats; and a cohort of upgrading couples with substantial CPF savings and equity from earlier BTO flats are willing to pay for well-located resale units. In essence, the prestige segment is diverging from the mass-market segment within the same index.

When will the full Q2 2026 HDB resale statistics be released?

The full Q2 2026 HDB resale statistics are expected around 23 July 2026, based on HDB’s historical release calendar. The full data will include town-by-town price indices, volume by flat type and estate classification (mature vs non-mature), median resale prices by town, and COV trends. LovelyHomes will publish a comprehensive analysis at that time — see our ongoing Singapore Private Property Market Q2 2026 coverage for context on the broader residential market.

Related Articles

Disclaimer

This article is published by LovelyHomes Editorial Team based on HDB flash estimates released on 1 July 2026. Flash estimates are preliminary and subject to revision when full Q2 2026 data is published (~23 July 2026). Price indices and transaction volumes cited are sourced from HDB.gov.sg. Prior-quarter trend comparisons for indicative RPI changes are approximate. This article does not constitute property, financial, or legal advice. Readers are encouraged to consult official HDB resources and licensed professionals before making any property decision. All figures cited are as at 6 July 2026.

Singapore Private Property Prices Q2 2026: URA Flash Estimate Shows +0.5% Overall, CCR +2.0%, Landed +2.6%

Singapore Private Property Prices Q2 2026: URA Flash Estimate Shows +0.5% Overall, CCR +2.0%, Landed +2.6%

⚡ Key Numbers — URA Q2 2026 Private Residential PPI Flash Estimate

  • Overall PPI: +0.5% quarter-on-quarter in Q2 2026, decelerating from +0.9% in Q1 2026.
  • Non-landed properties (overall): –0.1% in Q2 (vs +1.3% in Q1) — a broad softening across the mass and mid-tier segments.
  • Core Central Region (CCR): +2.0% in Q2 (vs +0.6% in Q1) — the only non-landed segment to accelerate, driven by luxury demand.
  • Rest of Central Region (RCR): –1.4% in Q2 (vs +0.8% in Q1) — the weakest segment this quarter.
  • Outside Central Region (OCR): –0.2% in Q2 (vs +2.2% in Q1) — sharply slower after the strong new-launch-driven Q1 performance.
  • Landed properties: +2.6% in Q2 (vs –0.4% in Q1) — a notable reversal and the strongest segment in Q2.
  • Transaction volume: 5,420 units (up to mid-June 2026), broadly flat versus 5,413 in Q1.
  • Full Q2 statistics to be released by URA on 24 July 2026.

What the URA Flash Estimate Tells Us About Q2 2026

On 1 July 2026, the Urban Redevelopment Authority (URA) released the flash estimate of Singapore’s private residential property price index (PPI) for the second quarter of 2026. The headline figure — a 0.5% quarter-on-quarter increase — confirms a continuing but moderating upward trend in private home prices. The deceleration from Q1’s 0.9% gain reflects a more complex underlying picture: diverging fortunes between CCR luxury units and the mid-tier and mass-market segments, alongside a significant turnaround in landed property pricing.

Flash estimates are compiled from stamp duty submissions and developer sales data covering 1 April to mid-June 2026. URA notes that past estimates have differed from final figures and advises the public to interpret them with caution. The full Q2 dataset — including rental, vacancy and supply statistics — will be released on 24 July 2026.

URA private residential property price index Q1 vs Q2 2026 change by region CCR RCR OCR landed
Figure 1: URA Private Residential Property Price Index — quarter-on-quarter change by segment, Q1 vs Q2 2026. Source: URA Press Release PR26-51 (1 July 2026).

Segment-by-Segment Breakdown

CCR: Luxury Demand Re-Emerges

The Core Central Region posted the strongest non-landed performance in Q2 2026 at +2.0%, up from a modest +0.6% in Q1. The CCR comprises Districts 9, 10, 11 and the Downtown Core and Sentosa Cove — Singapore’s prime and ultra-prime residential markets. The acceleration reflects continued interest from overseas buyers (particularly those from Southeast Asia and Europe), ABSD-resilient demand at the upper end, and limited new launch supply in the CCR pipeline for the remainder of 2026. Several analysts had anticipated a softer CCR following the 60% ABSD rate for foreigners introduced in April 2023; instead, those who remain in the market appear to be purchasing at higher price points.

RCR: Sharpest Correction

The Rest of Central Region posted the weakest result at –1.4% after a +0.8% gain in Q1. The RCR — encompassing the city fringe and established residential neighbourhoods — had benefited strongly from new launch activity in 2024 and early 2025. With fewer significant launches pricing in during Q2 2026 and buyers digesting earlier purchases, the RCR has retreated modestly. This is not unusual: RCR prices tend to be more launch-driven and can oscillate more sharply quarter-to-quarter than the CCR or OCR.

OCR: Post-Launch-Boom Cooling

The Outside Central Region, which drove Singapore’s 2024–2025 private property rally on the back of strong new BTO and EC launches drawing first-timer upgraders, slipped 0.2% in Q2 after a 2.2% surge in Q1. The normalisation is expected — Q1’s exceptional OCR performance was partly attributable to a cluster of well-received project launches recording strong take-up in the Jan–Mar window. Q2’s mild correction suggests that pricing has reached a level where buyers are exercising greater selectivity.

Landed: The Standout Performer

Landed property — comprising detached houses, semi-detached homes and terraces — rebounded sharply to +2.6% in Q2, reversing a –0.4% dip in Q1. The landed market is structurally limited in supply (foreigners cannot purchase landed property without Singapore Land Authority approval, and government resale restrictions apply to certain categories) and tends to recover quickly from short-term softness. The Q2 bounce aligns with a pickup in transaction volumes observed in the Good Class Bungalow (GCB) and semi-detached segments in prime districts.

Supply Context: Record GLS Output in 2026

URA simultaneously highlighted the Government’s sustained GLS (Government Land Sales) programme as the key supply-side stabiliser. The 2H2026 Confirmed List adds 4,745 private residential units, bringing the full-year 2026 Confirmed List total to 9,320 units — more than 50% above the 10-year annual average. When combined with the Reserve List, the total GLS pipeline for 2026 is the largest in over a decade.

Metric Value
Overall PPI change, Q2 2026 +0.5% q-o-q
Non-landed overall –0.1% q-o-q
CCR (non-landed) +2.0% q-o-q
RCR (non-landed) –1.4% q-o-q
OCR (non-landed) –0.2% q-o-q
Landed properties +2.6% q-o-q
Sale volume (to mid-Jun 2026) 5,420 units
Q1 2026 volume (full quarter) 5,413 units
2H2026 GLS Confirmed List 4,745 units
Full-year 2026 Confirmed List 9,320 units (>50% above 10-yr avg)
Expected completions (next few years) ~61,000 units (incl. ECs)
Full Q2 statistics release 24 July 2026

What This Means for Buyers and Investors

📈 Analytical Note

The Q2 2026 flash estimate presents a nuanced picture rather than a simple upward or downward trend. The headline +0.5% masks significant divergence: CCR and landed properties are moving upward while the broader non-landed market (RCR, OCR) has softened or retreated modestly. For buyers, this suggests that bargaining power has returned somewhat in the mid-tier and mass-market segments, while CCR and prime landed command a premium and show no signs of price fatigue.

The record GLS supply pipeline — 61,000 units expected to complete over the next several years — is the most important structural factor for 2027 onwards. High supply typically dampens rental yields and constrains capital appreciation. Investors underwriting strong rental yield assumptions should pressure-test those models against the forthcoming supply wave.

MAS’s advisory to “exercise prudence” in the context of “highly uncertain macroeconomic outlook” is a consistent boilerplate, but the macro context in mid-2026 is genuinely uncertain: US tariff policy, global growth deceleration, and potential further geopolitical shocks could all affect Singapore’s export-dependent economy and, by extension, household income and property demand.

FAQ: URA Q2 2026 Flash Estimate

Why is the Q2 2026 flash estimate only partial data?

Flash estimates are compiled from stamp duty payment data submitted to IRAS and developer sales figures covering only the first two and a half months of the quarter (1 April to approximately mid-June). They do not include all transactions completed in June and cannot account for late-filed stamp duty submissions. URA releases full statistics, including rental, vacancy and pipeline data, at the end of July. The flash estimate is intended to give early market guidance, not a definitive picture.

What is driving CCR’s outperformance in Q2 2026?

CCR outperformance typically reflects foreign buyer demand, ultra-high-net-worth activity, and limited new supply in prime districts. Despite the 60% ABSD on foreign purchases introduced in April 2023, a residual pool of buyers for whom ABSD is not prohibitive — often high-net-worth individuals from Southeast Asia, India and Europe — continues to underpin CCR pricing. Domestic demand for CCR properties has also been relatively firm among Singapore Citizens and PRs trading up from large OCR condominiums.

Is the OCR correction a sign of a broader market downturn?

A –0.2% quarter-on-quarter movement is well within normal volatility for the OCR segment and does not signal a broad downturn. OCR prices tend to be more sensitive to the timing and reception of specific new launch projects; a quarter with fewer strong launches will naturally produce softer headline numbers. The underlying driver of OCR demand — the HDB upgrader pipeline, which remains robust given the volume of BTO completions expected in 2025–2027 — is structurally intact.

How does the GLS supply pipeline affect property prices?

High GLS supply expands the stock of private housing over a 3–5 year horizon as sites are tendered, developed and completed. More completions increase rental supply, which typically compresses rental yields, and adds to the inventory available for resale. Historically, URA has calibrated the GLS programme to balance supply and demand; a 9,320-unit Confirmed List in 2026 signals the government’s intent to sustain supply-side pressure on prices and rents. The full impact on capital values will depend on how quickly completions translate into market inventory and how strongly household formation and investment demand absorb the new supply.

When will the full Q2 2026 URA statistics be released?

URA has stated that the full set of real estate statistics for Q2 2026 will be released on 24 July 2026. The full release will include the definitive PPI (which may differ from the flash estimate), rental index, vacancy rates, pipeline supply and transaction volume by district and property type. LovelyHomes will publish a detailed analysis of the full Q2 2026 data upon release.

Disclaimer: This article is based on URA’s flash estimate press release PR26-51 dated 1 July 2026. Flash estimates are preliminary and may differ from final Q2 2026 statistics to be released on 24 July 2026. This article is for informational purposes only and does not constitute property, financial or investment advice. Readers should refer to official data at ura.gov.sg and consult a licensed property professional before making any purchase or investment decision.

Translate »