Singapore EC Cooling Measures May 2026: 10-Year MOP, 90% First-Timer Quota and End of the Deferred Payment Scheme
SINGAPORE PROPERTY NEWS — 8 MAY 2026
Singapore EC Cooling Measures May 2026: 10-Year MOP, 90% First-Timer Quota and End of the Deferred Payment Scheme
⚡ Quick Answer
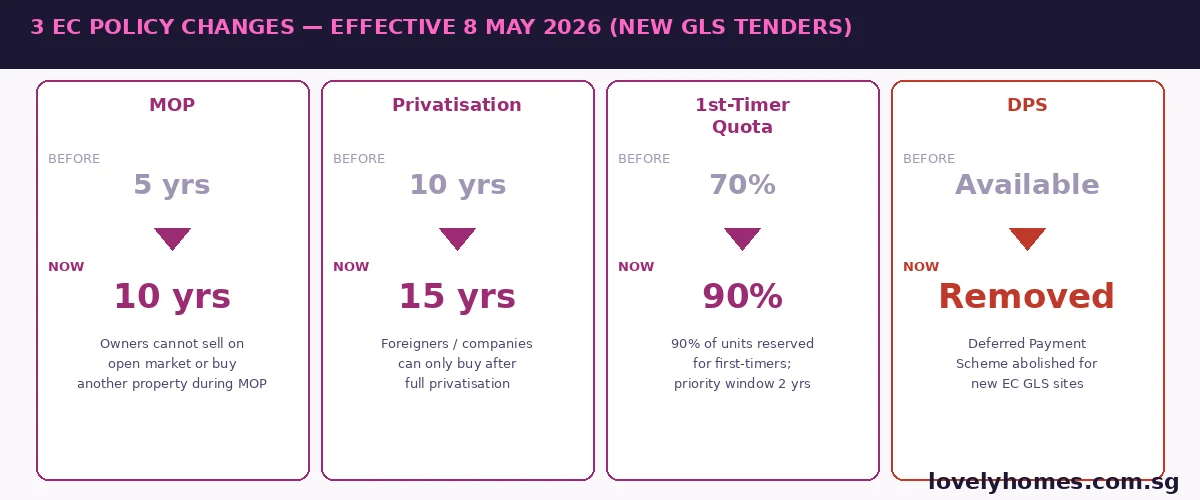
- On 8 May 2026, Minister for National Development Chee Hong Tat announced the most significant overhaul of Singapore’s Executive Condominium (EC) scheme since 2013.
- The Minimum Occupation Period (MOP) for new ECs is extended from 5 years to 10 years. During the MOP, owners cannot sell on the open market, rent out the entire unit, or purchase another residential property.
- Privatisation — when foreigners and companies can buy — is pushed from 10 years to 15 years after the date of issue of the Temporary Occupation Permit (TOP).
- The first-timer priority quota rises from 70% to 90% of units per project, with the priority window extended from one month to two years.
- The Deferred Payment Scheme (DPS) — which allowed buyers to defer most of their payment until TOP — is abolished for all new EC GLS sites with tender closing dates from 8 May 2026 onwards.
- The measures apply to new EC Government Land Sales (GLS) tender sites only. The five EC projects already in the pipeline (Senja Close, Woodlands Drive 17, Sembawang Road, Miltonia Close, and one other) are exempt from all three changes.
- The stated policy objective is to ensure ECs fulfil their original purpose as affordable, owner-occupied housing for Singapore’s sandwich class — households earning too much for HDB but unable to readily afford private condominiums.
What Was Announced on 8 May 2026?
Speaking on 8 May 2026, Minister for National Development Chee Hong Tat confirmed a three-pronged policy tightening of Singapore’s Executive Condominium scheme — the hybrid public-private housing type introduced in 1995 to serve households in the S$8,000 to S$16,000 monthly income bracket. The announcement, described by the Ministry of National Development (MND) as the most significant revision to EC rules since 2013, addresses growing concern that ECs had increasingly been purchased as investment vehicles rather than owner-occupied homes.
Industry data had shown that EC en-bloc and resale activity accelerated sharply after the five-year MOP, with developers and investors competing alongside genuine owner-occupiers. The DPS, available only on ECs and not on private new launches, had allowed buyers to purchase EC units with minimal initial outlay — attracting buyers who might otherwise not have been able to afford even the initial downpayment — and the 70% first-timer quota had left meaningful room for second-timers (typically HDB upgraders) to acquire units at launch.
Change 1: MOP Extended from 5 to 10 Years
The most consequential change is the doubling of the Minimum Occupation Period from five to ten years. During the MOP, EC owners:
- Cannot sell their unit on the open resale market.
- Cannot rent out the entire unit (subletting individual bedrooms while continuing to reside remains subject to HDB rules).
- Cannot purchase another residential property in Singapore.
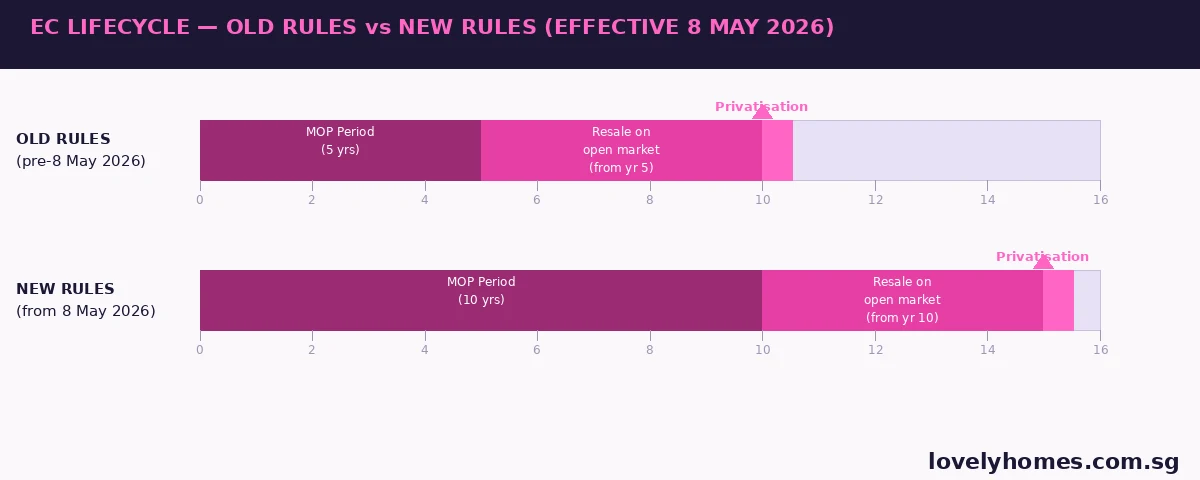
Previously, the five-year MOP — combined with progressive privatisation at 10 years — meant that an EC buyer who received their keys in 2021 could theoretically sell on the open market in 2026 and acquire a second residential property simultaneously, often realising substantial capital gains. The 10-year MOP eliminates this arbitrage window and forces a longer owner-occupation commitment more in keeping with the EC scheme’s original mandate.
The extension aligns EC MOP rules more closely with the 10-year MOP applicable to Prime Location Public Housing (PLH) and Plus-category BTO flats — a deliberate signal from MND that ECs, despite their private-development DNA, are intended as long-term homes first and investment assets second.
Change 2: Privatisation at 15 Years (up from 10)
Alongside the longer MOP, the privatisation timeline is extended from 10 to 15 years from TOP. Privatisation is the milestone at which an EC becomes a fully private condominium — when foreigners, companies, and buyers without citizenship or PR status can purchase units on the open market.
In practice, privatisation typically triggers a price re-rating: EC resale values converge toward equivalent private condominium prices once the property is fully privatised, because the pool of potential buyers expands significantly. The extension from 10 to 15 years delays this re-rating, reducing the near-term speculative premium embedded in EC purchases and moderating investment-driven demand during the launch period.
Change 3: First-Timer Quota Raised to 90%; Priority Window Extended to Two Years
Under the previous framework, developers were required to reserve 70% of EC units for first-time homebuyers during the initial one-month priority booking period. From the second month onwards, the remaining 30% — and any unsold first-timer units — could be sold to second-timers (HDB upgraders who have sold their flat).
Under the new rules:
- 90% of units must be set aside for first-time homebuyers.
- This priority window lasts for two years — not one month — meaning only 10% of units are freely available to second-timers at launch, and the remaining 90% stay ring-fenced for two full years.
The practical effect is dramatic. Second-timer demand — which has historically underpinned strong launch-day sell-through rates for ECs — is effectively squeezed out of the market for the first two years. Projects that launch under the new rules will see their second-timer allocation shrink from 30% to 10%, concentrating demand among genuine first-time buyers earning below S$16,000 per month.
Change 4: Deferred Payment Scheme Abolished
The Deferred Payment Scheme (DPS), available exclusively on EC new launches (it was prohibited for private residential new launches since 2007), allowed buyers to pay a 20% downpayment upfront and defer the remaining 80% — including the bank loan — until the project received its Temporary Occupation Permit (TOP), typically three to four years after launch.
DPS was popular among two buyer groups: HDB upgraders who still had an outstanding HDB mortgage and did not wish to service two loans concurrently during the construction period, and investors who wanted to maximise the leverage impact of an EC purchase. With DPS removed, EC buyers under the new rules will need to:
- Progress Pay — paying in tranches as construction milestones are hit, via a bank loan drawn down progressively.
- Service the EC construction loan and their existing HDB mortgage simultaneously if they have not yet sold their HDB flat (since the MOP prevents immediate HDB disposal in many cases).
The MAS’s TDSR framework (55% income cap on all debt obligations) will constrain how many HDB upgraders can absorb dual loan servicing — effectively raising the income bar for EC buyers and prioritising financially stronger applicants.
Which EC Projects Are Affected?
The new measures apply to EC Government Land Sales sites with tender closing dates on or after 8 May 2026. Five EC projects already in the tender pipeline — with tenders either closed or closing before that date — are explicitly exempt and will proceed under the existing (pre-8 May) rules:
- Senja Close EC
- Woodlands Drive 17 EC
- Sembawang Road EC
- Miltonia Close EC
- One further pipeline project (details to be confirmed by HDB/URA)
These five projects — likely to launch in 2026–2027 — are expected to see a surge of interest from second-timers and buyers who wish to purchase under the more flexible old rules. Industry observers note that buyers steering toward these exempt projects will need to act quickly, as remaining allocation for second-timers and DPS-eligible units will be finite.
Worked Example: How the New Rules Change the Numbers for a Typical EC Buyer
Scenario: Mr and Mrs Wong, both 32, Singapore Citizens, combined gross income S$12,500/month. They currently own a 5-room HDB flat in Sengkang (purchased in 2020, MOP met in 2025). They are considering purchasing a 3-bedroom EC unit priced at S$1,350,000 under the new rules.
| Factor | Old EC Rules | New EC Rules (from 8 May 2026) |
|---|---|---|
| Purchase Price | S$1,350,000 | S$1,350,000 |
| Payment Scheme | DPS: 20% now, 80% at TOP | Progress Pay only (loan drawn progressively) |
| Concurrent HDB Loan During Construction | Not required (DPS defers EC loan to TOP) | Must service both HDB + EC construction loan simultaneously |
| TDSR impact (HDB loan S$900/mth remaining) | Minimal — DPS means no EC loan repayment yet | EC drawdown ~S$3,200/mth + HDB S$900 = S$4,100 total debt; 32.8% TDSR (within 55% cap) |
| MOP before open-market sale | 5 years from TOP | 10 years from TOP |
| Foreigners can buy | From year 10 | From year 15 |
| Investment horizon implication | Potential exit at yr 5 at ~private-condo prices | Committed owner-occupier for at least 10 years; no speculative flip |
In this scenario, the Wongs’ TDSR is manageable at 32.8% even with dual loan servicing, provided the HDB loan is nearly paid down. However, if their HDB loan outstanding were S$400,000 (monthly instalment ~S$2,100), the combined debt-service ratio would rise to approximately 42.4% — still within the 55% TDSR cap but more constrained. Buyers in this position should model their TDSR carefully before committing to a new EC under progress payment terms.
What This Means for the EC Market
The measures represent a structural reset of what an EC purchase means. In the near term, the five pipeline-exempt projects are likely to see accelerated interest and potentially strong launch sell-through from buyers who want to enter under the old rules. Beyond that cohort, the EC market will become a genuinely longer-duration, owner-occupation-focused product.
For developers, the longer MOP and privatisation horizon reduces the EC product’s differentiation from standard BTO-adjacent housing, potentially affecting pricing discipline and land bid appetite for future EC GLS sites. The removal of DPS increases the effective income threshold for EC buyers — those who cannot manage dual loan servicing during the construction period may need to sell their HDB flat first before committing, introducing additional friction. Land prices for new EC sites may moderate somewhat, as the speculative premium embedded in EC bids dissipates.
For genuine first-timer buyers — the target beneficiary of all three measures — the new rules improve access meaningfully. A 90% first-timer quota with a two-year priority window essentially makes ECs a first-timer product for the first two years of sales, which is exactly the intent.
Frequently Asked Questions
Do the new EC rules affect ECs I already own?
No. The new rules apply only to EC units in GLS sites with tender closing dates on or after 8 May 2026. If you already own an EC unit — or are purchasing one of the five pipeline-exempt projects — your MOP, privatisation timeline, and DPS eligibility are governed by the rules in place at the time of your purchase. Existing EC owners are not retrospectively affected. This is consistent with how all prior EC and property cooling-measure changes have been implemented in Singapore — on a prospective (not retrospective) basis.
Can I still buy an EC as a second-timer after 8 May 2026?
Yes, but your access is significantly restricted. Under the new rules, only 10% of EC units per project are available to second-timers at launch, and this 10% allocation applies throughout the first two years of sales. After the two-year first-timer priority window, any unsold units — and the developer’s remaining inventory — can be opened to second-timers and the general market. Second-timers who are willing to wait may have access to a larger selection later, but popular projects may sell out during the priority window. Second-timers who still wish to buy an EC should act quickly on the five pipeline-exempt projects, where the existing 30% second-timer allocation applies.
Can I rent out my EC under the new rules?
During the new 10-year MOP, you cannot rent out the entire EC unit — the same restriction that applied during the previous 5-year MOP. Subletting individual bedrooms while you continue to reside in the unit may be permitted subject to HDB’s prevailing subletting guidelines, but you must check HDB’s approval requirements as they apply to EC units specifically. After the 10-year MOP is satisfied, you can rent out the entire unit on the open market. Given the longer MOP, buyers who anticipated rental income during years 5–10 under the old rules will need to revise their investment models.
How does the removal of DPS affect my monthly cash flow?
Under the old DPS, a buyer committed only 20% of the purchase price upfront and deferred the bank loan drawdown to TOP. This meant no monthly mortgage payments during the 3–4 year construction period. Under progress payment — now the only available scheme — the bank disburses the loan in tranches as the developer hits construction milestones (foundation, framework, roof, walls, etc.), and you begin servicing the loan from the point each tranche is drawn. Buyers who still have an outstanding HDB mortgage will need to budget for dual loan instalments during construction. MAS’s TDSR cap of 55% applies to all debt obligations combined, so buyers should model this carefully. Those who cannot manage dual servicing may consider selling their HDB flat before committing to the EC — though this creates a transitional housing gap.
Will EC prices fall as a result of these changes?
The near-term impact on EC prices is mixed. The five pipeline-exempt projects may see elevated prices as demand concentrates on the last cohort available under old rules. For future EC sites subject to the new rules, the removal of the DPS reduces the buyer pool (those who relied on deferred payment to manage cash flow will no longer be able to participate), while the 10% second-timer cap reduces overall demand at launch. Land prices for future EC GLS sites could moderate as the investment premium dissipates. However, ECs will retain their structural price advantage over private condominiums — the income ceiling cap (S$16,000/mth), first-timer focus, and government land sale pricing mechanism all support a meaningful discount to private market prices. LovelyHomes does not expect a dramatic price correction; rather, a moderation of the premium above private condo prices that new-rule ECs commanded in 2022–2024.
Which upcoming EC projects are exempt from the new rules?
Five EC projects in the GLS pipeline with tender closing dates before 8 May 2026 are exempt from all three new measures. As confirmed by MND, these include Senja Close EC, Woodlands Drive 17 EC, Sembawang Road EC, and Miltonia Close EC, plus one additional pipeline site. These projects will proceed under the old MOP (5 years), old privatisation timeline (10 years), existing first-timer quota (70%), and retain DPS eligibility. Expected to launch in 2026 and 2027, these projects are likely to attract strong early-stage interest from buyers who wish to secure EC units under the pre-8 May framework. Buyers should monitor HDB’s new EC launch announcements closely.
Related Articles
- Executive Condominium Singapore 2026: Complete Guide to Eligibility, MOP, Privatisation & Pricing
- ABSD Singapore 2026: Complete Guide to Additional Buyer’s Stamp Duty
- TDSR Singapore 2026: The 55% Cap and 4.0% Stress Test Explained
- HDB Upgrader Guide Singapore 2026: When to Sell, What to Buy, and How to Navigate the Transition
- LTV Limits Singapore 2026: How Much You Can Borrow
- Singapore Property Cooling Measures Timeline 2009–2026
Disclaimer: This article is a news and analysis piece based on information available as at 9 May 2026. EC policy details, effective dates, and eligibility rules are subject to change and clarification by the Ministry of National Development (MND) and HDB. Always verify the latest requirements directly with HDB (hdb.gov.sg), MND (mnd.gov.sg), and IRAS before making any property purchase decision. This article does not constitute financial, legal, or investment advice. Consult a licensed financial adviser and Singapore conveyancing lawyer before committing to any EC purchase.
Published: 9 May 2026. Sources: Ministry of National Development press statement, 8 May 2026; HDB; URA; IRAS; industry commentary. Cross-referenced against LovelyHomes EC guide (post 105772) and TDSR guide (post 105935).